
ABSTRACT
Irrigation is needed for profitable agriculture in the central Ebro valley, one of the driest regions in Europe. In this region, aridity and outcrops of saliferous strata induce soil salinity in some irrigated districts. We present a soil map of two municipalities (about 32 km2) coping with soil salinity and currently changing their irrigation from flood to pressurized systems. The 1:25,000 scale map displays 27 Soil Series following the Soil Taxonomy approach and records local pedodiversity for the first time. The scale of the map and its delineation on orthophotographs enables users to locate each agricultural plot (typical size ∼1 ha) and to assign the soil information relevant for irrigation, and then a Soil Phase for salinity. Saline soils occur in irrigated areas totaling 24% of the total surface of the two municipalities studied. The salinity mapping plus other soil features used for map unit definition (texture, stoniness, and available water holding capacity), allow recommendations about the design of irrigation system enhancements.
1. Introduction
Improving water use and management is a goal of agricultural and environmental policies worldwide. Due to the aridity of much of its territory, Spain has the largest irrigated area in Western Europe, with 38,100 km2 (CitationFAO, 2014). Irrigation, needed to guarantee agricultural production, accounts for over 75% of water consumption and involves about 13% of the agricultural lands, one-third of which is still irrigated by flooding (CitationINE, 2008). The Spanish Government promotes a change to pressurized irrigation and other modernization measures for about two million irrigated hectares in order to save water (CitationLecina, Isidoro, Playán, & Aragüés, 2010). Adequate water management is essential to preserve soil and water in semiarid areas such as the central Ebro River Basin, NE Spain, with a mean ET0 of 1315 mm and annual rainfall of 350.3 mm in Zaragoza from 1941 to 1991 (CitationFaci & Martínez-Cob, 1991).
Modernization measures including new canals, dams and more recently web sites, are much more politically relevant than items such as soil maps that need field work conducted by trained personnel. However, the overlooking of soil has led to the failure of heavy investments in some irrigated districts of the Ebro valley as well as in other areas around the world. Scientific knowledge of soils can result in maps which can be tailored for specific applications.
Soil properties are often estimated and represented at regional or global scales (CitationAksoy, Yigini, & Montanarella, 2016; CitationDijkshoorn, Huting, & Tempel, 2005). More detailed soil maps can provide a knowledge base for agricultural management and more efficient use of natural resources. In order for the map to be usable by farmers, technicians, environmentalists, and designers of irrigation systems, the scale, and presentation of the map must allow the recognition of at least the unit of management; in the Mediterranean region and other areas of the world management units are often < 1 ha.
In the semiarid lands of the central Ebro Basin irrigation faces two main problems, soil salinity and characteristics of the parental materials such as horizontality of strata, interbedded saliferous and sodic materials (CitationLebrón, 1988), and poor deep drainage. This situation contrasts with other irrigated districts around the world suffering from problems such as salinity of irrigation water, difficult regional drainage, or sea water intrusion.
Saline soils in the central Ebro Basin constitute a significant percentage of agricultural areas (CitationAyers, Vázquez, De la Rubia, Blasco, & Samplón, 1960; CitationDaliakopoulos et al., 2016; CitationHerrero & Aragüés, 1988; CitationToth et al., 2008), requiring mapping and monitoring to avoid environmental and economic damage. Different approaches have been adopted in the region for mapping and monitoring soil salinity by CitationBetrán (1986), CitationRodríguez-Ochoa, Herrero, and Porta (1989), CitationDíaz and Herrero (1992), and CitationHerrero and Pérez-Coveta (2005), among others. Soil features together with land leveling that brings saliferous geological materials to the surface pose difficulties for transforming rainfed into irrigated agriculture. Moreover, a common drawback in arid areas changing to new irrigation technologies is the fading of farmers’ knowledge, as traditional systems are changed to industrial agriculture.
In this context, the production of soils maps based on soil-forming processes (CitationBrevik & Hartemink, 2013; CitationUbalde, Sort, & Poch, 2011) can easily take into account soil factors relevant to irrigation system design and improvement. Describing and naming soils according to standard and widely accepted criteria, for example, Soil Taxonomy (CitationSoil Survey Staff, 1999) enables the sharing of experience and the information exchange needed when dealing with new irrigation technologies. Moreover, soil surveys based on a comprehensive taxonomy at detailed scales are required for designing irrigation systems and for subsequent in-field assessments.
This work presents a municipal soil map based on Soil Taxonomy to show the diversity of soils in the area and highlighting soil properties of interest for agricultural management of irrigation districts. This 1:25,000 map displayed over aerial photography is intended to help stakeholders choose the kind of irrigation upgrade to increase water use efficiency and to meet societal environmental demands. The scientific foundation of the map will make deriving other specific maps easier when required for future purposes.
2. Study area
The study area lies in the Ebro Basin and consists of the municipalities of Barbués and Torres de Barbués (). The area includes 3158 ha (3366 ha total) of agricultural land, from which 91% (2877 ha) is irrigated with water of low electrical conductivity diverted from Pyrenean rivers through the Monegros canal. The remaining 208 ha are urban areas, the Flumen River, and other nonagricultural areas. Irrigation effluents and return flows go to the River Flumen that is the natural drainage for the area. The low terraces of the River Flumen have been irrigated for at least four centuries using a traditional inundation system. From the 1950s, the years when the biggest irrigation works were being constructed in the basin by the Government, leveling and irrigation schemes extended in the region outside the river terraces. Most of the study area at present is changing to pressurized systems. The main irrigated crops are alfalfa, barley, corn, rice, sunflower, wheat, and rye-grass. Rice is predominant only in salinity prone areas.
Figure 1. Location of the two municipalities studied and main irrigation elements in the area.
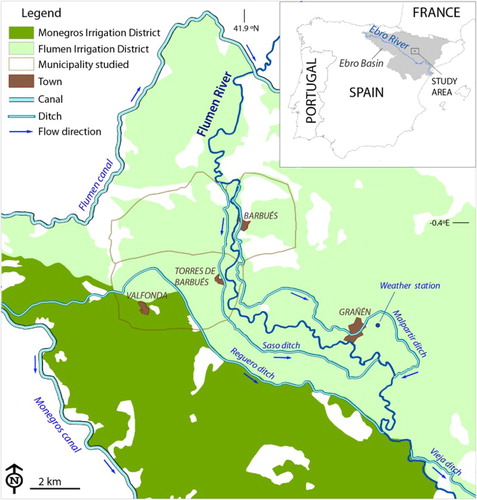
Elevation ranges from 320 to 390 m a.s.l. Climate is semiarid, with a mean annual temperature of 13.6°C, a mean annual precipitation of 341.2 mm, whilst the mean annual reference evapotranspiration is 1203.6 mm, from data recorded at the Grañén weather station from 2003 to 2016 (). The soil temperature regime is thermic and the soil moisture regime is aridic or xeric according to CitationSoil Survey Staff (1999).
According to the geological map (CitationSanz, García, & Samsó, 1991) most of the study area (83%) is covered by Quaternary materials which include Flumen River terraces, degraded glacis, alluvial–colluvial sediments, and valley bottom deposits. Materials of Miocene age cover 17% of the area and consist of alternating horizontal strata of lutites and sandstones, which are often saliferous. The main geomorphic processes are controlled by the accentuated seasonal contrast, scarce vegetation cover, poorly developed soils, strong mechanical erosion, and transport of detrital materials (CitationRodríguez-Vidal, 1986).
3. Methodology
The soil survey (CitationNogués, 2002) started with stereoscopic photointerpretation of black and white aerial photographs at 1:20,000 scale taken in June 1990 and was followed by field work. The main geomorphic units were delimited based on the Mapa Geológico Nacional (MAGNA) geologic map at 1:50,000 scale and the available digital terrain model (DTM) obtained from the National Geographic Institute with a pixel size of 25 m. Representative soil profiles were described over the four geomorphic units in pits dug with a backhoe up to 2 m deep or to the lithic or paralithic contact, and classified according to Soil Taxonomy. The soil survey data and the geomorphic units were integrated to compile preliminary map units over prints of aerial photographs enlarged to 1:10,000 scale. The soil map units are consociations and complexes, following the guidelines of CitationVan Wambeke and Forbes (1989).
The main soil properties considered were salinity, water retention capacity, coarse fragments at the soil surface, and textural class of the upper soil horizon. Soil salinity was determined for geomorphic units prone to salinity by carrying out an electromagnetic induction survey (CitationNogués, Robinson, & Herrero, 2006).
Available water holding capacity and texture were determined in soil samples collected from pits and complemented with 217 auger holes (up to 1.5 m deep) as auxiliary soil data (soil color, feel texture, penetrability, compactness, moisture, etc.) described in the field in order to locate and verify boundaries between map units. The density of soil observations was one per 11 ha.
The polygons were transferred on the screen over the orthophotographs from 1997 in a geographic information system. A high-resolution DTM generated from airborne LiDAR data (absolute vertical accuracy of 0.20 m; density of 0.5 points per square meter) was used to check the elevation of the geomorphic units.
Data from laboratory and field analyses of soil samples and descriptions of the representative soil profiles are available in CitationNogués (2002). Three maps of interest for irrigation were derived: salinity, available water holding capacity up to 1.5 m depth, and texture of soil surface layer plus coarse components.
4. Results and discussion
4.1. Geomorphic units
The main geomorphic units () of the two municipalities studied are listed in . Bottoms include low-lying areas, relative to the other geomorphic units, and consists of valley bottoms and depressions where water flows can accumulate salts. Terraces of the Flumen River are covered by small sized but highly productive orchard plots. A variety of planar surfaces of different origin and lithology can be found in the platforms (CitationNogués, 2002; CitationRodríguez-Vidal, 1986). The slopes connect the bottoms with platforms and terraces and favor the mobilization of soluble salts from the underlying saliferous lutites, especially after soil disturbance caused by recurrent leveling earth works in the area.
Figure 2. Geomorphic units mapped in the study area with the soil profiles used for defining Soil Series, and the auger sampling sites for the specific soil salinity survey.
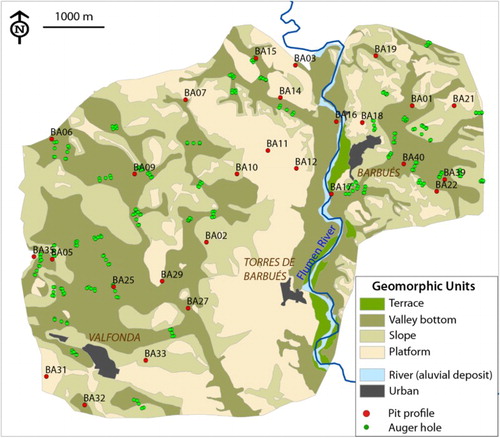
Table 1. Characteristics of the main geomorphic units of the study area.
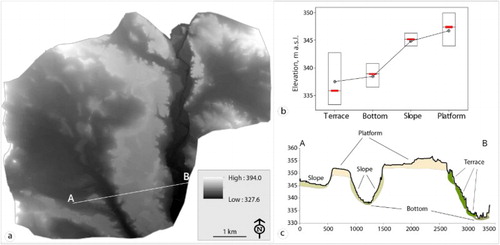
The Flumen River enters the study area at 356 m a.s.l. and leaves it at 328 m after traveling about 6 km with a drop of 28 m in elevation and a general slope of 3%. The land slope is < 2% in 52% of the study area and > 10% only in 5% of the area. The mean elevation of the geomorphic units gradually decreases from the platform unit (mean 359 m a.s.l.) to the Flumen terraces unit (mean 337 m a.s.l.). The differences between the median elevations of each of the four geomorphic units are significant and consistent (). The interquartile ranges also seem consistent, with the broadest for the river terraces followed by the platforms. The significant differences in elevation between the geomorphic units obtained from LiDAR data reinforce the reliability of these units which were first established by CitationNogués (2002) using geomorphic criteria.
Figure 3. (a) LiDAR-derived DTM of the study area. (b) The elevation of the four geomorphic units, medians and their confidence interval (in red), interquartile range boxes, means and their line connection. (c) A–B cross profile with the main geomorphic units labeled. (color online)
4.2. Map units and soil map legend: the Soil Series
As noted by CitationHartemink (2015) the use of Soil Taxonomy is more frequent in the USA than in Europe. In Spain, the map of Barbués was one of the first published soil maps based on Soil Taxonomy and drawn over an orthophotograph at a scale allowing identification of agricultural plots, with a typical size of ∼1 ha in the study area. A total of 133 map units were delineated at 1:25,000 scale and constitute the soil map legend (). This soil map is considered detailed because it: (1) involves one soil observation per 11 ha; (2) depicts Soil Series that represent the highest precision level in Soil Taxonomy; and (3) establishes consociations and complexes of Series for grouping the different soil taxa identified in the field (CitationVan Wambeke & Forbes, 1989). The soil complexes contain two or more dissimilar taxa occurring with a repeating pattern, whereas soil consociations are map units dominated by soils of a single soil taxon. Finally, soil taxa were modified with the salinity phases obtained from the soil salinity survey.
Figure 4. Soil map of Barbués and Torres de Barbués and an enlarged sample area. The scale of the map allows identification of individual plots and the soil attributed to them. The labels in the sample area are explained in .
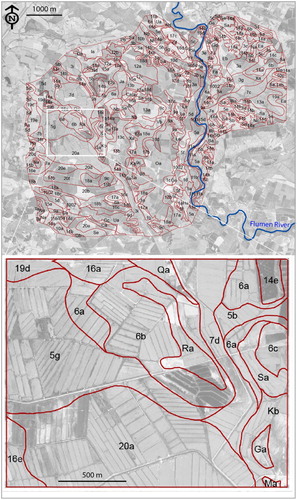
The soil map comprises 27 Soil Series () belonging to 12 Soil Subgroups and three Soil Orders, Aridisols, Entisols, and Inceptisols, whose surface extents are 8.9%, 63.8%, and 27.3%, respectively. Aridisols include the Subgroups Xeric Haplocalcids and Calcic Petrocalcids. Entisols consist of Haplic Xerarents, Oxyaquic, and Typic Xerofluvents, and Lithic, Lithic Xeric, Oxyaquic, and Typic Torriorthents. Inceptisols consist of Petrocalcic and Typic Calcixerepts, and Gypsic Haploxerepts. shows the soil map of the two municipalities studied and the legend corresponding to the Soil Series of a sample area.
Table 2. Soil Series in the soil map of Barbués and Torres de Barbués, with their classification, extent, and typic pedon (CitationNogués, 2002).
The resulting soil map is user-oriented in that it summarizes the soil physical and chemical properties that are relevant for agriculture. The definition of map units, based on Soil Series complemented with salinity phases, is focused on the problem of irrigation in salinity prone areas. These units are established in terms of soil depth, drainage, texture, and coarse fragments at the surface horizon, soil water retention capacity, and geomorphic unit (). The soil map represents a landscape model whose units can include more than one soil taxon.
Table 3. Map units (consociations in italic, complexes in bold) appearing in the sample area of , and main characteristics of the corresponding Soil Series.
The system of soil classification used illustrates the soil diversity that cannot be represented by the geomorphic mapping alone. Furthermore, as discussed by CitationBrevik et al. (2016), the information from the soil map can be used to address issues beyond agronomic production or to improve the quality of geologic or geomorphic maps that are not available in the area with sufficient or desirable resolution. This usefulness of soil maps to refine or guide geological mapping has been highlighted by CitationBrevik and Miller (2015) in the context of soil mapping in the USA.
In order to extend the soil map with new sheets or to compare the map units from different locations, standardization (CitationBrevik & Arnold, 2015) and correlation of Soil Series are needed. However, the Soil Series established for Barbués have not been submitted to a map correlator because there is no regional soil mapping program. This situation can justify the definition of some Series with very little extent (≤ 5 ha, ) because our experience in adjacent areas suggests that they might cover much larger areas. To our knowledge, correlation of Soil Series in Spain has been carried out only by CitationIGC (2012) on their soil maps at 1:25,000 scale that also uses Soil Taxonomy as the classification system, and Soil Series as the taxonomic unit.
4.3. Application of maps for irrigation design
Three maps at 1:25,000 scale display soil properties of interest for improving irrigation in the area: soil salinity, available water holding capacity, and soil texture plus coarse fragments (see Main Map associated with this article). These maps are essential for irrigation design and management. Enhancing decision-making is one of the key purposes of soil surveys (CitationArnold, 2016) and the utility (or success) of a soil map is determined by its final users. CitationHerrero, Robinson, and Nogués (2007) derived from the soil map a suitability map for (1) standard frequency sprinkling; (2) high-frequency sprinkling; and (3) flood irrigation. This would be the map for decision-makers and irrigators concerned with upgrading irrigation systems. These maps allow an understanding and forecasting the impacts of their decisions. Moreover, the advantage of using Soil Taxonomy is that many data sets and guidelines for analyses and interpretations are of broad use and available to the public on the Internet.
4.3.1. Soil salinity phases
The distribution of saline and non-saline soils corresponds to that of geomorphic units, since the landscape controls the redistribution of salts. For this reason, the salinity survey was limited to the bottoms and slopes (CitationNogués et al., 2006), where the water seeps causing salinization due to the evaporation in low-lying landscape positions. The map of salinity phases includes 494 ha slightly or moderately saline, and 262 ha strongly or very strongly saline. Saline soils are found only in irrigated areas and represent 24% of the two municipalities studied.
4.3.2. Available water holding capacity (AWHC)
The map of AWHC was obtained for a soil depth of 1.5 m for the 27 soil Series (CitationHerrero et al., 2007). The five classes established on the map correspond to AWHC data ranging from very low (< 64 mm) to very high (> 250 mm) and follow the classes established by CitationSoil Conservation Service (1983). Sixty-six percent of the area has low (64–107 mm) or very low (< 64 mm) available water retention capacities and mainly correspond to soils with moderately coarse textures (65% of area with very low AWHC) though low capacities are also found in moderately fine-textured soils (51% of area with low AWHC). Soils with low irrigation efficiency (CitationHerrero et al., 2007) correspond to platforms and are suitable for changing the irrigation system into sprinkle irrigation. Thirty-three percent of the study area has high to very high available water retention capacities and these soils also have a high efficiency of flood irrigation. Most of this area has rice cultivation.
4.3.3. Soil texture and coarse fragments in the surface horizon
The distribution of textural classes and coarse fragments controls surface water ponding. Problematic soils have moderately fine-textured surface layers which limit the water flow. In the study area, these soils occur on platforms covered with > 5% of coarse fragments and where infiltration velocities are high (CitationHerrero et al., 2007). The surface layer is almost free of coarse fragments (< 5%) in 59% of the study area and soils are susceptible to infiltration problems.
5. Conclusions
Soil mapping at detailed scales collects pedological information that requires simplification to be easily understood by stakeholders and ready for application. Our map provides information about soils at a scale useful for irrigation design and management. The derived maps of water holding availability, soil salinity, and texture – as the main limitations for the modernization of irrigation in the study area – show the distribution of the target soil features for the design of irrigation upgrades. Soil Taxonomy performed well in gathering soil properties of interest not only from the point of view of genesis and diversity but also for application to agriculture and environment. The map will help to modernize irrigation systems, thus responding to the societal demand for wise water irrigation use under critical conditions driven by aridity and potential salinity. The definition and mapping of Soil Series of Soil Taxonomy, complemented with the delineation of soil salinity phases, meets these requirements.
Software
Esri ArcGIS® v.10.3 was used for spatial analysis of vector and raster data. The digital elevation model was processed using ArcGIS as well as Erdas Imagine® 2015. Maps were produced in the ETRS89 reference system and UTM 30 N and edited with Adobe Illustrator CS5. Statistical data were processed within StataIC v.12 and Minitab v.15.
Soils of Barbués and Torres de Barbués, Ebro Basin, NE Spain.pdf
Download PDF (6.9 MB)Disclosure statement
No potential conflict of interest was reported by the authors.
Additional information
Funding
Related Research Data
References
- Aksoy, E., Yigini, Y., & Montanarella, L. (2016). Combining soil databases for topsoil organic carbon mapping in Europe. PLoS One, 11(3), e0152098. doi: 10.1371/journal.pone.0152098
- Arnold, R. W. (2016). Perspectives about the national cooperative soil survey. Advances in Agronomy, 136, 1–26. doi: 10.1016/bs.agron.2015.11.003
- Ayers A. D., Vázquez, A., De la Rubia, J., Blasco, F., & Samplón, S. (1960). Saline and sodic soils of Spain. Soil Science, 90(2), 133–138. doi: 10.1097/00010694-196008000-00010
- Bates, R. L., & Jackson, J. A. (1990). Glossary of geology (3rd ed.). Virginia: American Geological Institute. p. 788.
- Betrán, J. A. (1986). Mejora de los suelos de la finca Pompenillo. Lérida, Spain: Proyecto Fin de Carrera. Escuela Técnica Superior de Ingenieros Agrónomos.
- Brevik, E. C., & Arnold, R. W. (2015). Is the traditional pedologic definition of soil meaningful in the modern context? Soil Horizons, 2015, 1–8.
- Brevik, E. C., Calzolari, C., Miller, B. A., Pereira, P., Kabala, C., Baumgarten, A., & Jordán, A. (2016). Soil mapping, classification, and pedologic modeling: History and future directions. Geoderma, 264, 256–274. doi: 10.1016/j.geoderma.2015.05.017
- Brevik, E. C., & Hartemink, A. E. (2013). Soil maps of the United States of America. Soil Science Society of America Journal, 77, 1117–1132. doi: 10.2136/sssaj2012.0390
- Brevik, E. C., & Miller, B. A. (2015). The use of soil surveys to aid in geologic mapping with an emphasis on the Eastern and Midwestern United States. Soil Horizons, 2015, 1–9.
- Daliakopoulos, I. N., Tsanis, I. K., Koutroulis, A., Kourgialas, N. N., Varouchakis, A. E., Karatzas, G. P., & Ritsema, C. J. (2016). The threat of soil salinity: A European scale review. Science of the Total Environment, 573, 727–739. doi: 10.1016/j.scitotenv.2016.08.177
- Díaz, L., & Herrero, J. (1992). Salinity estimates in irrigated soils using electromagnetic induction. Soil Science, 154, 151–157. doi: 10.1097/00010694-199208000-00009
- Dijkshoorn, J. A., Huting, J. R. M., & Tempel, P. (2005). Update of the 1:5 million soil and terrain database for Latin America and the Caribbean (SOTERLAC; ver. 2.0). Wageningen: ISRIC World Soil Information.
- Faci, J., & Martínez-Cob, A. (1991). Cálculo de la evapotranspiración de referencia en Aragón. Departamento de Agricultura. Gobierno de Aragón. p. 115. Retrieved October 22, 2016, from http://hdl.handle.net/10261/73507
- FAO. (2014). FAO statistical year book 2014. Budapest: Europe and Central Asia food and agriculture. Food and Agriculture Organization of the United Nations Regional Office for Europe and Central Asia. p. 130.
- Goudie, A. S. (2004). Encyclopedia of geomorphology. New York, NY: Routledge Ltd, Taylor & Francis. p. 1155.
- Hartemink, A. E. (2015). The use of soil classification in journal papers between 1975 and 2014. Geoderma Regional, 5, 127–139. doi: 10.1016/j.geodrs.2015.05.002
- Herrero, J., & Aragüés, R. (1988). Suelos afectados por salinidad en Aragón. Surcos de Aragón, 9, 5–8. Retrieved October 22, 2016, from http://hdl.handle.net/10261/34506
- Herrero, J., & Pérez-Coveta, O. (2005). Soil salinity changes over 24 years in a Mediterranean irrigated district. Geoderma, 125, 287–308. doi: 10.1016/j.geoderma.2004.09.004
- Herrero, J., Robinson, D. A., & Nogués, J. (2007). A regional soil survey approach for upgrading from flood to sprinkler irrigation in a semi-arid environment. Agricultural Water Management, 93, 145–152. doi: 10.1016/j.agwat.2007.07.003
- Institut Geologic de Catalunya (IGC). (2012). Mapa de sols de Catalunya 1:25,000 (MSC25M). Especificacions Tecniques ED-002/12. Generalitat de Catalunya. p. 122. Retrieved October 22, 2016, from http://www.igc.cat/web/files/igc_ED_002_12.pdf
- Instituto Nacional de Estadística (INE). (2008). Boletín informativo del Instituto Nacional de Estadística. Retrieved October 22, 2016, from http://www.ine.es/revistas/cifraine/0108.pdf
- Lebrón, I. (1988). Suelos salino-sódico-alcalinos en la Depresión Media del Ebro. Condiciones de formación, características y propiedades (Ph.D. Thesis). Universidad de Zaragoza. 483 pp. Retrieved October 22, 2016, from http://hdl.handle.net/10261/78378
- Lecina, S., Isidoro, D., Playán, E., & Aragüés, R. (2010). Irrigation modernization and water conservation in Spain: The case of Riegos del Alto Aragón. Agricultural Water Management, 97, 1663–1675. doi: 10.1016/j.agwat.2010.05.023
- Nogués, J. (2002). Mapa de suelos (E 1/25000) de Barbués y Torres de Barbués [Soil map at 1:25,000 scale of Barbués and Torres]. Zaragoza: Consejo de Protección de la Naturaleza de Aragón. Retrieved October 22, 2016, from http://hdl.handle.net/10532/3458
- Nogués, J., Robinson, D. A., & Herrero, J. (2006). Incorporating electromagnetic induction methods into regional soil salinity survey of irrigation districts. Soil Science Society of America Journal, 70, 2075–2085. doi: 10.2136/sssaj2005.0405
- Rodríguez-Ochoa, R., Herrero, J., & Porta, J. (1989). Suelos de regadío con drenaje enterrado. Guía de excursiones. Lleida, Spain: XVI Reunión de la Sociedad Española de la Ciencia del Suelo. p. 95.
- Rodríguez-Vidal, J. (1986). Geomorfología de las Sierras Exteriores Oscenses y su piedemonte. Huesca: Instituto de Estudios Altoaragoneses . p. 172. Retrieved October 22, 2016, from http://bibliotecavirtual.aragon.es/bva/i18n/catalogo_imagenes/grupo.cmd?path=3713248
- Sanz, J., García, J. M., & Samsó, J. M. (1991). MAGNA 50 (2nd Series) Sheet No. 324. Grañén: IGME, Geological Survey of Spain.
- Soil Conservation Service. (1983). National Soils Handbook, Title 430-VI. Washington, DC: USDA. pp. 603–623. Retrieved October 22, 2016, from http://hdl.handle.net/2027/umn.31951002910359j
- Soil Survey Staff. (1999). Soil taxonomy (2nd ed.). Washington, DC: Natural Resources Conservation Service, Handbook 436. US Department of Agriculture. p. 869.
- Toth, G., Adhikari, K., Varallyay, G., Toth, T., Bodis, K., & Stolbovoy, V. (2008). Updated map of salt affected soils in the European Union. In G. Toth, L. Montanarella, & E. Rusco (Eds.), Threats to Soil Quality in Europe (pp. 65–77). Luxembourg: EUR 23438 EN, Office for Official Publications of the European Communities. Retrieved October 22, 2016, from http://eusoils.jrc.ec.europa.eu/ESDB_Archive/eusoils_docs/other/EUR23438.pdf
- Ubalde, J. M., Sort, X., & Poch, R. M. (2011). How soil forming processes determine soil-based viticultural zoning. Journal of Soil Science and Plant Nutrition, 11, 100–126. doi: 10.4067/S0718-95162011000100009
- Van Wambeke, A., & Forbes, T. R. (1989). Guidelines for using soil taxonomy in the names of soil map units ( Technical Monograph 10). Washington, DC: USDA, Soil Management Support Services.