
ABSTRACT
The European Landscape Convention (ELC) has encouraged affiliated countries to develop several assessment methodologies to facilitate land management in an effort to develop compatible, integrative assessment techniques that can be applied in diverse geographic settings. Here we begin to address the question of how to develop comprehensive landscape assessments based on the criteria of the ELC by integrating landscape studies using biophysical and visual characteristics. We assessed visibility, quality, and fragility to determine aptitude for protection based on both biophysical and visual landscape units. We selected the Martin River Cultural Park (Aragon, Spain) as a study area because it is recognized as a site of cultural and geomorphological importance, it is situated in a signatory country to the ELC, but has not been subject to any landscape assessment. The resulting maps of aptitude for protection can be used to prioritize landscapes for protection based on their levels of quality and fragility.
1. Introduction
Geographic approaches to landscape studies are found more commonly in land management than in other fields (CitationNaveh & Lieberman, 2013). The landscape is understood as a common patrimony, and therefore legal standards are established to define it, incorporate it in territorial planning, and protect it when necessary (CitationDéjeant-Pons, 2006; CitationFisher, 1995; CitationTress, Tress, Decamps, & d’Hauteserre, 2001). This has contributed to the proliferation of both scientific and technical landscape studies (CitationFarina, 2009), often with divergent objectives and methodologies.
This study is based on the integration of two such divergent landscape-analysis methodologies, both used in territorial planning, but with different theoretical assumptions, methods, and results. Several methodological frameworks exist for landscape mapping (CitationGómez Zotano & Riesco Chueca, 2010). We have selected two widely used and proven frameworks in spatial planning, and enhanced the methodology of both.
The first of these is the process proposed by CitationPriego-Santander, Bocco-Verdinelli, Mendoza-Cantú, and Garrido-Pérez (2010), with its epistemological basis in the Complex Physical Geography of the Russian School of the early twentieth century. Here the landscape is characterized, following a holistic perspective of geographic space, systematically and hierarchically based on its natural components (CitationRichling, 1983). CitationPriego-Santander et al. (2010) updated these methods for geographical information system (GIS) applications and to permit implementation at higher resolutions (1:25,000–1:50,000 scale). Their approach has been used frequently in territorial planning in diverse geographic settings of Latin American countries – and Mexico in particular (CitationBocco-Verdinelli, Priego-Santander, & Cotler, 2010) – and in scientific studies (e.g. CitationCampos Sánchez & Priego-Santander, 2011). Recently, CitationFranch-Pardo, Priego-Santander, Bollo-Manent, Cancer-Pomar, and Bautista (2015) and CitationFranch-Pardo, Espinoza-Maya, Cancer-Pomar, and Bollo-Manent (2016) adapted this methodology for use in a section of Spain’s Iberian mountain range.
The second methodology is intended to satisfy the requirements of the European Landscape Convention (ELC; CitationCouncil of Europe, 2000). The landscape in the ELC is understood as a fundamental integrator between biophysical criteria, policies, visual factors, and perceptions of its inhabitants (CitationJones & Stenseke, 2011), and its fundamental objective is the incorporation of landscapes into territorial planning and policy evaluation (CitationFry, Tveit, Ode, & Velarde, 2009; CitationMartín Ramos & Otero Pastor, 2012). Of the methodologies based on the ELC, we have selected the landscape maps generated in parts of Aragon, Spain (CitationGovernment of Aragon, 2007–2013), focusing on three aspects:
visibility analyses;
territorial units (Visual Landscape Units, VLUs);
evaluations, for each VLU, of different landscape variables pertaining to valuation mandated by the ELC. This corresponds to repeated references in the preamble and articles 1 and 6 to landscape quality, and to the need described in article 6 to assess and qualify landscapes according to previous assessments (CitationCouncil of Europe, 2000).
Following the call for deeper engagement between human and physical geography, the need exists for methodologies that integrate traditional biophysical and social factors and are applicable in diverse geographic settings. These criteria favour methodologies that facilitate understanding of different values constructed on the landscape and permit effective management (CitationStephenson, 2008). Spain’s accession to the ELC has prompted a series of landscape studies by autonomous communities with the ELC as the common conceptual base, but without common methodological bases. This study focuses on the question of how to integrate methodologies with different epistemological assumptions. With this integration, we provide CitationPriego-Santander et al.'s (2010) methods the visibility analysis and valuation that it previously lacked, and provide the CitationGovernment of Aragon’s (2007–2013) cartography a consolidated set of biophysical characteristics established by the Russian school.
2. Objectives
We applied the methodological process developed in this study to the Martín River Cultural Park, (MRCP, Aragon, Spain) to reach the following three objectives:
conduct a visibility analysis in the study area that will also serve as the basis of the analyses used to meet the following two objectives;
production of a technique to incorporate this visibility analysis into biophysical units previously derived using the methodology of CitationPriego-Santander et al. (2010) to evaluate quality, fragility, and aptitude for protection;
mapping of the study area by VLUs and integration of the biophysical units. The Complex Physical Geography corresponds, in biophysical terms, to the requirement expressed in article 6 of the ELC for integrated assessments of the landscape that employ different methodologies and experiences developed throughout Europe. The scale of the VLUs, on the other hand, is useful for land management.
3. Study area
The Martin River is a right tributary of the Ebro River, flowing from the Iberian Range. The MRCP is located along the central section of the Martin River and extends 59 kilometres SSW-NNE ().
Figure 1. Location of the Martin river cultural park in Aragon, Spain.
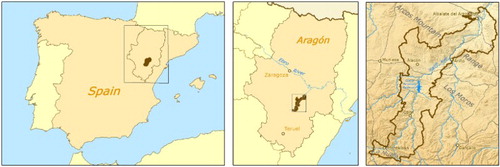
The MRCP is designated a protected area under section 12/1997 of the law of Cultural Parks of Aragon (Parques Culturales de Aragón). This legal designation represents institutional recognition of the region’s geomorphological significance (fluviokarstic canyons and structural relief), biogeography (Mediterranean montane and riparian vegetation), and extensive cultural patrimony, including cave paintings found throughout the park (Fernández Martín et al., Citation2012). The rural, predominantly montane, tourist area is situated in the Teruel Province of the Autonomous Community of Aragon, Spain, and covers 379.3 km2, with a population of 5056 and 7.5 inhabitants per square kilometre (including the municipal extensions) (see ). In addition to a cultural park, BirdLife International has declared the site an Important Bird Area (IBA) (CitationBLI, n.d.).
Despite the MRCP’s characteristics and Spain’s commitment to the ELC, no landscape assessments have been implemented to facilitate territorial planning. This study is meant to fill that gap.
4. Methods
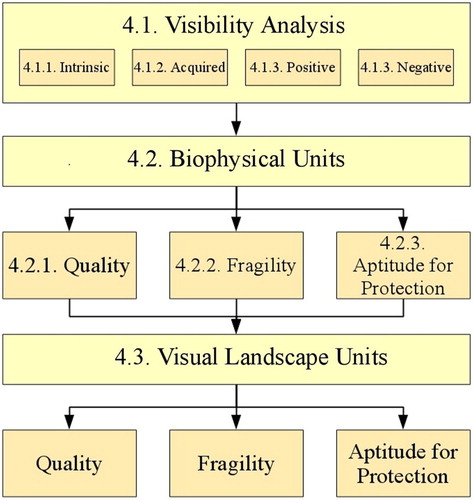
The following methods were used to reach the previous objectives (see ):
Visibility analysis of the MRCP (section 4.1). This covers the processes used to generate the intrinsic-visibility map (4.1.1), visual accessibility map (4.1.2), and maps of positive and negative visual elements (4.1.3). These maps are used in the following two stages.
Landscape evaluation by biophysical units (section 4.2). This involved evaluation of the landscape by biophysical units in terms of visual quality (4.2.1), fragility (4.2.2) and aptitude for protection (4.2.3).
Mapping of the MRCP by VLUs (section 4.3). This entailed integrating the biophysical units into the VLUs and conducting landscape evaluations by VLU.
Figure 2. Overview of the three phases and maps associated with each. The arrows indicate that maps from the previous phase were used in the generation of those in the subsequent phase.
4.1. Visibility analysis of the MRCP
Mapping of the visual capacity of a territory is a land-management technique used to diagnose the geographical suitability of possible land-use changes by evaluating the visual impact of changes to the existing landscape (CitationSevenant & Antrop, 2007).
4.1.1. Intrinsic visibility
Intrinsic visibility, or cumulative viewshed (CitationWheatley, 1995), is the classification of territory as a function of its observability, and is intended to identify the most visible spaces in the study area in contrast to the least visible. We used the following procedure:
Generate a gridded mesh of points distributed evenly every 250 m over the entire study area, totaling 6049 points;
Using an existing 1:5000 contour-line map (CitationIDEARAGON, n.d.), develop a one-meter resolution digital elevation model (DEM) with a 5 kilometres buffer to neutralize edge effects (CitationSevenant & Antrop, 2007). This resolution was selected to reduce the effects of DEM error (CitationRiggs & Dean, 2007);
Using Python to automate the process in Esri ArcGIS®, conduct a Viewshed analysis for each of the 6049 points;
Each Viewshed analysis generates a Boolean raster of ones for visible pixels and zeros for invisible. Adding together all 6049 rasters reveals the number of points from which each pixel is visible (i.e. generated a 1), and the values are normalized to percentages by counting the number of times the pixel is visible out of the number of times it is analysed (see Main Map 1.A).
4.1.2. Visual accessibility
Visual accessibility is based on the average number of expected observers as estimated from the concentration of residential zones, which represent places where people are located, and transportation networks, which represent routes they travel along. This visibility assessment is estimated as follows:
Identification of locations where observers are located, in this case, human settlements, roads, and hiking trails;
Estimation of visibility of all pixels from these locations;
Estimation of the average number of observers using official publications, census data, and vehicle registrations (CitationIDEARAGON, n.d.).
Following CitationLa Rosa (2011), we used Viewshed analysis, but limited the origin points to those containing observers. As roads and trails are represented as vectors in a GIS, the vertices of the lines were used, with a maximum distance of 100 metre separation. In the case of settlements, also represented by vectors, the vertices of street intersections were used.
Finally, using the census and road capacity data (CitationIDEARAGON, n.d.), we estimated the number of individuals that live in and regularly pass through each observation point, that is, the number of expected observers. The map obtained from this analysis is presented on the Main Map (1.B).
4.1.3. Maps of positive and negative visual elements
This analysis is intended to assess the visibility of positive (i.e. of scenic or aesthetic interest) and negative (i.e. considered unwanted or deleterious) elements observed in the landscape. This requires an existing map of the location of features in the MRCP classified as follows:
Positive elements: those with historical value, including churches, historical centres, hermitages, farmhouses and homesteads, and archaeological sites; geomorphosites, including caves, grottoes, and fluviokarstic canyons; and the presence of water, including fountains, springs, rivers, and reservoirs).
Negative elements: power lines, fire breaks, open-pit mines, industrial sites, remote buildings without historical-aesthetic value, landfills, and industrial farms.
The locations of all these elements were integrated into the biophysical units, and their visibility was analysed to generate a map identifying locations from which positive elements (Main Map 1.C) and negative elements (Main Map 1.D) can be observed.
4.2. Landscape evaluation by biophysical units
Analysis for the first objective was conducted using the map of biophysical units of the MRCP at 1:50,000 scale produced by CitationFranch-Pardo et al. (2016), whose methodology is based on CitationPriego-Santander et al. (2010). This mapping method is hierarchical and holistic, beginning with extensive landscape units classified by (in descending order) topography, lithology, and climate. Each of these units is then divided by slope into separate biophysical units, which are then classified by vegetation, land use, and soil (CitationCampos Sánchez & Priego-Santander, 2011). We augmented the detail and re-scaled the map to 1:25,000 to be consistent with the other maps in this study.
4.2.1. Landscape quality
To apply landscape studies to land management, landscape quality is assessed by considering the merit or value of the visual components present (CitationTveit, Ode, & Fry, 2006). Landscapes within the study region are compared to establish relative rankings of higher or lower quality (CitationBoersema, 2009; CitationLaurie, 1975). This is done through indirect, quantitative methods that break down the landscape into its constituent elements based on predefined criteria (CitationPanagopoulos, 2009). These methodological approaches have been frequently utilized by experts on behalf of government agencies (CitationDaniel, 2001). In this study, quality was assessed as follows:
4.2.1.1. Intrinsic quality
The intrinsic quality is assessed using only the elements within each unit, and without considering external elements that could affect the scene. This involves the use of characteristics that are quantifiable and can render a landscape more or less attractive. This analysis is divided into three phases:
Assessment of landscapes by morphological and land-use criteria. Indirect methods were used to divide the territory into measurable components, and the evaluation criteria of CitationLinton (1968) were used with natural features proposed by CitationOtero, Casermeiro, Ezquerra, and Esparcia (2007) and CitationMartín Ramos & Otero Pastor (2012). Morphological evaluation was performed on the biophysical units identified by CitationFranch-Pardo et al. (2016), which incorporate topographical relief and vegetation. Both of these variables were weighted with a summed weight of 50%. Both these weightings and those appearing in the following sections are adapted to the characteristics of the study area, and reflect expert knowledge of the territory consistent with CitationPanagopoulos (2009)’ criterion.
These weightings are in line with those used in the reference work (CitationGovernment of Aragon, 2007–2013) which, in turn, relied on previous assessments carried out by specialized technical teams in fields such as environmental engineering and geography.
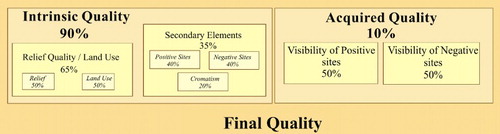
Incorporation of measurements of positive and negative elements in each landscape into the biophysical units designated above. This phase also entails the calculation of a chromatic value for each biophysical unit that represents the degree of colour variability within the unit, assuming that a landscape with a variety of colours is more attractive than a monochromatic one (CitationGovernment of Aragon, 2007–2013). Zonal Statistics tools were used in ArcGIS® to extract amplitude ranges and diversity (number of different values) from each biophysical unit. These variables were weighted with values established by the CitationGovernment of Aragon (2007–2013) as follows: positive elements 40%, negative elements 40%, and chromatic analysis 20%.
Integration of phases one and two. Intrinsic quality was assessed by weighting the analysis in phase one at 65% and phase two at 35%.
4.2.1.2. Acquired quality
This form of quality analysis considers the visual quality of each biophysical unit based on external elements and incorporating scenery visible from each part of the landscape, but external to the unit. Both negative and positive elements were weighted at 50% here.
We used the maps generated in Section 4.1.3 to calculate the incidence of negative and positive elements, and then Zonal Statistics tools to estimate the average vista for each biophysical unit. This allowed us to estimate what is visible for each unit and evaluate the quality of the average vista so that each unit could be assigned a value.
4.2.1.3. Final quality
The two previous quality assessments were integrated, with intrinsic quality weighted at 90% and acquired quality at 10% to reflect the fact that acquired quality is more a correction factor to intrinsic quality (see and Main Map, 2.A).
Figure 3. Relative weightings of factors used to assess visual quality of the landscape.
4.2.2. Fragility
Visual fragility refers to the responsiveness to land-use changes, or its ability to absorb such changes without significantly changing its appearance (CitationYeomans, 1979). This fragility is estimated based on the constituent elements and their general visibility (Section 4.1). Visual barriers such as dams and highways, thickness of the vegetation, and fragmentation of the topography all influence fragility. In this study, we undertook the following analyses:
4.2.2.1. Evaluation of the constituent elements
CitationFranch-Pardo et al.’s (2016) biophysical units once again served as the units of analysis. The process was similar to that of the intrinsic-visibility analysis, with values assigned to land-use and -cover classes and physical relief.
4.2.2.2. Evaluation of visibility aspect of fragility
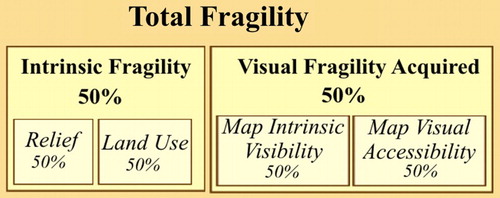
Because visibility is the determinant factor of fragility, more visible landscapes are more fragile (CitationBlanco, Gonzales, & Ramos, 1982). The maps of intrinsic visibility (Section 4.1.1) and accessibility (Section 4.1.2) were therefore combined, each weighted at 50%, to estimate the visibility aspect of fragility.
4.2.2.3. Final fragility
To determine the integrated fragility of each biophysical unit, results of the previous two phases were integrated, each weighted at 50% (see and Main Map, 2.B).
Figure 4. Relative weightings of factors used to assess visual fragility of the landscape.
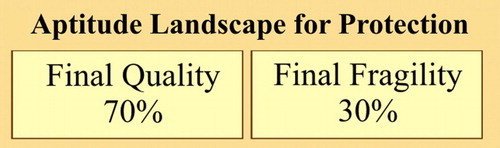
4.2.3. Aptitude for protection
The aptitude for protection of the landscape refers to its ability to host various human activities or uses while preserving its desired visual features. It is estimated by simply integrating the previous quality and fragility assessments with 70% and 30% weightings respectively (). Fragility was weighted less than quality to offset the polar concentration of inhabitants at the two ends of the study area (see Main Map, 2.C). A biophysical unit with both high quality and fragility values is visually appealing but also highly susceptible to degradation, thus suggesting that measures should be taken to preserve it, while a unit with high quality and low fragility may be equally appealing but more resilient to degradation. The values in all maps generated in this phase were grouped by standard deviation.
Figure 5. Relative weightings of factors used to assess aptitude of the landscape for protection.
4.3. Mapping of the MRCP by VLUs
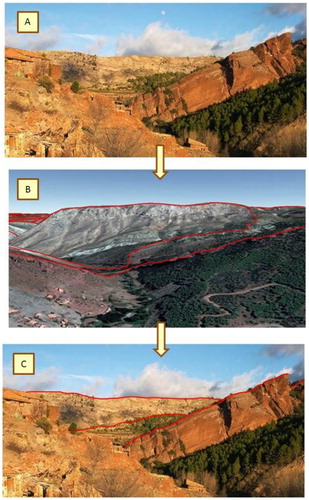
Delimitation of the MRCP by VLU is based on visual enclosure (CitationBlanco et al., 1982), with a VLU defined as an area visually interconnected within which a viewer can see most of the delineated unit, but not adjacent ones (CitationGovernment of Aragon, 2007–2013). In mountainous regions like the MRCP the topography is the primary determinant of the scenic horizon (i.e. the distance that can be observed), and is therefore the determinant factor in visual enclosure and the designation of VLUs ().
Figure 6. (a) A photograph taken from the vantage point of an observer in the field (at Peñarroyas, Montalbán), (b) a 3-D topographic model in GIS of the same landscape, and (c) the previous photograph with visual landscape units (VLUs) delimited.
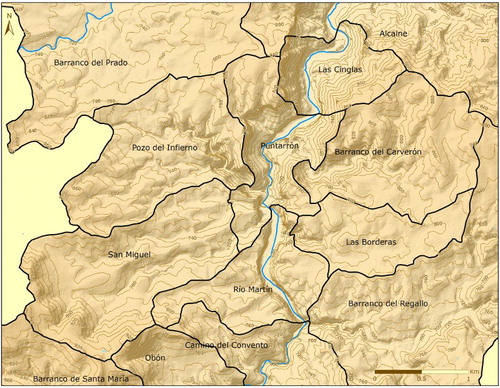
In this analysis, the mapping was performed in a GIS using contours, DEMs, and orthophotos to designate visual fields which were then verified and digitized in the laboratory ().
Figure 7. Selected visual landscape units (VLUs) overlaid on a contour map with 20-metre isolines and with hillshading from the DEM.
Due to the topographic characteristics of MRCP, delimitation by VLUs divides the territory into units with relatively homogeneous sizes that are useful at the 1: 25,000 scale of the study, making them more helpful in management and planning (CitationGovernment of Aragon, 2007–2013). On the other hand, smaller VLUs may express greater internal homogeneity than larger landscape units, and may therefore be more useful as land-management units. Because this study of the MRCP is at a local scale, we also decided that a higher resolution (greater than 1:50,000) of the biophysical units was needed to designate the VLUs with sufficient precision. Consequently, we divided the MRCP into 67 VLUs over 379.3 km2, with the average area of VLU being 5.6 km2.
The same landscape assessments conducted on biophysical units (Section 4.2) were used in the VLUs. This required the designation of content for the VLUs, which the CitationGovernment of Aragon (2007–2013) defines as ‘types of landscape.’ This phrase combines biophysical and anthropogenic variables that define the landscape, which are generally grouped into categories of topography, vegetation, and land-use (in the broadest sense).
The proposed integration of biophysical units and VLUs uses the former to provide the defining content of the latter. CitationFranch-Pardo et al. (2015, Citation2016) divided the landscape into biophysical units based on the methods of CitationPriego-Santander et al. (2010), and their quality (4.2.1; Main Map 3.A), fragility (4.2.2; Main Map 3.B) and aptitude for protection (4.2.3; Main Map 3.C) were assessed. This information derived from the biophysical units can be integrated into the VLUs, providing the same three scenic evaluations for each of the VLUs. This process was divided into two phases:
Phase 1: map the quality, fragility, and fitness of the biophysical units to each of the 67 VLUs, and
Phase 2: estimate the average evaluation of the aforementioned variables for each VLU.
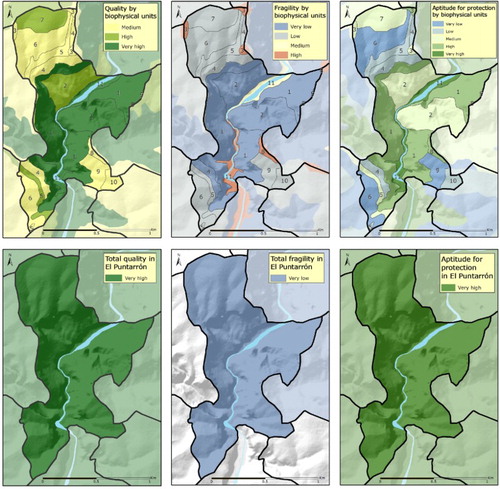
and illustrate the high level of detail in the maps and how the biophysical units and the VLUs are integrated for each of the three landscape evaluations with a model VLU, El Puntarrón (id. 34). As the different ranges of values in the quality (Main Map 2.A and 3.A) and fragility (Main Map 2.B and 2.C) maps illustrate, biophysical units provide a higher resolution representation of the landscape while VLUs break the landscape into units more appropriately scaled to land planning and management (CitationGovernment of Aragon, 2007–2013).
Figure 8. Map of biophisical landscape in the Visual landscape unit (VLU) El Puntarrón.
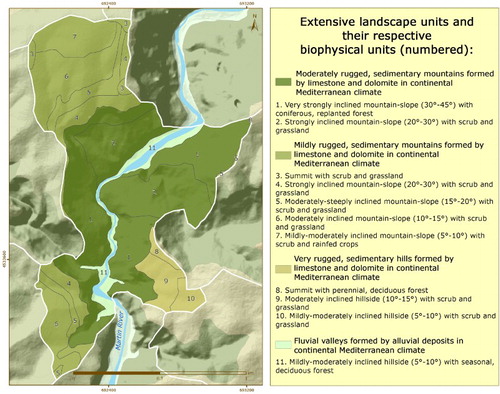
Figure 9. Visual evaluation of quality fragility, and aptitude for protection for El Puntarrón, a model visual landscape unit (VLU), by biophysical units (top row) and aggregated for the VLU (bottom row).
5. Conclusions
In keeping with our first objective, we conducted a visibility analysis of the MRCP that its status as an area of recognized cultural heritage and geomorphosites situated in a country adherent to the ELC requirements. This detailed analysis was designed to provide some of the information needed to facilitate land management, including the potential visual impacts of land change. This work satisfies an important legal and political requirement in this respect.
The visibility analysis served as the starting point to achieve the second objective by evaluating the quality, fragility, and aptitude for protection of the area’s biophysical units. This analysis is useful in two respects: (1) to planning because it can be used to identify which biophysical units are in greater need of protection and where such protection is more likely to be effective, and (2) because it provides a novel methodological basis for the analysis of visual aspects in CitationPriego-Santander et al.’s (2010) biophysical units.
The mapping of the MRCP by VLU to achieve the third objective is consistent with the methods used by the CitationGovernment of Aragon (2007–2013) in other places, and allowed us to integrate the biophysical aspects of the landscape into these VLUs. The use of the information obtained from analysis of the biophysical units permitted the evaluation of quality, fragility, and aptitude for protection of each VLU based on its biophysical characteristics. This consolidated approach satisfies the epistemological demands of the Complex Physical Geography school for biophysical information and the ELC’s pragmatic demands for operationally useful visual analyses in its member countries.
Software
All maps in this study were generated using Esri ArcGIS 10.3®.
VISIBILITY ANALYSIS AND LANDSCAPE EVALUATION IN MARTIN RIVER CULTURAL PARK (ARAGON, SPAIN) INTEGRATING BIOPHYSICAL AND VISUAL UNITS.pdf
Download PDF (45.7 MB)Acknowledgements
The authors thank Carlos Palomares Magaña (ENES-Morelia, UNAM) for his technical support in GIS and Nair Leana Morales (UMSNH) for help with field work.
Disclosure statement
No potential conflict of interest was reported by the authors.
ORCID
Iván Franch-Pardo http://orcid.org/0000-0003-4346-8757
Brian M. Napoletano http://orcid.org/0000-0003-1702-0959
Related Research Data
References
- Blanco, A., Gonzales, S., & Ramos, A. (1982). Visual landscape classification in the coastal strip of Santander (Spain). Coastal Zone Management Journal, 9(3–4), 271–297. doi:10.1080/08920758209361904
- BLI. (n.d.). River Martín Canyons and Arcos mountain range. En Important Bird and Biodiversity Areas (IBAs). Bird Life International. Retrieved from http://www.birdlife.org/datazone/sitefactsheet.php?id=1805
- Bocco-Verdinelli, G., Priego-Santander, A. G., & Cotler, H. (2010). The contribution of physical geography to environmental public policy development in Mexico. Singapore Journal of Tropical Geography, 31(2), 215–223. doi: 10.1111/j.1467-9493.2010.00395.x
- Boersema, J. (2009). Environmental sciences, sustainability and quality. In J. J. Boersema & L. Reijnders (Eds.), Principles of environmental sciences (pp. 3–14). Amsterdam: Springer.
- Campos Sánchez, M., & Priego-Santander, A. G. (2011). Biophysical landscapes of a coastal area of Michoacán state in Mexico. Journal of Maps, 7(1), 42–50. doi:10.4113/jom.2011.1098
- Council of Europe. (2000). European landscape convention. Florence, European Treaty Series, 176, 20.
- Daniel, T. C. (2001). Whither scenic beauty? Visual landscape quality assessment in the 21st century. Landscape and Urban Planning, 54(1), 267–281. doi:10.1016/S0169-2046(01)00141-4
- Déjeant-Pons, M. (2006). The European landscape convention. Landscape Research, 31(4), 363–384. doi:10.1080/01426390601004343
- Farina, A. (2009). Ecology, cognition and landscape: Linking natural and social systems. Springer. doi:10.1007/978-90-481-3138-9
- Fernández Martín, M. T., García Ezpeleta, F., Gil Azuara, R., Gordillo Azuara, J. C., Porcel i Caro, E., & Royo Lasarte, J. (2012). Guía de cavidades y arte rupestre del Parque Cultural del río Martín [Guide to cavities and cave art of the Martin river cultural park]. Centro de Estudios Espeleológicos Turolenses. Zaragoza: Prames.
- Fisher, P. F. (1995). An exploration of probable viewsheds in landscape planning. Environment and Planning B: Planning and Design, 22(5), 527–546. doi:10.1068/b220527
- Franch-Pardo, I., Espinoza-Maya, A., Cancer-Pomar, L., & Bollo-Manent, M. (2016). Mapa de paisajes físico-geográficos en el Parque Cultural del río Martín (Teruel, Aragón) escala 1: 50.000 [Map of physical-geographic landscapes in the Martin river cultural park (Teruel, Aragon) 1: 50.000 scale]. Revista Catalana de Geografía, 20(53). Retrieved from http://www.rcg.cat/articles.php?id=351
- Franch-Pardo, I., Priego-Santander, A., Bollo-Manent, M., Cancer-Pomar, L., & Bautista, F. (2015). Aplicación de los paisajes físico-geográficos en un sector de la cordillera ibérica: la cuenca del río Martín (Aragón, España) [Application of the physico-geographic landscapes in a sector of the Iberian mountain range: The Martin river basin (Aragon, Spain)]. Interciencia, 40(6), 381–389.
- Fry, G. L., Tveit, M. S., Ode, A., & Velarde, M. D. (2009). The ecology of visual landscapes: Exploring the conceptual common ground of visual and ecological landscape indicators. Ecological Indicators, 9(5), 933–947. doi:10.1016/j.ecolind.2008.11.008
- Gómez Zotano, J., & Riesco Chueca, P. (2010). Marco conceptual y metodológico para los paisajes españoles: Aplicación a tres escalas espaciales [Conceptual and methodological framework for Spanish landscapes: Application to three spatial scales]. Seville: Consejería de Obras Públicas y Vivienda, Centro de Estudios Paisaje y Territorio. p. 467.
- Government of Aragon. (2007–2013). Mapa de Paisaje de Aragón [Landscape maps of Aragon]. Zaragoza: Strategies Territorial Service, Directorate General of Planning. Retrieved from http://idearagon.aragon.es/paisaje.jsp
- IDEARAGON. (n.d.). Government of Aragon. Retrieved from http://idearagon.aragon.es
- Jones, M., & Stenseke, M. (2011). The issue of public participation in the European landscape convention. In M. Jones & M. Stenseke (Eds.), The European landscape convention: Challenges of participation (pp. 1–26). Dordrecht: Springer Science & Business Media.
- La Rosa, D. (2011). The observed landscape: Map of visible landscape values in the province of Enna (Italy). Journal of Maps, 7(1), 291–303. doi:10.4113/jom.2011.1183
- Laurie, I. C. (1975). Aesthetic factors in visual evaluation. In E. N. Zube, R.O. Brush, & J. G. Fabos (Eds.), Landscape assessment: Values, perceptions and resources (pp. 102–117). Stroudsburg: Dowden Hutchinson and Ross.
- Linton, D. L. (1968). The assessment of scenery as a natural resource. Scottish Geographical Magazine, 84(3), 219–238. doi:10.1080/00369226808736099
- Martín Ramos, B., & Otero Pastor, I. (2012). Mapping the visual landscape quality in Europe using physical attributes. Journal of Maps, 8(1), 56–61. doi:10.1080/17445647.2012.668763
- Naveh, Z., & Lieberman, A. S. (2013). Landscape ecology: Theory and application. Dordrecht: Springer Science & Business Media.
- Otero, I., Casermeiro, M. A., Ezquerra, A., & Esparcia, P. (2007). Landscape evaluation: Comparison of evaluation methods in a region of Spain. Journal of Environmental Management, 85(1), 204–214. doi:10.1016/j.jenvman.2006.09.018
- Panagopoulos, T. (2009). Linking forestry, sustainability and aesthetics. Ecological Economics, 68(10), 2485–2489. doi:10.1016/j.ecolecon.2009.05.006
- Priego-Santander, A. G., Bocco-Verdinelli, G., Mendoza-Cantú, M., & Garrido-Pérez, A. (2010). Propuesta para la generación semiautomatizada de paisajes. Fundamentos y métodos [Proposal for the semiautomated generation of landscapes. Fundamentals and methods]. México: Centro de Investigaciones en Geografía Ambiental, UNAM.
- Richling, A. (1983). Subject of study in complex physical geography (landscape geography). GeoJournal, 7(2), 185–187. doi:10.1007/BF00185166
- Riggs, P. D., & Dean, D. J. (2007). An investigation into the causes of errors and inconsistencies in predicted viewsheds. Transactions in GIS, 11(2), 175–196. doi:10.1111/j.1467-9671.2007.01040.x
- Sevenant, M., & Antrop, M. (2007). Settlement models, land use and visibility in rural landscapes: Two case studies in Greece. Landscape and Urban Planning, 80(4), 362–374. doi:10.1016/j.landurbplan.2006.09.004
- Stephenson, J. (2008). The cultural values model: An integrated approach to values in landscapes. Landscape and Urban Planning, 84(2), 127–139. doi:10.1016/j.landurbplan.2007.07.003
- Tress, B., Tress, G., Decamps, H., & d’Hauteserre, A. M. (2001). Bridging human and natural sciences in landscape research. Landscape and Urban Panning, 57, 137–141. doi:10.1016/S0169-2046(01)00199-2
- Tveit, M., Ode, Å, & Fry, G. (2006). Key concepts in a framework for analysing visual landscape character. Landscape Research, 31(3), 229–255. doi:10.1080/01426390600783269
- Wheatley, D. (1995). Cumulative viewshed analysis: A GIS-based method for investigating intervisibility, and its archaeological application. In G. Lock & Z. Stancic (Eds.), Archaeology and geographical information systems (pp. 171–186). London: Taylor and Francis.
- Yeomans, W. C. (1979). A proposed biophysical approach to visual absorption capability (VAC). National Conference on Applied Techniques for Analysis and Management of the Visual Resource, Incline Village, Nevada, April 23–25.