
ABSTRACT
The map shows the result of a procedure for pluvial flood hazard (PFH) mapping in urban areas, developed by using easy to find data, usually available from local authorities. Data were processed using a sequence of tools in a GIS environment. Two parameters have been evaluated: (1) susceptibility, defined as the probability of a flood occurring in a certain area (‘flood-prone areas’) which depends on the ground morphology (i.e. presence of depressions, fill volume of depressions) and spatial density of previously observed floods and (2) potential impact, formed from all factors influencing the damage (e.g. value of exposed heritage or number of people potentially involved), as well as the induced hazard due to damage. Susceptibility and potential impact were each divided into five classes and a score matrix was constructed; the final PFH is then defined by the summation of the scores within the matrix. The methodology used is suitable for a comprehensive, mostly automatic, first-level analysis of PFH in urban areas, and it is easily replicable. The obtained flood hazard map could provide a useful tool for civil protection purposes, that is, for hazard evaluation and emergency planning.
1. Introduction
Floods are one of the most common and widely distributed natural hazards affecting life and property. Urban growth, generally, causes hydraulic hazard, due to the sealing of natural surfaces and the underground channelling of the natural drainage network into pipes, thus strongly increasing surface water runoff and leading to deterioration of the water quality. Furthermore, climatic change exacerbates these aspects because of the increase in the number and frequency of extreme rainfall events (‘pluvial flooding’), which often lead to overwhelming of the sewer network, which is unable to drain excess water (CitationBates, Hope, Ryan, Smith, & Charles, 2008). As urban areas are particularly vulnerable to natural hazards, due to the high concentration of population, buildings, economic activities, distribution networks and cultural heritage, the mitigation of urban flooding caused by extreme rainfall is one of the main challenges of urban drainage management.
Pluvial flooding is influenced by many local factors, for example, sewer and manhole maintenance, type and extent of impervious surfaces over the basin, presence of underground structures. While well-established and tested procedures exist for river flood hazard assessment (e.g. CitationDawson et al., 2008; CitationMorita, 2008), techniques for the study and the management of flood hazard caused by extreme rainfall is generally poorly considered (CitationNiemann & Illgen, 2011; CitationZhou, Mikkelsen, Halsnaes, & Arnbjerg-Nielsen, 2012).
A common approach to flood hazard mapping is to use hydrologic numerical models which simulate the water height over the urban surface as a function of many variables. However, developing hydrologic models in large urban areas requires in-depth knowledge of the urban drainage system at a correct scale, as well as a detailed and hydrologically correct surface terrain model.
In recent years, the improvement of geographic information systems (GIS) and the availability of remote sensing data at higher resolutions have allowed us to consider integrated models for complex management schemes, including urban drainage systems. CitationQi and Altinakar (2011) developed a GIS-based decision support system for two-dimensional integrated flood simulations, thus significantly improving the accuracy of flood hazard assessment. Indeed, each kind of data can be represented through its spatially distributed values, allowing many variables to be included in the calculations, and making it easy to perform detailed hazard evaluation at a large scale (CitationDjordjevic, Prodanovic, & Maksimovic, 1999, CitationDjordjevic, Prodanovi, Maksimovic, Ivetic & Savić, 2005; CitationObermayer et al., 2010). These include building high-resolution digital terrain models (DTMs) integrating river bathymetry and the surrounding morphology (CitationMerwade, Cook, & Coonrod, 2008), or developing hazard zoning by applying multicriteria decision analysis (CitationFernández & Lutz, 2010).
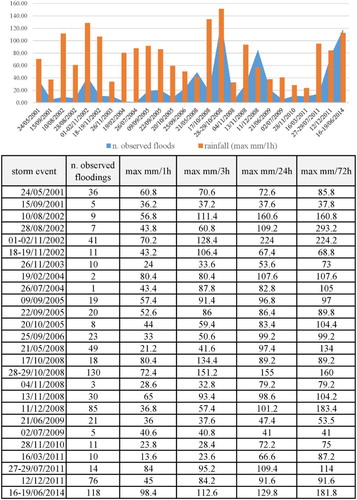
Over the last 15 years, the city of Rome has been struck by at least 26 storm events that caused huge damage, blocking traffic circulation and in some cases leading to the loss of human life (; CitationDi Salvo et al., 2016). The pluvial flood hazard (PFH) map presented in this paper is the result of an easily replicable procedure applied to the city of Rome; it was developed using easy to source data, available from local administration offices, which were produced through a sequence of tools in a GIS environment. The map can serve as a tool for civil protection purposes, for rapid management of emergency phases and for planning hazard mitigation actions.
Figure 1. List of storm events with documented floods that occurred between 2001 and 2014 in the city of Rome. The maximum rainfall intensity in 1, 3, 24 and 72 hours is reported. The number of observed floods considerably rose from 2008, independently of the storm intensity, due to the increased availability of data, mainly acquired from web media.
2. Methods
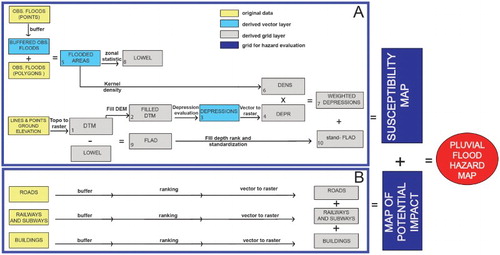
The PFH map was developed by means of a susceptibility analysis and impact assessment. The final PFH is defined by a score matrix, as the sum of the susceptibility and potential impact score classes ().
Figure 2. Flowchart describing the susceptibility analysis and impact assessment used for the hazard map development.
Collected data include the following layers:
observed floods vector layer with polygon geometry: 30 floods occurring between 2004 and 2007 were recorded and published by the Civil Protection of Rome municipality (CitationComune di Roma, Ufficio Extradipartimentale della Protezione Civile, 2008);
observed floods with point geometry: 750 floods occurring between 2001 and 2011, derived from the Fire Department, Municipal Police and Civil Protection of Rome municipality, web media;
ground elevation lines and points from 1:5000 map;
strategic river flood prediction map of Tiber River Basin Authority (CitationAutorità di Bacino del Fiume Tevere, 2006, Citation2016);
vector layer of buildings, including location and type of use, with polygon geometry. These layers were provided by Regione Lazio and then updated using data from the Civil Protection of Rome municipality;
railway and subway networks with line geometry (National Geoportal, Citation2010a);
main and secondary roads, with line geometry (National Geoportal, Citation2010b).
2.1. Susceptibility analysis
Susceptibility is defined as the probability of a flood occurring in a certain area without considering time, caused by two main factors: the ground morphology (i.e. presence of depressions and embankment of depressions) and the spatial density of previously observed floods.
The susceptibility analysis consists of the following phases ():
DTM construction and pre-processing;
morphological depressions construction;
mapping historic flood occurrences;
ranking of depressions by fill volume;
weighting of the depressions by flood density;
ranking of the flooded areas by fill depth and standardization;
combining both grids of fill depth and weighted depressions to obtain the susceptibility map of pluvial ‘flood-prone areas’ (FPA).
Excess storm water flows and accumulates in the lowest elevation areas of a catchment (mainly floodplains and valleys), which are for this reason particularly susceptible to flooding. However, floods can also be related to insufficient sewer capacity or poor manhole maintenance; in these cases, floods can also affect areas that do not coincide with morphological lows. In this work, it is assumed that an FPA can belong to (1) morphological depressions and/or (2) areas with previously observed floods. The accuracy and reliability of the DTM is a driving factor for a reliable depression evaluation. As recommended by CitationKarel, Pfeifer, and Briese (2006) and CitationKraus (1994), a correct DTM building process should consider:
ground elevation data density,
the accuracy of ground elevation measurements,
the suitability of the interpolation method for the relief and slope of the study area.
Scarce and/or inhomogeneous data density, as well as smoothing interpolation functions, can be responsible for missing some depressions. A depression is defined as an area having a lower elevation than the surrounding cells. A smoothed (or poorly defined) DTM could also smooth the differences in elevation, preventing the correct identification of depressions.
The ANUDEM algorithm (CitationHutchinson & Dowling, 1991, ANU Fenner School of Environment and Society and Geoscience Australia, Citation2008), which produces a hydrologically corrected DTM, was chosen to build a high-resolution DTM (2 × 2 m), using both contour lines and ground elevation points from 1:5000 cartography (, step 1). The fill DTM tool was used to fill small DTM sinks (small DTM errors) (, step 2).
DTM depressions were then detected by an automated depression evaluation tool in a GIS environment (, step 3); polygons representing depressions with an area <30 m2 and fill volume <1 m3 were considered to be interpolation errors and thus removed.
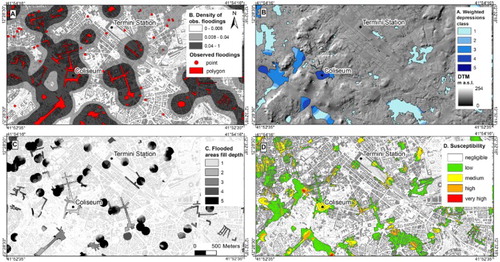
The recognized polygonal depressions were ranked on the basis of their fill volume and converted to a grid (DEPR grid, , step 4). In order to overcome the underestimation of susceptible areas in the case of observed floods with point geometry, the buffer tool was used to create a 100 m circle area around each of these points. By merging flood polygons and buffered flood points, the vector layer of flooded areas was obtained (, step 5). The kernel density algorithm (CitationSilverman, 1986) was used to build the DENS grid, which represents the number of flooded cells per square kilometre (, step 6; (A)). The kernel density is a smoothing non-parametric technique used for estimating the probability density function of floods, visualizing the underlying distribution of a continuous variable. In the specific case, it was used in order to represent a discontinuous variable (point and polygon observed floods), by obtaining a continuous variable representing the spatial data structure of the distribution of observed floods. The DENS layer was multiplied by the DEPR layer in order to weight the depressions (, step 7); then, the resulting layer was classified according to the quantile distribution in order to obtain a five-class layer (WEIGHTED DEPRESSIONS; (B)). The higher the class number, the higher the flood potential.
Figure 3. Examples of grid and vector layers produced for the flood hazard mapping. (a) density of observed floods (DENS grid); (b) FILLED DTM and weighted depressions (WEIGHTED DEPRESSION grid); (c) Standardized fill depth of flooded areas (stand-FLAD grid) and (d) Resulting map of susceptibility to pluvial flood. Geographic coordinates refer to the WGS84 geodetic system.
Among the factors that affect flood susceptibility, the height of water filling the volume of an FPA (i.e. flood depth) should be considered. Indeed, the main threat to personal safety and of gross structural damage caused by floods depends largely upon the flood depth. The flood depth, in turn, is affected by the magnitude of the flood and by the morphological characteristics of the depression. The greater the depth of the depression, the greater the potential danger to people, vehicles and goods (CitationFEMA, 2014).
In common hydraulic models, the flood depth is calculated by subtracting the ground elevation from the water surface elevation for a specific return period of the flood scenario ((A)). Flood scenarios for stated return periods allow the definition of both the maximum expected flood depth and the areal extent of the flood, which is a function of the flood magnitude and topography (CitationFEMA, 2014). In this work, instead of accounting for the modelled flood depth of each return period, a potential fill depth is defined, corresponding to the elevation of each cell of an FPA with respect to its lowest point ((B)). Therefore, the potential fill depth is calculated for each cell as the difference between the ground elevation (DTM) and the lowest elevation within each FPA (LOWEL grid, step 8). The higher the fill depth (FLAD grid, step 9), the lower the degree of susceptibility. In fact, in an FPA, higher fill depths (i.e. water levels) are linked to heavy rainfall with longer return periods; otherwise, lower fill depths are linked to heavy rainfall characterized by shorter return periods.
Figure 4. Potential fill depth of a FPA. (a) In common hydraulic models, the flood depth values are computed by subtracting the ground elevation from the water surface elevation for each return period or computed flood scenario. (b) In this work, the potential fill depth of a prone area is calculated instead of flood depth; fill depth is defined as the difference between the ground elevation (DTM) and the lowest elevation of the FPA.
The zonal statistic tool was used to extract the lowest elevation value within each polygonal observed flood, and to build the LOWEL grid. Finally, the FLAD grid was standardized to the maximum value to obtain a new grid ranging between 0 and 1 (stand-FLAD grid), where higher values correspond to higher susceptibility. The stand-FLAD grid was then classified into five classes (, step 10; (C)). Note that in the detected depressions the fill depth values range between 0 and 0.12 metres; therefore, variability of the depressions’ fill depth is considered negligible and is not included in the FLAD grid.
The map of susceptibility to pluvial flooding ((D)) comprises five classes: negligible, low, medium, high and very high. Areas belonging to the ‘very high’ susceptibility class are those with a low fill depth, or high density of observed floods and small fill volume. The areas of river flood hazard defined in the Tiber River Basin Masterplan (Autorità di Bacino del Fiume Tevere, Citation2016) were hatched and included in the pluvial flood susceptibility map and highlight areas with combined fluvial and pluvial hazard type.
2.2. Potential impact assessment
According to the European Guidance for Reporting under the Floods Directive (CitationEuropean Commission, 2007/60), the potential impact of pluvial flooding has been evaluated by considering the possible consequences of damage to human health, the environment, cultural heritage and economic activities (; (B) and ).
Figure 5. Map of the potential impact. The layers representing impact are clipped by areas susceptible to flood.
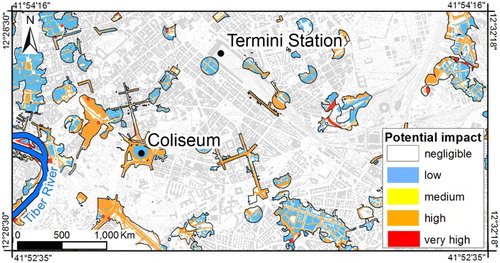
Table 1. Potential impact ranking.
In the impact assessment, the factors which can potentially influence the damage are examined (e.g. the value of the exposed heritage or number of people potentially involved), as well as the hazard induced because of damage. All the exposed objects considered (i.e. schools, hospitals, main roads, etc.) were ranked, proportionally to their potential impact, in five classes (from 1 to 5, ). Following these considerations, schools, hospitals, public offices, underpasses, main roads and railway lines fall within the ‘very high’ impact class (score 5) due to the high induced hazard and potential damage (interruption of access ways from and to flooded areas; potentially high concentration of people; interruption of services and organizational dysfunction). A ‘high’ potential impact (score 4) is assigned to landfills, industrial and wastewater treatment plants, where excess water can potentially mobilize toxic substances and pollutants. The same score is assigned to cultural and archeological heritage, due to its inestimable value. A ‘medium’ impact (score 3) was assigned to infrastructure assumed to be less vulnerable than score 5 and 4 classes (e.g. airports and subway buildings). A ‘low’ impact (score 2) was assigned to green areas (e.g. public gardens, parks and farming fields), because of the limited and highly variable number of people and/or goods potentially exposed to flooding. Finally, score 1 indicates a ‘negligible’ impact due to the absence of existing infrastructure, buildings or heritage.
2.3. PFH map
The final PFH map (see the Main Map) was evaluated by the sum of grid layers representing susceptibility and potential impact. These two elements were combined in hazard levels according to a defined matrix (see CitationLeitao, Almeida, Simoes, & Martins, 2012; CitationNiemann & Illgen, 2011). The hazard matrix is defined by the sum of the five susceptibility classes and the five potential impact classes. Ten classes of hazard result from the algebraic sum.
3. Results and discussion
3.1. Susceptibility map
The overlap between the susceptibility map and the natural stream network (which is partially obscured by urbanization) shows that areas prone to flood mostly coincide with main or secondary drainage lines, or with the confluence point of two drainage lines. Furthermore, many of the susceptible areas do not fall into ground depressions, but are in areas at higher elevation than the surroundings (e.g. the Termini central station). This suggests the poor efficiency of the urban drainage network, and the need for structural intervention to improve the drainage system. The observation of past floods is fundamental to recognize these areas as susceptible, and to include them on the map.
3.2. Potential impact map
The potential impact in the areas susceptible to flood is mainly represented by:
railways and roads running along the channelized valleys of tributary streams;
cultural and archaeological heritage in the historical centre (Municipal district I), especially in the floodplains of the Tiber River and its closer tributaries (today channelized);
wastewater treatment plants, sports facilities and industrial plants in the Tiber and Aniene Rivers floodplains, outside the historical centre.
On the hazard map, the highest hazard class (score 10) occurs in areas where a potential highly impacted element (e.g. an underpass) occurs within depressions characterized by a high density of observed floods or by a low fill depth area.
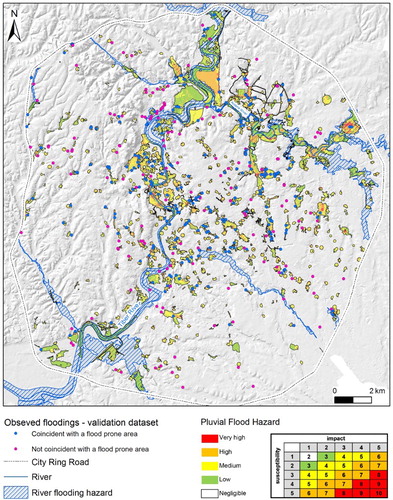
The hazard map has been validated using a dataset of 50 floods observed between 2014 and 2015 (); the results show that the majority of observed floods in the validation dataset (86%) coincide with an FPA. Among them, 57% occur within a depression (which can coincide or not with observed floods) in areas classified as high or medium hazard, while 29% occur in an area not morphologically depressed, but where floods have been observed. These results suggest that:
both a topographic analysis by DTM processing and an observed floods dataset collection are required to correctly detect all areas prone to flood;
the longer the time series of flood observations, the higher the number of identified FPA;
as most validated floods occur within a depression, the accuracy and reliability of the DTM is a driving element for a correct depression evaluation;
the potential impact map should be regularly updated, to include land use change as well as the development of new infrastructure, avoiding obsolete impact mapping.
4. Conclusions
The described procedure provides a fast GIS-based methodology for flood hazard analysis mapping in urban areas. The procedure is developed by using easy to find data, usually available in local administration offices, and it is suitable for a comprehensive, largely automatic and easily replicable first-level analysis of PFH in urban areas.
The map gives a clear picture of the distribution of flood hazard, providing information at a relevant spatial resolution, such as the municipal level; it supports the development of a comprehensive approach to hazard management and urban water management by the recognition of potential PFH in the urban area. The final flood hazard map could represent a tool for civil protection purposes, useful for hazard evaluation and emergency planning. It could be a reference for fast detection of areas that should be primarily monitored during intense storm events. Furthermore, it represents a useful tool for local authorities to detect areas where the development of improved water management plans, as well as structural measures for hazard mitigation, are needed.
Figure 6. Results of hazard map validation.
Software
Data concerning observed floods were collected and stored in a dedicated geodatabase, ‘AUDB’ (‘Database degli Allagamenti Urbani’), which was built using PostgreSQL with PostGIS spatial extensions. The database was managed using QGIS. Esri ArcGIS 10.2 was used for data analysis and map production. The ArcGIS extension, Arc Hydro, was used for the analysis of depressions (CitationDoctor & Young, 2013).
Pluvial Flood hazard in the city of Rome (Italy).pdf
Download PDF (173.4 MB)Acknowledgments
This study represents an independent research following the preliminary analysis lead in the framework of the Urban GEORISK Project, ‘Supporto tecnico e indirizzi operativi ai fini della valutazione di pericolosità geologiche nelle aree urbane per la pianificazione di interventi di protezione civile’ (2014), financially supported by DPC, the Italian Civil Protection Department (CNR-IGAG project manager: G.P.Cavinato; DPC referents: P. Pagliara, A. Corazza, F. Leone). Authors would like to thank DPC referents and Gianluca Ferri (Ufficio Extradipartimentale di Protezione Civile di Roma Capitale) for supporting this phase of preliminary analyses.
Disclosure statement
No potential conflict of interest was reported by the author.
Related Research Data
References
- ANU Fenner School of Environment and Society and Geoscience Australia. (2008). GEODATA 9 Second DEM and D8 digital elevation model and flow direction grid, user guide. Geoscience Australia, 43 pp. Retrieved from http://www.ga.gov.au/image_cache/GA11644.pdf
- Autorità di Bacino del Fiume Tevere. (2006). Piano Stralcio di Assetto Idrogeologico. Approvato con DPCM del 10 novembre 2006.
- Autorità di Bacino del Fiume Tevere. (2016). Piano di Gestione del Rischio Alluvioni. del Distretto Idrografico dell’Appennino Centrale, redatto ai sensi della Direttiva Europea 2007/60/CE e D. Lgsl 49/2010, approvato 3 marzo. Retrieved from http://www.abtevere.it/node/920
- Bates, B. C., Hope, P., Ryan, B., Smith, I., & Charles, S. (2008). Key findings from the Indian ocean climate initiative and their impact on policy development in Australia. Climatic Change, 89, 339–354. doi: 10.1007/s10584-007-9390-9
- Comune di Roma, Ufficio Extradipartimentale della Protezione Civile. (2008). Piano Generale di emergenza di Protezione Civile – Scenari di rischio predefiniti e Procedure per l’attivazione e l’intervento dell’Ufficio Extradipartimentale della Protezione Civile e delle strutture operative Comunali e di Supporto. Deliberazione G.C.S. n. 19 del 4 aprile 2008. Applicazione Deliberazione G.C. 1099/99 e OPCM 3606 del 28/08/2007.
- Dawson, R. J., Speight, L., Hall, J. W., Djordjevic, S., Savic, D., & Leandro, J. (2008). Attribution of flood hazard in urban areas. Journal of Hydroinformatics, 10(4), 275–288. doi: 10.2166/hydro.2008.054
- Di Salvo, C., Ciotoli, G., Cavinato, G. P., Pennica, F., Leone, F., Corazza, A., & Ferri, G. (2016). GIS-based methodology for pluvial flood hazard analysis: a case study in the urban area of Rome: Resilience of art cities to flooding. Success and failure of the Italian Experience, Poster contributions. «Atti dei Convegni Lincei» 305, Bardi Edizioni, Roma. ISBN: 978-88-218-1138-8, ISSN: 0391-805X.
- Djordjevic, S., Prodanovic, D., & Maksimovic, C. (1999). An approach to simulation of dual drainage. Water Science and Technology, 39(9), 95–103. doi: 10.1016/S0273-1223(99)00221-8
- Djordjevic, S., Prodanovi, D., Maksimovic, C., Ivetic, M., & Savić, D. (2005). SIPSON – simulation of interaction between pipe flow and surface overland flow in networks. Water Science & Technology, 52(5), 275–283.
- Doctor, D., & Young, A. (2013). An evaluation of automated GIS tools for delineating karst sinkholes and closed depressions from 1-meter LIDAR-derived digital elevation data. Sinkholes and the engineering and environmental impacts of karst: Proceedings of the Thirteenth Multidisciplinary Conference, 6th–10th May, Carlsbard, New Mexico.
- European Commission. (2007/60 , October 23). Directive of European parliament and of the council on the assessment and management of flood hazards. Official Journal of the European UnionL288/2711/6/2007. Retrieved from http://eurlex.europa.eu/LexUriServ/LexUriServ.do?uri=OJ:L:2007:288:0027:0034:EN:PDF
- Federal Emergency Management Agency (FEMA). (2014). Guidance for flood hazard analysis and mapping. Washington, DC: U.S. Department of Homeland Security.
- Fernández, D. S., & Lutz, M. A. (2010). Urban flood hazard zoning in Tucumàn Province, Argentina, using GIS and multicriteria decision analysis. Engineering Geology, 111(1–4), 90–98. doi: 10.1016/j.enggeo.2009.12.006
- Hutchinson, M. F., & Dowling, T. I. (1991). A continental hydrological assessment of a new grid-based digital elevation model of Australia. Hydrological Processes, 5, 45–58. doi: 10.1002/hyp.3360050105
- Jaehnig K. C. (2005 , April 7). Study: St. Louis is the epicenter of flood plain encroachments. Southern Illinois University Carbondale News, p. 1.
- Karel, W., Pfeifer, N., & Briese, C. (2006 , July 12–14). DTM quality assessment. ISPRS Technical Commission II Symposioum, Vienna.
- Kraus, K. (1994). Visualization of the quality of surfaces and their derivatives. Photogrammetric Engineering & Remote Sensing, 60, 457–462.
- Leitao, J., Almeida, M. C., Simoes, N. E., & Martins, A. (2012). Methodology for qualitative urban flooding hazard assessment. Proceedings of the 9th international conference on urban drainage modelling, Belgrade, 20.
- Merwade, V., Cook, A., & Coonrod, J. (2008). GIS techniques for creating river terrain models for hydrodynamic modeling and flood inundation mapping. Environmental Modelling and Software, 23, 1300–1311. doi: 10.1016/j.envsoft.2008.03.005
- Morita, M., (2008). Flood hazard analysis for determining optimal flood protection levels in urban river management. Journal of Flood hazard Management, 1(3), 142–149. doi: 10.1111/j.1753-318X.2008.00016.x
- National Geoportal. (2010a). Geoportale Nazionale – Ministero dell'Ambiente e della Tutela del Territorio e del Mare. Retrieved September 1, 2016, from http://wms.pcn.minambiente.it/cgi-bin/mapserv.exe?map=/ms_ogc/wfs/Rete_ferroviaria.map
- National Geoportal. (2010b). Geoportale Nazionale - Ministero dell'Ambiente e della Tutela del Territorio e del Mare. Retrieved September 1, 2016, from http://wms.pcn.minambiente.it/cgi-bin/mapserv.exe?map=/ms_ogc/wfs/Rete_stradale.map
- Niemann, A., & Illgen, M. (2011). Urbane Überflutungsvorsorge – Was die Siedlungsentwässerung vom gewässerseitigen Hochwasserschutz lernen kann. Proceedings 10. DWA Regenwassertage, Frankfurt.
- Obermayer, A., Günthert, F. W., Angermair, G., Tandler, R., Braunschmidt, S., & Milojevic, N., (2010). Different approaches for modelling of sewer caused urban flooding. Water Science and Technology, 62(9), 2175–2182. doi: 10.2166/wst.2010.439
- Oyatayo, K. T., Uwazuruonye, J., Ndabula, C., Abaje, I. B., Tata, H., Jidauna, G., … Shaba, H. A. (2013). An assessment of buildup expansion on an urban floodplain: For sustainable growth and development of Gwagwalada F.C.T. Nigeria. Journal of Environmental Sciences and Policy Evaluation, 3(2), 22–30.
- Qi, H., & Altinakar, M. S. (2011). A GIS-based decision support system for integrated flood management under uncertainty with two dimensional numerical simulations. Environmental Modelling and Software, 26, 817–821. doi: 10.1016/j.envsoft.2010.11.006
- Silverman, B. W. (1986). Density estimation for statistics and data analysis. New York, NY: Chapman and Hall.
- Zhou, Q., Mikkelsen, P. S., Halsnaes, K., & Arnbjerg-Nielsen, K., (2012). Framework for economic pluvial flood hazard assessment considering climate change effects and adaptation benefits. Journal of Hydrology, 414, 539–549. doi: 10.1016/j.jhydrol.2011.11.031