
ABSTRACT
Geotechnical mapping of urban environments is usually constrained by the scarcity of outcrops during fieldwork. Such is the case of Avilés, a coastal Spanish city that has been heavily industrialized since the middle of the last century. This research approaches the study of its urban subsoil through the development of a Geographical Information Systems-based relational database containing thousands of unpublished ground data, partially extracted from geotechnical reports. This allowed analysing the distribution and changes of thickness of the superficial deposits and lithostratigraphic formations as well as the evaluation of their main geotechnical properties. Thus, 14 geotechnical units were differentiated (hierarchically displayed in three categories) depending on lithological, geotechnical and constructive criteria. As a result, this investigation provides a geo-engineering map at scale 1:25,000.
1. Introduction
Geotechnical mapping of urban environments is challenging, mainly due to the scarcity of outcrops. Nowadays, digital databases implemented into Geographical Information Systems (GIS) have become a fundamental tool in the procedure of preparation of geo-engineering maps. Recent engineering geological maps at urban environments are based on ground databases, which are generally manipulated using GIS software (CitationChaminé et al., 2016; CitationCulshaw & Northmore, 2015; CitationEl May, Dlala, & Chenini, 2010; CitationFaccini, Robbiano, Roccati, & Angelini, 2012; CitationForster, Lawrence, Highley, Cheney, & Arrick, 2004; CitationMasoud, 2016; CitationMerritt & Whitbread, 2007; CitationOliveira, Gomes, & Guimarães, 2009; CitationZuquette, Pejon, & Dos Santos Collares, 2004), and therefore, this methodology seems to be fully consolidated to approach these environments subsoil studies.
The first geotechnical map of Avilés was published within the National Geotechnical Maps at 1:200,000 scale (CitationJulivert, Truyols, Marcos, & Arboleya, 1972) which included a brief geotechnical synthesis. This institution of research made some more detailed geo-engineering maps of Spanish cities (1:25,000) in the 1980s, though Avilés was not included. Moreover, other studies about specific geotechnical aspects have been subsequently published such as the characterization of residual soils (CitationDíaz-Díaz, Arias, López-Fernández, & Pando, 2014; CitationDíaz-Díaz, Omer, & Arias, 2016; CitationTorres Alonso & Gutiérrez Claverol, 2006).
In this study, a new geo-engineering map about the city of Avilés and its surroundings is presented. The article also explains the development of the GIS-type geotechnical repository designed for Avilés. This database made possible to prepare first a background geological map; the geotechnical map was made afterwards identifying the different geotechnical units.
1.1. Avilés and surrounding areas
This research involves one of the urban areas with major industrial relevance and more developed port activities in northwestern Spain: the city of Avilés and its surroundings. The mapped zone is situated at the north coast of Asturias and covers about 78 km2. More accurately, it is located at 5°59′12″-5°49′16″W and 43°30′40″-43°35′00″N, including the complete municipality of Avilés but also part of four others: Carreño, Castrillón, Corvera and Gozón (). In terms of population, this area had more than 150,000 inhabitants in 2016 (data source: Spanish National Statistics Institute).
Figure 1. At the top: geographical setting and digital elevation model of the studied area; the names of the municipalities are in capital letters. At the bottom: simplified geological map of the Avilés area.
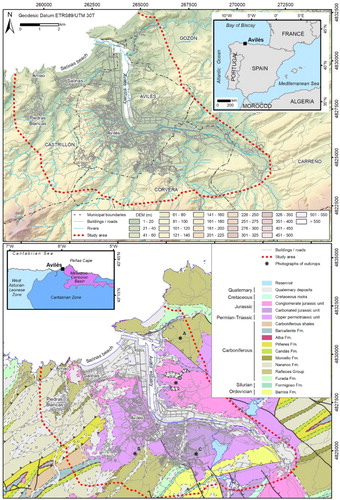
From the geomorphological viewpoint, Avilés and its surroundings are strongly linked to flat landforms that increase in height from the coastline reaching up to 200 m to the south (CitationLópez-Peláez & Flor, 2008; CitationPeón, 1992). They correspond to old wave-cut platforms or planar erosion surfaces (). Furthermore, the relief of the studied area is largely influenced by the Avilés estuary on whose left bank is located the largest population settlement.
The Avilés estuary forms a small catchment basin with N–S trend. Several shorts streams which trend E–W discharge into the estuary. The southern part of the mapped area corresponds to a more mountainous terrain with heights over 600 m.
The coastal zone of the study area is a significant natural heritage and is protected under different national and international legal forms. Examples of these are Special Areas for Birds Protection, Sites of Community Importance and Regional Protected landscapes.
Moreover, the most significant geological heritage in Avilés and surroundings is the oldest coal mining of Spain located in Arnao (). In this site, there is one of the best-preserved Devonian reef in the world (CitationArbizu & Méndez-Bedia, 2006).
1.2. Geological setting
The study area is located at the NW boundary of a Mesozoic-Cenozoic basin (). The underlying basement is formed by Palaeozoic rocks of the Cantabrian Zone, which corresponds to an external sector of the Iberian Massif (CitationAlonso, Marcos, & Suárez, 2009; CitationJulivert, 1967; CitationLotze, 1945).
The older rocks cropping out in the study area are the Barrios Quartzite Formation, Lower Ordovician in age. It is overlain by the Formigoso Formation (Middle-Upper Silurian age), made up of 150 m of shales and siltstones. These levels are overlain by 250 m of Lower Devonian red sandstones, corresponding to Furada Formation. Above this, a thick (>700 m) sequence of shales, limestones and dolomites represent the Rañeces Group, followed by 300 m of limestones (Moniello Formation), 400 m of sandstones (Naranco Formation), and up to 50 m of limestones and sandstones (Candás and Piñeres Formations) from de Lower-Upper Devonian. Carboniferous rocks crop out in the western area and are represented by 30 m of limestones (Alba Formation) and >200 m of limestones and shales (Barcaliente Formation). They are overlain unconformably by Pennsylvanian materials, represented by shales, sandstones, conglomerates and coal beds.
The Palaeozoic basement is overlaid by the Mesozoic bedrock () which can be divided into four major lithological units. The stratigraphic succession of the Mesozoic initiates with the Lower Permo-Triassic Unit, represented by 100 m of strongly cemented polygenic conglomerates with mainly siliceous red rounded pebbles. Red quarzitic sandstones and clays interbedded cover the top part of this unit. Above this, 500 m of red clays and siltstones with locally greenish and greyish hues that alternate with marls represent the Upper Permo-Triassic Unit. At the bottom, a level of medium-grain red or white sandstones has been recovered. This unit finishes with greyish and whitish gypsiferous materials. The gypsum is tentatively dated as Upper Triassic (CitationMartínez García, Coquel, Gutierrez Claverol, & Quiroga, 1998).
The Carbonate Jurassic Unit overlies the Permo-Triassic materials, with a maximum thickness of 120 m being Lower Jurassic in age (CitationMenéndez Casares, González Fernández, Gutiérrez Claverol, & García-Ramos, 2004). In this area, it is composed by dolomitic limestones and red clays at the bottom, on which limestones and dolomites with whitish and yellowish colours are overlaid; grey marls with dolomites and limestones interbedded cover the upper part of the Jurassic Carbonate Unit. A gently dipping unconformity bounds these levels at the top. Over this erosional truncation, a coarse-grain quartz conglomerates level called in this study Jurassic Conglomerate Unit, has been identified (Upper Jurassic in age). In some places, sandstones interbedded were recognized.
The study area is covered by Quaternary deposits: alluvial, estuarine and anthropic materials. They show large variations in thickness, various and complicated facies changes and vertically alternating soft and hard soil layers.
The current structure of the study area is the result of two orogenic episodes: the Variscan Orogeny, developed during the Carboniferous, and the Cenozoic Alpine Orogeny. The rocks deformed during the Variscan Orogeny are repeated by vertical folds and thrusts of SW-NE trending (). Moreover, both Palaeozoic basement and Mesozoic Succession are affected by the Alpine cycle (CitationAlonso, Pulgar, García-Ramos, & Barba, 1996; CitationTavani, Carola, Granado, Quintà, & Muñoz, 2013). Permo-triass and Jurassic strata lie subhorizontal with a bedding dipping 5°–20° and forming open folds.
2. Methods
The methodology followed in this research is summarized in . At an early stage the collection and review of all previous publications and geological maps about the study area were achieved. Hundred and four geotechnical reports performed in the urban subsoil in recent decades (building and civil engineering works) were analysed in detail. All this allowed extracting, after performing quality controls to avoid inconsistencies, abundant unpublished geological and geotechnical data: site investigations (boreholes, penetrometers), on-site and laboratory tests carried out on samples of rocks, soil and groundwater (). In order to ensure the quality of the test results, only those performed under Spanish technical specifications (UNE Standards) were taken into account. During a second phase, intensive fieldwork was necessary. This involved lithological and geomechanical description of rock masses and Quaternary sediments, and observations were also made in excavation works. In addition, the overall International Society for Rock Mechanics (ISRM) recommendations related to the field and laboratory procedures (CitationISRM, 1981, Citation2007, Citation2015) were generally followed as well as the engineering geology mapping guides proposed by CitationDearman (1991), CitationGriffiths (2002) and CitationIAEG (1976).
Figure 2. Methodology framework followed in this work.
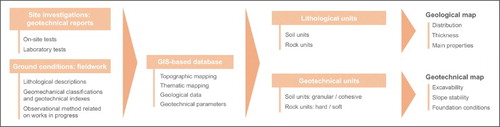
Following the fieldwork, all the geological and geotechnical data collected was integrated into a relational GIS-based database implemented in ArcGIS. This software made it possible to perform the data entry and its handling within a geodatabase formed by feature dataset, feature class and tables. This digital repository also integrates geographic information: topographical cartography, orthophotographies and a variety thematic maps.
Using procedures of spatial analysis the stored geodata were processed to study mainly: (a) distribution and thickness of the geological units; (b) their main geotechnical properties using the geotechnical parameters compiled from laboratory and field-testing. This made possible to stablish the criteria for identifying and mapping the geotechnical units. Primarily, the units were divided into categories (‘zone’) according to their lithological nature (rock, soil, mixed); the second level of differentiation (‘subzone’) is based on the prevailing uniaxial compressive strength (UCS) of the unit; on a third level called ‘unit’, it is imperative that the geotechnical unit can be mapped; and finally, ‘soil’ and ‘rock’ units were further subdivided (‘subunit’) into granular/cohesive soils and hard/soft rocks (CitationDearman, 1991; CitationIAEG, 1976; CitationMatula, 1981; CitationVarnes, 1974), respectively.
In order to complete the process of preparing the geo-engineering map, an evaluation of constructive considerations was addressed. The estimation of excavability was carried out on the basis of the compressive strength of rocks (CitationPettifer & Fookes, 1994) and the compactness of soils. In this case, dense to very dense soils are considered as normal ripping materials while loose to very loose soil are considered as easy ripping materials.
Slope stability assessment was approached on standard sections (6 m high, slopes between 1H:10 V and 3H:2 V ratio, shallow water table and no external load) with 2D finite-element software (RS2) using the shear strength reduction method (CitationGriffiths & Lane, 1999) and the Mohr-Coulomb failure criterion.
The evaluation of the geotechnical units for foundation works is based on the estimation of the bearing capacity. The Spanish legislation provided the formulation for the quantitative determination in shallow foundations (CitationMinistry of Housing, 2006). Thus, the equation proposed by CitationHansen (1970) was used for soils. Moreover, in frictional soils the bearing capacity is checked with empirical correlations such as NSPT. Finally, an analytical calculation on the basis of the UCS and discontinuities of the rocks was used. As a complement for guidance purposes, a map of qualitative geotechnical zoning was developed and included into the geo-engineering map. Four areas were established: good, acceptable, bad and worst ground conditions.
3. Results
3.1. GIS-type geotechnical database
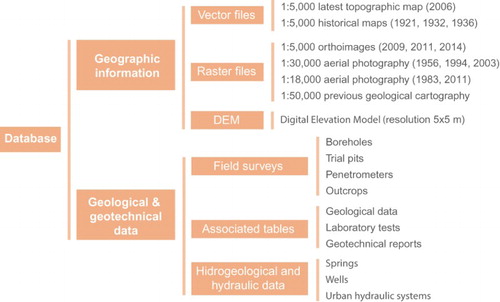
The geodatabase comprises two main data sets, (1) geographic base and (2) geologic and geotechnical data. This last category incorporates both 3D georeferenced data (X, Y, Z coordinates) and tabulated data, following the scheme given in . Moreover, ETRS-89/UTM-30T was used as reference spatial System.
Figure 3. General organization of collected data.
3.2. Geological mapping
Geological map of the study area at scale 1:25,000 is presented in this work. It incorporates substantial improvements in the bedrock mapping (CitationJulivert et al., 1972) and also includes the spatial distribution of Quaternary formations. Palaeozoic rocks mainly outcrop in the south of Avilés city and underlie the neighbourhood of Piedras Blancas. Furthermore, they are affected by a Variscan set of thrust and folds with a major NE-SW trend and strata dip above 35°. Lower- Middle Devonian siliceous and carbonate units make up the greatest outcrops (Rañeces Group and Naranco Formation).
The greatest extent of outcrops within the central area is composed by Permo-Triassic rocks. These unconformable materials overlie the Palaeozoic basement showing subhorizontal strata. The Mesozoic is crossed by NE-SW and NW-SE trending recent faults.
Marine Quaternary deposits are placed along the entire coast and overlie the Mesozoic and Palaeozoic bedrock. Deposits linked to marine-fluvial dynamics cover estuary adjacent areas, where a great part of the city is built as well as the main industrial areas. Finally, in the westernmost part of the study area significant residual deposits are developed in Devonian materials.
3.3. Geological and geotechnical features of the Quaternary deposits
This work integrates, for the first time in the area, the geological and geotechnical aspects of recent deposits. Accordingly, detailed geotechnical parameters are given in Tables (1–8) included in the supplementary material.
3.3.1. Estuary deposits
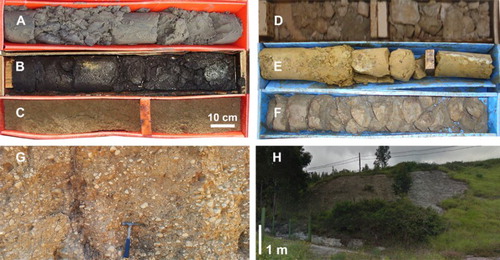
They are composed of loose to very loose coarse-grained sands and gravels (<20%) (Unified Soil Classification System) (). In detail, they are classified as SP (poorly graded sand), SP-SM (poorly graded sand with silt), SM (silty sand) and SC (clayey sand). These sediments are also represented by soft clayey levels (mainly CL, and to a lesser extent CH and MH-OL) with low organic matter content (<1%). For the granular soil alone, the moisture content is <24% and for cohesive soil is >38%. Regarding the mechanical properties, the average Unconfined Compressive Strength (UCS) is 60 kPa for granular material The UCS decreases to 40 kPa for fine-grained layers. The latter shows an average cohesion of 19.7 kPa and an angle of internal friction of 36°. CL and ML type soils may be collapsible according to Gibbs criteria (CitationGibbs & Bara, 1967). With regard to the sediments thickness, this mainly ranges from 9 to 20 m (N = 199), up to a maximum of 45 m in the estuary centre. The thickness decreases towards the banks.
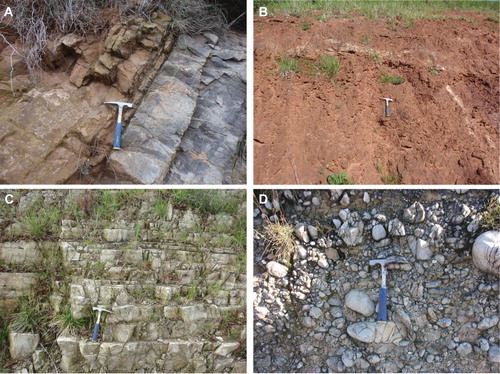
Figure 4. Borehole cores and outcrops of the Quaternary sediments identified in the studied area: (A) estuary deposit; (B) marsh deposit; (C) shore deposit; (D) alluvial deposit; (E) elluvial deposit; (F) Flat raised surfaces deposit; (G) colluvial deposit; (H) blast furnace slag heap.
3.3.2. Marsh deposits
They include clays, silts and muds with a soft consistency (). They are classified as CL, ML-OL, CL-ML type and, to a lesser extent, CH and MH-OH type. These sediments show intercalated sands and gravel levels with a medium to loose compactness (SM, SP-SM and GC). The moisture content is very large, particularly CH type soil (>40%). Granular soils show the lowest values (25% on average). The UCS is, on average, <12 kPa. Moreover, cohesion increases from 27.5 kPa in soils of low plasticity to 117.7 kPa in plastic soils. The angle of internal friction reaches 25° for the granular soils. Overall, marsh deposits show a low or non-existent swell potential, although several samples of CL type soils are potentially collapsible. The thickness mainly ranges from 4 to 8 m (N = 96), though sometimes it can get over the 16 m.
3.3.3. Shore deposits
They are mainly composed by uniform sands with <5% of fine grains and <4% of gravels (). Thus, they are named SP and, to a lesser extent, SP-SM, SP-SC and SM. These sands exhibit a medium to loose compactness with a relatively high water content being the median 16%. The UCS for these deposits has widely different values, which are specific from soft to hard soils. Furthermore, the median value for the internal friction angle is 26°, while cohesion is 16 kPa. This unit has an average thickness of 5 to 9 m (N = 34) and maximum values of 14 m.
3.3.4. Alluvial deposits
They are composed of sands and gravels with intercalated clay and silt layers (). Cohesive soils of a medium consistency are mainly classified as CL type soil (to a lesser extent CL-ML, ML, OL and MH). Very dense granular soils are identified as SM, SC, SP-SM and GC type soils. Fine-grained soils exhibit high water content, with a median of over 25%, while coarse-grained soils show the average value of 15%. The median UCS of cohesive soils is 11 and 80 kPa in granular soils. It must be taken into account the dispersion of measured results. The median cohesion is 47.07 kPa for fine, which decrease for coarse-grained soils. The latter exhibit an internal friction angel of 25°. The thickness of the unit varies greatly. In general the unit shows values of between 4 and 6 m (N = 106), reaching maximum of 15 m.
3.3.5. Eluvial deposits
They are formed by clays and silty clays () such us CL and, to a lesser extent, ML, which come from marly Permo-Triassic and carbonate Jurassic bedrock. Only 25% of soil samples have high plasticity. The moisture content of CH and ML soils type is very large (36.5% and 34.2%, respectively). Furthermore, water content decreases to 21.3% for CL soil type. Low plasticity soils show an average UCS of 20 kPa and a median cohesion of 39.2 kPa. On the other hand, high plasticity soils increase to 75.02 kPa and exhibit moderate to high expansion potential according to Oteo criteria (Citation1986). CL type soils may be collapsible in some cases. The thickness of these deposits varies greatly, reaching 4.5 m over the carbonate Jurassic bedrock and 11 m over Permo-Triassic levels.
3.3.6. Colluvial deposits
They are composed by very heterogeneous materials such as cobbles, gravels, loose sands and low plasticity clays () with thicknesses between 2 and 3 m. These sediments are usually of little extension and can be found on the lower part of hillsides.
3.3.7. Flat raised surfaces deposits
They are integrated by pebbles and gravels which have a sandy matrix (GP-GM, GM, SM and SC) or clayey (CL, ML, MH and CL-ML) (). Granular soils exhibit water contents <12% on average, while cohesive soils shows median values of around 15%. The median UCS is 0.16 MPa for fine-grained material. This unit has a thickness from 5 to 9 m and their origin is linked to old alluvial fans close to the coast.
3.3.8. Anthropic deposits
They are formed by grains of diverse origin () that exhibit high water content with a median of 29% and low dry density with a median value of 1.12 g/cm3. The UCS for these deposits is specific of soft to very soft soils (<0.15 MPa). They also show median values of 30.5° for the angle of internal friction and 13.7 kPa for cohesion. Several potentially collapsible soils were locally identified.
All the Quaternary sediments (including the anthropic deposits) constitute free aquifers, which are constrained and conditioned by the geometry and nature of the materials. The sandy and gravelly soil are the most important, reaching values of permeability of up to 8.4 × 10⁻⁵ m/s. Moreover, The Quaternary aquifers, which are located more closely to the shore, show a high salt content because of the sea influence.
These aquifers have been locally exploited in the past to supply water to different towns. As with the aquifers linked to the bedrock, the urban and industry demand currently require an external water supply coming from other areas in the region.
3.4. Geological and geotechnical features of the bedrock
In this study, the main geotechnical properties of rocks on which major sites are built were established. The detailed geotechnical parameters are given in Tables (9–13) included in the supplemental material.
3.4.1. Rañeces group
It is composed of siltstones, shales and limestones (). It has an average bulk density of 2.72 g/cm3 and a median water content of 0.7%. From a geomechanical viewpoint, the median compressive strength corresponds to the ‘low’ class (18 MPa) (CitationISRM, 1981). However, there is a large variation in values due to the presence of heterogeneous rocks.
Figure 5. Outcrops of the main Palaeozoic and Mesozoic lithological units: (A) limestones of the Rañeces Group; (B) reddish lutites and sandstones of Upper Permo-Triassic Unit; (C) dolomites of Jurassic Carbonated Unit; (D) conglomerates of Jurassic Conglomerated Unit. See location in (bottom).
3.4.2. Upper Permo-Triassic Unit
The major part of the urban area is placed on this unit (). It exhibits a highly variable geotechnical behaviour as a consequence of its lithology. Clay levels correspond to low plasticity type soils and the average dry density is 1.7 g/cm3. The median moisture content is <25%. The average UCS is 0.16 MPa for clays, 0.15 MPa for silts and 0.3 MPa for sands. The values of undrained cohesion of clays and silts are 58.8 kPa and 72.6 kPa, respectively, which correspond to soft or medium consistency. Related to the compressibility, the compression index value is medium or low (<0.2). Finally, the soils exhibit low or very low expansion potential. Regarding the rock properties, marls and lutitic levels have a bulk density of 2.12 g/cm3. The average moisture content is approximately 12.7%. The average compressive strength is 2.5 MPa (‘very low’ class), although it must be taken into account the dispersion of measured results. Concerning to sandstones, the average bulk density is 2.4 g/cm3, and the median moisture content is 10%. Up to 30% of the samples exhibited evidences of sulphates, although the degree of attack is weak. Finally, the average pressuremeter modulus is 96.8 MPa.
3.4.3. Carbonate Jurassic Unit
It is made up of dolomitic limestones, dolomites and marls (). The first two lithologies have an average dry density of 2.38 g/cm3, and the median moisture content is 6.8%. The average compressive strength (34.8 MPa) corresponds to the ‘moderate’ class (CitationISRM, 1981). In marls levels, the values of dry density and water content are respectively 1.7 g/cm3 and 14.9%. They exhibit a hard or very hard consistency. The UCS is 1.1 MPa on average. Lastly, the pressuremeter modulus ranges between 5 and 96 MPa.
3.4.4. Conglomerate Jurassic Unit
It is composed of conglomerates and sandy levels (). It has an average water content of 9.2% being higher in the sandy levels. The matrix includes low plasticity fine-grained soils that show an average organic matter content of 0.4%. Finally, the median compressive strength is 35 MPa, although it exhibits a significant deviation in the results.
From a hydrogeological point of view, the Jurassic rocks constitute the most important aquifers of the study area and develop karst systems. Furthermore, fissured aquifers associated with the joint network are formed in Permo-Triassic materials. To a lesser extent, porosity aquifers linked to the sandstones level are developed.
3.5. Geotechnical mapping
Unprecedented geotechnical map of the study area at 1:25,000 scale is presented in this research. It exhibits the spatial distribution of the 14 geotechnical units that were previously stablished. These were grouped into three major categories (rocks, mixture and soils) within which five subcategories were differentiated (see Geotechnical map in supplemental material) (Main Map).
In the geo-engineering map, the geotechnical issues for each of the geotechnical units are summarized. Thus, compressibility phenomena are highlighted in subzones III1 and III2 materials; deposits of III24 and III12 subzones show a low expansion potential; soft or very soft soils of III2 may be collapsible.
The geotechnical behaviour of the ground in urban excavations is also considered in the geotechnical map; all units of III1 and III2 subzones are easily rippable while those of I2 and II1 are partially rippable; Only I11 and I12 are non-rippable. Furthermore, recommended slopes (H/V) are 1H/10 V in I1 subzone, 1H/5V in I2 subzone and, finally, 1H/1V to 3H/2V in III1 and III2 subzones.
The geotechnical map incorporates an inset that shows four types of areas concerning the ground behaviour as a foundation level and topographical conditions: The first area (Good ground conditions) corresponds to the I zone (rocks) distribution. Acceptable ground conditions are mainly areas where Permo-Triassic materials are present. Moreover, bad ground conditions are linked to the III1 subzone (alluvial, colluvial, elluvial and flat raised surfaces deposits). Finally, worst ground conditions correspond to the III2 subzone domains involving estuary, coastal, marsh and anthropic deposits.
The bearing capacity, recommended foundation type and potential geotechnical risks are also present in the map. Overall, geotechnical units of I1 and I2 subzones have a medium or high bearing capacity (1–10 MPa). In these areas, direct foundations are recommended. The other subzones exhibit a low bearing capacity, making it necessary to use in many cases depth foundations.
4. Conclusions
This research stablishes an unprecedented geotechnical map of Avilés city and surroundings (N Spain) at scale1:25,000. The mapping procedure is mainly based on exhaustive fieldwork and many unpublished geotechnical data. All the available data were integrated in a geodatabase implemented through a GIS. It comprised two main data sets: (1) geographic base and (2) geologic and geotechnical data. This geodatabase was fundamental in the procedure of preparation of urban mapping.
A starting point to make the geotechnical map, a new and detailed geological map was elaborated (see supplementary material). This document significantly improves the bedrock mapping and includes the identification and the spatial distribution of eight Quaternary formations: alluvial, elluvial, colluvial, shore, marsh, estuary and anthropic deposits.
The new geotechnical map involves 14 geotechnical units grouped into three major categories (rocks, mixtures and soils) and five subcategories. This map integrates a table which synthetizes a constructive conditions valuation (excavabilty, slope stability and foundation conditions) of each geotechnical units. Moreover, it includes a geotechnical zoning map where four foundations categories are distinguished: good, acceptable, bad and worst ground conditions.
The methodology used in this case study may be very useful in the investigations of other similar geotechnical urban environments.
Software
All maps were prepared using ArcGIS 10 (Esri Ltd.). Slope stability analysis was performed using the 2D finite-element software RS2 (Rocscience Ltd.).
Supplementary.zip
Download Zip (17.7 MB)Disclosure statement
No potential conflict of interest was reported by the authors.
ORCID
Luis Pando http://orcid.org/0000-0002-0787-9033
Carlos López-Fernández http://orcid.org/0000-0002-7121-7608
Additional information
Funding
Related Research Data
References
- Alonso, J. L., Marcos, A., & Suárez, A. (2009). Paleogeographic inversión resulting from large out of sequence breaching thrust: The León Fault (Cantabrian Zone, NW Iberia). A new picture of the external Variscan Thrust Bel in the Ibero-Armorican Arc. Geologica Acta, 7, 451–473. doi: 10.1111/j.1755-6724.1994.mp7004007.x
- Alonso, J. L., Pulgar, J. A., García-Ramos, J. C., & Barba, P. (1996). Tertiary basins and alpine tectonics in the Cantabrian Mountains. In P. F. Friend & C. J. Dabrio (Eds.), Tertiary basins of Spain (pp. 214–227). Cambridge: Cambridge University Press. doi: 10.1017/CBO9780511524851.031
- Arbizu, M., & Méndez-Bedia, I. (2006). Patrimonio natural y cultural de Castrillón, (Asturias): Geología, Fósiles e Historia Minera [Natural and cultural heritage of Castrillón (Asturias): Geology, fossils and mining history]. Trabajos de Geología, 26, 73–91.
- Chaminé, H. I., Teixeira, J., Freitas, L., Pires, A., Silva, R. S., Pinho, T., … Carvalho, J. M. (2016). From engineering geosciences mapping towards sustainable urban planning. European Geologist Journal, 41, 16–25.
- Culshaw, M. G., & Northmore, K. J. (2015). Urban engineering geological maps for Bradford, UK. In G. Lollino, A. Manconi, & F. Guzzetti (Eds.), Engineering geology for society and territory, Vol. 5: Urban geology, sustainable planning and landscape (pp. 351–354). Torino: IAEG. doi: 10.1007/978-3-319-0908-1_67
- Dearman, W. R. (1991). Engineering geological mapping. Oxford: Butterworth-Heinemann. doi: 10.1016/B978-0-7506-1010-0.50001-2
- Díaz-Díaz, L. M., Arias, D., López-Fernández, C., & Pando, L. (2014). Geotechnical zoning of urban foundations: Avilés case study (N Spain). In Abstracts of European geosciences union general assembly (pp. 16.6961). Viena: EGU.
- Díaz-Díaz, L. M., Omer, J., & Arias, D. (2016). Finite elements analysis of an underground collector installed by pipe-jacking method. International Journal of Geotechnical Engineering, 1, 1–10. doi: 10.1080/19386362.2016.1250041
- El May, M., Dlala, M., & Chenini, I. (2010). Urban geological mapping: Geotechnical data analysis for rational development planning. Engineering Geology, 116, 129–138. doi: 10.1016/j.enggeo.2010.08.002
- Faccini, F., Robbiano, A., Roccati, A., & Angelini, A. (2012). Engineering geological map of the Chiavari city area (Liguria, Italy). Journal of Maps, 8, 41–47. doi: 10.1080/17445647.2012.668756
- Forster, A., Lawrence, D. J. D., Highley, D. E., Cheney, C. S., & Arrick, A. (2004). Applied geological mapping for mapping and development: An example from Wigan U.K. Quarterly Journal of Engineering Geology and Hydrogeology, 37, 301–315. doi: 10.1144/1470-9236/03-053
- Gibbs, H., & Bara, J. (1967). Predicting problems of collapsing soil. Journal of Soil Mechanics and Foundation Division ASCE, 93, 577–594.
- Griffiths, D. V., & Lane, P. A. (1999). Slope stability analysis by finite elements. Geotechnique, 49, 387–403. doi: 10.1680/geot.1999.49.3.387
- Griffiths, J. S. (2002). Mapping in engineering geology. London: Geological Society.
- Hansen, J. B. (1970). A revised and extended formula for bearing capacity (Report No. 28). Copenhagen: Danis Geotechnical Institute.
- IAEG. (1976). Engineering geology maps: A guide to their preparation. Paris: The Unesco Press.
- International Society for Rock Mechanics. (1981). Rock characterization, testing and monitoring: ISRM suggested methods. In E.T. Brown (Ed.), Suggested methods prepared by the commission on testing methods, ISRM (pp. 211). Oxford: Pergamon Press.
- International Society for Rock Mechanics. (2007). The complete ISRM suggested methods for characterization, testing and monitoring: 1974–2006. In R. Ulusay & Hudson J.A. (Eds.), Suggested methods prepared by the commission on testing methods, ISRM (pp. 628). Ankara: ISRM Turkish National Group.
- International Society for Rock Mechanics. (2015). The ISRM suggested methods for rock characterization, testing and monitoring: 2007–2014. In R. Ulusay (Ed.), Suggested methods prepared by the commission on testing methods (pp. 293). Berlin: Springer/ISRM.
- Julivert, M. (1967). La ventana del Río Monasterio y la terminación meridional del Manto del Ponga [Rio Monasterio fenster and the sourthern part of the Ponga Nappe]. Trabajos de Geología, 1, 1–26. doi: 10.17811/tdg.1.1967.59-77
- Julivert, M., Truyols, J., Marcos, A., & Arboleya, M. L. (1972). Mapa y memoria explicativa de la Hoja n°13 (Avilés) del Mapa geológico de España E. 1:50000 [Map and explanatory memory of sheet 13 (Avilés) of the geological map of Spain at scale 1:50,000]. Madrid: Instituto Geológico y Minero de España.
- Lotze, W. (1945). Zur Gliederung der Varisziden der Iberischen Meseta. Geotektonische Forsch, 6, 78–92. [Spanish translation by J. M. Rios. (1950). Observaciones respecto a la división de los varíscides de la Meseta Ibérica. Inst. L. Mallada. Publicaciones Extranjeras de Geología de España, 5(27), 149–166)].
- López-Peláez, J., & Flor, G. (2008). Evolución ambiental del estuario de Avilés (1833–2006) [Environmental evolution of the Avilés Estuary (1833–2006)]. Trabajos de Geología, 28, 119–135. doi: 10.17811/tdg.28.2008
- Martínez García, E., Coquel, R., Gutierrez Claverol, M., & Quiroga, J. L. (1998). Edad del ‘Tramo de transición’ entre el Pérmico y el Jurásico en el área de Gijón (Asturias, NW de España) [‘Stretch of transition’ between the Permian and Jurassic age in the areac of Gijón (Asturias, NW of Spain)]. Geogaceta, 24, 215–218.
- Masoud, A. A. (2016). Geotechnical site suitability mapping for urban land management in Tanta District, Egypt. Arabian Journal of Geosciences, 9, 1147. doi: 10.1007/s12517-016-2363-4
- Matula, M. (1981). Rock and soil description and classification for engineering geo-logical mapping. Report by the IAEG commission on engineering geological mapping. Bulletin of the International Association of Engineering Geology, 24, 235–274. doi: 10.1007/BF02595273
- Menéndez Casares, E., González Fernández, B., Gutiérrez Claverol, M., & García-Ramos, J. C. (2004). Precisiones sobre los acuíferos de la cuenca jurásica asturiana (NO de España) [Clarifications on the Asturian Jurassic basin (NW of Spain)]. Trabajos de Geología, 24, 119–126.
- Merritt, J. E., & Whitbread, K. (2007). Combining ARC GIS maps and attributed 3D geological models to provide geoscience solutions in the urban environment: Examples from the city of Glasgow and North-East England. In V. Coors, E. M. Fendel, S. Zlatanova, & M. Rumor (Eds.), Urban and regional data management. UDMS annual 2007 (pp. 185–192). Stuttgart: Taylor and Fracis. doi: 10.4324/9780203931042
- Ministry of Housing. (2006). Código Técnico de la Edificación [Technical building code]. Madrid: Boletín Oficial del Estado de España. Retrieved from https://www.boe.es/diario_boe/txt.php?id=BOE-A-2006-5515
- Oliveira, R., Gomes, C., & Guimarães, S. (2009). Engineering geological map of Oporto: A municipal tool for planning and awareness of urban geoscience. In M. G. Culshaw, H. J. Reeves, I. Jefferson, & T. W. Spink (Eds.), Engineering geology for tomorrow’s cities: Proceedings of the 10th IAEG congress, Geological Society, London, Engineering Geology Special Publications (Vol. 22, pp. 1–7). doi: 10.1144/EGSP22.I
- Oteo, C. (1986). Las arcillas expansivas en España: distribución y propiedades [Expansive clays in Spain: Distribution and properties]. Curso sobre cimentaciones en Terrenos metaestables, colapsables y expansivos. Unpublished manuscript.
- Peón, A. (1992). Evolución morfogenética del relieve de Asturias (Unpublished doctoral dissertation). University of Oviedo, Oviedo.
- Pettifer, G. S., & Fookes, P. G. (1994). A revision of the graphical method for assessing the excavability of rock. Quarterly Journal of Engineering Geology and Hydrogeology, 27, 145–164. doi: 10.1144/GSL.QJEGH.1994.027.P2.05
- Tavani, S., Carola, E., Granado, P., Quintà, A., & Muñoz, J. A. (2013). Transpressive inversion of a Mesozoic extensional forced fold system with an intermediate décollement level in the Basque-Cantabrian Basin (Spain). Tectonics, 32, 146–158. doi: 10.1002/tect.20019
- Torres Alonso, M., & Gutiérrez Claverol, M. (2006). Proyecto de colector para aguas residuales de la ría de Avilés [Industrial collector of effluent network Project in Avilés]. Unpublished report.
- Varnes, D. J. (1974). The logic of geological maps, with reference to their interpretation and use for engineering purposes (Report No 837). Washington: U.S. Geological Survey Professional Paper.
- Zuquette, L. V., Pejon, O. J., & Dos Santos Collares, J. Q. (2004). Engineering geological mapping developed in the Fortaleza Metropolitan Region, State of Ceara, Brazil. Engineering Geology, 71, 227–253. doi: 10.1016/S0013-7952(03)00136-4