
 ?Mathematical formulae have been encoded as MathML and are displayed in this HTML version using MathJax in order to improve their display. Uncheck the box to turn MathJax off. This feature requires Javascript. Click on a formula to zoom.
ABSTRACT
Using open-source satellite imagery like Landsat TM, ETM+ and Sentinel 2 can lead to accurate cartographic products. We mapped flood events from Siret and Prut river basins in the last 30 years based on the availability of Landsat data archive. In this area were recorded historical values in flow rates for the entire Romanian territory: 4650 m³/s on the Siret River in 2005 – the maximum value ever recorded for Romania; 4240 m³/s on the Prut in 2008 – second maximum value recorded for Romania. The most powerful floods that took place in Romania in the last years were in 1970, 1975, 1991, 2005, 2008, 2010 and 2011. In this study four years are distinguished by particularly characteristics: 1991, 2005, 2008 and 2010. Developing geo-hydrological hazard maps and adequate analysis at an appropriate scale and as quickly as possible is extremely important from an economic and social point of view.
1. Introduction
The Landsat programme has provided continuous Earth observation data over the past 40 years. The use of such data is increasingly widespread in different research areas. In particular, the application of remote sensing in hydrology shows good results in processing and analysis practices (CitationBanskota et al., Citation2014). Advances in remote sensing techniques promise permanent monitoring and dynamic characterizations for water surfaces and hydrological hazards such as floods (CitationGoetz, Gardiner, & Viers, Citation2008; CitationWang, Colby, & Mulcahy, Citation2002).
Among the natural hazards of the world, floods are probably the most devastating, widespread and frequent disasters, with the strongest impact on humans (CitationSanyal & Lu, Citation2004). In the last few decades, increasingly powerful flood events have been recorded across the entire European continent, and the economies of many countries have suffered important losses (CitationBalica, Dinh, Popescu, Vo, & Pham, Citation2014; CitationMiklín & Hradecký, Citation2016; CitationOlariu, Obreja, & Obreja, Citation2009). In Europe, floods have become a growing topic of concern for citizens, authorities, insurance companies and policy-makers, given that in the last 15 years, the number of floods in European river basins rose from 11 to 64 per decade (CitationBrinke, Knoop, Muilwijk, & Ligtvoet, Citation2017; CitationVan Alphen, Martini, Loat, Slomp, & Passchier, Citation2009). European countries with multiple large floods between 1985 and the present day include Romania, Czech Republic, Slovak Republic, UK, Germany, Italy and Austria, of which Romania was affected most frequently (CitationFaccini, Luino, Sacchini, Turconi, & De Graff, Citation2015; CitationKundzewicz, Pińskwar, & Brakenridge, Citation2013). The most powerful and catastrophic floods are caused by heavy rains. Due to deforestation, the occurrence of rain in mountainous areas often results in a water flow higher than 100–200 mm/24 hours, exceeding the absorptive capacity of soil and the flow capacity of rivers and streams (CitationRomanescu & Stoleriu, Citation2013b). This situation may be the main cause of flooding in the Siret and Prut river basins in NE Romania (CitationPetrisor, Petre, & Meita, Citation2016; CitationRomanescu & Nistor, Citation2011). To minimize the negative consequences of these catastrophic events, decision makers and authorities need accurate information regarding the geographic extent of the areas at risk so that they can apply comprehensive and innovative risk management measures (CitationGitas, Polychronaki, Katagis, & Mallinis, Citation2008; CitationMayer et al., Citation2008).
The public warning systems are extremely diverse and usually effective. Unfortunately, there are cases when they cannot warn the local population in time, and the effects are immeasurable. The bureaucratic management of the responsible institutions, poor communication and low availability of public datasets result in local authorities who lack awareness; therefore, the information does not reach its target audience. For this reason, solutions are sought to supplement the lack of structural warning systems. The aim of this study was to create digital maps for all historical floods events that occurred in the Siret and Prut river basins after 1990 based on Landsat archive availability. The rapid mapping technique of floods is based on satellite imagery and aerial photos, which are usually the most up-to-date sources of data and information on geographic features (CitationBonansea, Rodriguez, Pinotti, & Ferrero, Citation2015; CitationMorris, Citation2008; CitationTulbure, Broicha, Stehman, & Kommareddy, Citation2016). Other mapping techniques include geomorphological data analysis and historical maps (CitationMagliulo & Cusano, Citation2016; CitationMagliulo, Bozzi, & Pignone, Citation2016; CitationVisser, Citation2014). A common practice in the specialized literature, which implies Landsat imagery, is mapping inundations in heterogeneous floodplains and wetlands due to the stagnant character of the water (CitationThomas et al., Citation2015).
Processing techniques in GIS software allow local authorities to manage areas impacted by hazards, incorporate local knowledge and ensure community participation (CitationAstite et al., Citation2015; CitationIreland, Volpi, & Petropoulos, Citation2015; CitationOuma & Tateishi, Citation2014; CitationSami, Mohsen, Afet, & Fouad, Citation2013).
Usually, the specialized research institutes resort to graphical representations that can be rapidly distributed via mass media. This approach involves the quick development of hydrological risk maps in a format appropriate for optimized interpretation of graphical information (CitationRomanescu & Stoleriu, Citation2017; CitationRomanescu, Hapciuc, Minea, & Iosub, Citation2017).
Many negative effects can be mitigated or even eliminated through awareness of the existence of the flood hazard maps, especially those that concern adjacent affected areas (CitationHapciuc et al., Citation2016; CitationRomanescu et al., Citation2017). In this context, most developed or developing countries that have had large numbers of floods are recording data on the origin, effect and quantitative measures of major flood events (CitationAdjim, Djedid, & Hamma, Citation2017; CitationRadevski & Gorin, Citation2017).
2. Regional setting
The Siret and Prut river basins drain the eastern part of Romania and are the largest river basins in Romania in terms of watershed surface. The temperate continental climate with heavy rains creates favourable conditions for extreme floods. The historical floods in Romania on the interior rivers (the Danube River is exempt because it is a border river) were produced on the Siret River in 2005 (first place) and the Prut River in 2008 (second place). Both rivers originate from the territory of Ukraine, in the Eastern Carpathian Mountains, and pour into the Danube River south and north of Galati City ((a)).
Figure 1. (a) Geographical location of Prut and Siret basin (red line) on the Romanian territory (crosshatch red polygon). Aerial images from (b) Siret in 2005 and (c) Prut in 2008 historical flood events.
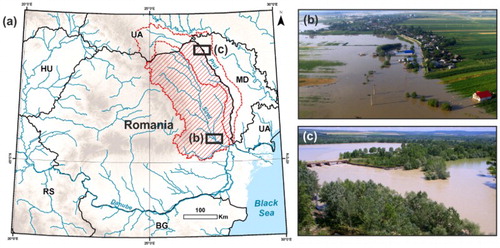
Historical floods in Moldova, which occurred in these two watersheds, were recorded in 1991, 2005, 2008 and 2010. The absolute maximum flow in NE Romania was recorded in 2005 on the Siret River at 4650 m³/s ((b)). The second historic flow was recorded in 2008 on the Prut River, and it was 4240 m³/s ((c)). The initial communicated flow was 7140 m³/s, which would have been the maximum ever recorded for Romania, but the Stanca-Costesti Reservoir, located on the Prut River, decreased the flow value at the Stanca-Costesti hydrometric station to 4240 m³/s (CitationRomanescu & Nistor, Citation2011; CitationRomanescu & Stoleriu, Citation2017).
3. Mapping methods
3.1. Hydrological data and flood inventory
To identify areas affected by flooding in the last 30 years in the NE region of Romania, hydrological data provided by the Water Basin Administration of the Prut and Siret Rivers were analyzed. The data consisted of flow rates and levels recorded from 20 hydrometric stations. Historical floods were selected based on the maximum hydrograph values from each hydrometric station ().
Table 1. Hydrological data characteristics of the major floods events identified within cloud-free Landsat datasets in the last 30 years in NE of Romania.
For each event, a search of both the Landsat (TM and ETM +) and Sentinel (1 and 2) databases was conducted. As a case study, only the visible floods with cloud coverage less than 30% were selected (1991 and 2005 flood events in the lower Siret River sector; 1991, 2008 and 2010 flood events in the middle Siret River sector; a 1991 flood event on the Jijia River; and a 2008 flood event on the Prut River). Landsat Thematic Mapper (TM) data, Enhanced Thematic Mapper Plus (ETM+) and Sentinel-2 multi-spectral imagery were used, along with Shuttle Radar Topography Mission (SRTM) elevation data. Due to their free nature, accessibility and global coverage, the datasets provided quantitative results with few difficulties (CitationTeeuw, Mcwillian, Whiteside, & Zukowskyj, Citation2005). The catastrophic impacts of these events were realized by capturing the maximum extent of the flood area through the satellite images.
3.2. Remote sensing image processing
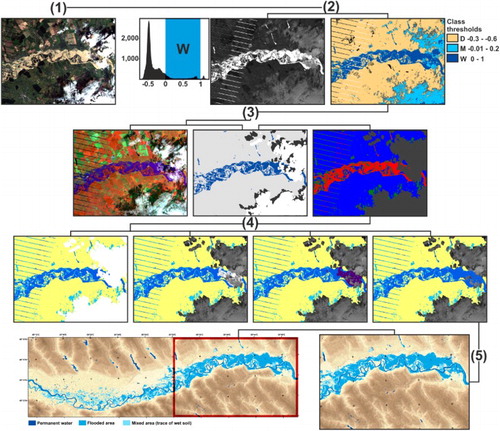
We produced flood maps using five steps: (1) image selection and pre-processing; (2) water index calculations; (3) classification of satellite images into classes, that is, water/flooded, mixed areas (the mixed class include traces of wet soil and wet areas which were part of the maximum extent of the flood) and dry land for each image; (4) an accuracy assessment of the classified scenes; and (5) the production of maps of the flooded areas ().
Figure 2. Classification process (from left to right) using: (1) an inundation Landsat image (RGB:321) illustrating a large flood (24 July 2008 on Prut river), (2) a derived water index: MNDWIB2/B5(i) grouped into class thresholds – water (W) (blue), mixed (M) (light blue) and dry land (D) (light brown), (3) Landsat image (RGB:472), cloud mask and classification result, (4) vector export with no data under cloud mask, vector overlay with MNDWI, vector overlay with MNDWI and water threshold vector, vector refinement with automatic and manual data recovery and (5) production of the flood maps.
In total, seven Landsat TM and ETM+ images of the most catastrophic floods that occurred in NE Romania during the years 1991–2010 were downloaded from the United States Geological Survey (USGS) website (https://earthexplorer.usgs.gov/) The images were Level 1T processed, meaning that they underwent geometric correction and terrain calibration (CitationIrish, Citation1998). Radiometric consistency among ground features in imagery is difficult to maintain due to changes in sensor characteristics, atmospheric conditions, illumination, the solar angle, the sensor view angle and the response (CitationChen, Vierling, & Deering, Citation2005; CitationDu, Feng, Wang, Huang, & Ramadan, Citation2002; CitationLillesand & Kiefer, Citation1994). Consequently, image pre-processing was necessary.
Landsat images were processed in two steps: (1) radiometric calibration and (2) atmospheric correction; these steps are the two types of corrections that are commonly employed to normalize remotely sensed images (CitationCoppin, Jonckheere, Nackaerts, Muys, & Lambin, Citation2004; CitationDu, Teillet, & Cihlar, Citation2002; CitationKaufman, Citation1998; CitationRoy et al., Citation2016; CitationSchott, Citation1997; CitationSong, Woodcock, Seto, Lenney, & Macomber, Citation2001). This method of data acquisition and data extraction has been used in numerous studies that focused on mapping different phenomena or on particular properties that occur or are revealed on the Earth’s surface, such as mining activities (CitationCutaia, Massacci, & Roselli, Citation2004; CitationLobo, Costa, & Novo, Citation2015), water quality parameters and temperature (CitationBonansea et al., Citation2015; CitationDing & Elmore, Citation2015; CitationTebbs, Remedios, & Harper, Citation2013), water surface extent and dynamics (CitationMueller et al., Citation2016) and mapping major flood events (CitationBhatt et al., Citation2016; CitationCutaia et al., Citation2004; CitationSakai et al., Citation2015; CitationSandholt et al., Citation2003; CitationThomas et al., Citation2015; CitationTulbure et al., Citation2016; CitationWang, Citation2004; CitationYang et al., Citation2015).
Radiometric correction aims to extract the absolute reflectance of features at the surface of the earth. This method requires the sensor calibration gain and bias coefficients derived from the L1T file metadata (CitationChander, Markham, & Helder, Citation2009). The imagery was normalized by converting digital numbers (DN) to TOA (top of the atmosphere) reflectance using the equations and coefficients provided in CitationChander et al. (Citation2009). The radiometric correction also involved two steps: (1) the first step was to convert the DN of the sensor measurements into spectral radiance measured by satellite sensors (Equation 1), and (2) the second step consisted in converting the radiance data into surface reflectance according to the following equation.(1)
(1) where Lλ – spectral Radiance at the sensor’s aperture; QCAL – the quantized calibrated pixel value; Lminλ – the spectral radiance that is scaled to QCALmin; Lmaxλ – the spectral radiance that is scaled to QCALmax; QCALmin – the minimum quantized calibrated pixel value; QCALmax – the maximum quantized calibrated pixel value (=255).
For clear Landsat scenes, a reduction in between-scene variability can be achieved through the normalization of solar irradiance by converting spectral radiance, as calculated above, to planetary reflectance, or albedo (CitationNASA, Citation2011) (Equation 2).(2)
(2) where Pλ – Unitless planetary reflectance; Lλ – spectral radiance (Equation 1); d – Earth–Sun distance; Esunλ – mean solar exoatmospheric irradiances; θ – solar zenith angle at the center acquisition (radians). The quantities Esunλ and d are tabulated by CitationChander et al. (Citation2009) and θ is calculated from the solar elevation angle stored in the L1T file metadata (CitationRoy et al., Citation2016).
Atmospheric correction was performed using the FLAASH module in ENVI. A mid-latitude summer atmospheric model was selected to define the amount of water vapour, and a rural aerosol model was used to define the aerosol/haze type (due to the location of the study area). For aerosol retrieval, the ‘2-band (K-T)’ option was used, which estimates aerosol/haze based on the recommendations of CitationKaufman et al. (Citation1997) and CitationChander et al. (Citation2009). The single scale factor for each band was set to 1 (default value) thanks to previous work on the radiometric calibration module in which ENVI has created a radiance image suitable for the FLAASH module by transforming the image units into µW/(cm2 * sr * nm). The FLAASH output includes a bottom-of-atmosphere true reflectance value for each pixel.
The modified normalized difference water index (MNDWI) was derived using the green band and the middle infrared band (MIR) and was used to enhance the presence of water based on infrared reflectance; this method is widely used in delineating water bodies from satellite images (CitationXu, Citation2006). The computation of this index highlights water pixels (CitationLi et al., Citation2013; CitationThomas et al., Citation2015). The MNDWI proposed by CitationXu (Citation2006) replaces the traditional near infrared band (NIR) used by CitationMcFeeters (Citation1996) with the MIR band, which results in more accurate results when extracting water features (Equation 3).(3)
(3)
After pre-processing and MNDWI computation, a supervised maximum likelihood image classification was performed (CitationJiang et al., Citation2014; CitationOtukei & Blaschke, Citation2010). Maximum likelihood algoritm is one of the most common used in land use/cover classification, therefore could be applied eficiently to classify the water bodies (CitationDu, Teillet, et al., 2002; CitationZhang et al., Citation2016).
The first step included the identification of several training areas, composed of water (W), mixed (M) and non-water (dry-D) areas. The training areas were selected based on the MNDWI results, establishing three sets of thresholds for three different classes (W, M and D). The water class was limited to MNDWI positive values (0–1), the mixed class threshold was set in the interval −0.2 and 0, and the dry class was assigned more negative values (−0.2 to −1).
A cloud mask was performed using Fmask software for automated clouds, cloud shadows and snow masking in Landsat TM/ETM+ scenes (CitationZhu, Wang, & Woodcock, Citation2015). ENVI software was used to perform a signature analysis that involved a statistical characterization of the training areas previously selected from MNDWI (i.e. W, M and D). Once a statistical characterization was achieved, the image was classified into one of the three classes: water areas, mixed areas and dry areas.
To evaluate the accuracy of classifications, a confusion matrix was performed using the flood maps provided by the SERTIT (Regional Service of Remote Sensing and Image Processing) online platform within the University of Strasbourg (http://sertit.u-strasbg.fr/RMS/) as ground truth images. We manually digitized the flood areas provided by the SERTIT maps to compare them with the results of the classification. The overall accuracies obtained for the Siret lower basin 2005 flood, the Prut 2008 flood and the Siret middle basin 2008 flood classifications were over 85%. The kappa index value was above 0.8, supporting the consistency of the classification.
The permanent water vector was extracted from Sentinel-2 and Landsat data. The final step before map production consisted of vector refinement and data recovery under low-density clouds and no-data strip areas on Landsat ETM+ scenes. This procedure was performed by merging the water threshold vector, which displays the flood areas correctly under low-density clouds, with the classification vector. The no-data strip areas on Landsat ETM+ scenes were manually corrected.
4. Historical flood events
Since 1991, catastrophic floods were recorded just after the major events that led the country to capitalism, not only in Moldova, the region affected by the Siret and Prut river basins, but also across all Romanian territory. After the movement of inhabitants from the mountainous regions and forest restitutions, Romania witnessed the emergence of flood events at increasingly high levels and frequencies, with floods occurring in 1991, 2005, 2006, 2008, 2010 and 2011 (CitationCojoc, Romanescu, & Tirnovan, Citation2015; CitationRomanescu, Zaharia, Sandu, & Juravle, Citation2015). At the same time, historical flows at hydrometric stations located in the Siret basin were recorded at Dragesti, with 2884 m³/s in 2010, and Lungoci, with 3110 m³/s in 1991; flows in the Prut basin were recorded at Radauti-Prut, with 2310 m³/s in 2010, and at Andrieseni, with 460 m³/s in 2005, on the Jijia River (CitationRomanescu & Stoleriu, Citation2013a, Citation2013b; CitationRomanescu, Stoleriu, & Romanescu, Citation2011). We managed to map the historical floods that occurred in the Siret and Jijia River basins (1991); the Siret lower basin (2005); the Prut River basin, upstream of the man-made Stanca-Costesti Reservoir (2008); and the Siret middle basin, upstream of Bacau City (2010) (see Main Map).
4.1. Case study: flood events in the Siret lower basin (1991 and 2005)
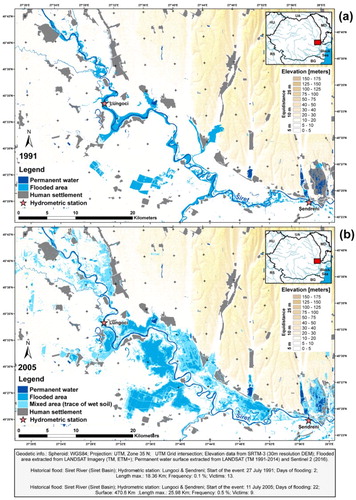
The main features of the flood events in the Siret lower basin are reported in . The flood produced in the summer of 1991 does not have historical character but was still mapped to capture an overview of the geo-hydrological hazards in the lower Siret basin ((a)). The historical flood recorded in this section of the river occurred in 2005 ((b)). This flood started on 11 July and lasted 22 days. Loss figures were considerable: 25.98 km of the river sector was affected, and 470.6 km² of agricultural land was affected, in addition to human settlements and hydro-technical construction. The flow frequency of this event was 0.5% (4650 m³/s, the maximum value ever recorded for Romania). During the event, dozens of people were injured, and 9 victims were reported (CitationRomanescu & Nistor, Citation2011).
Figure 3. Historical floods on Siret River – (a) 27 July 1991 and (b) 11 July 2005, extracted from Landsat TM and Landsat ETM+ scenes from 1 August 1991 and 31 July 2005.
4.2. Case study: flood events in the Siret middle basin (1991, 2008 and 2010)
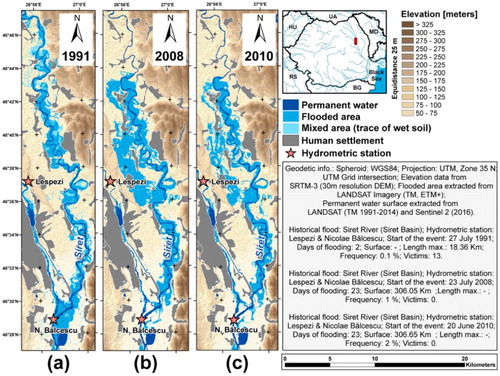
Catastrophic floods occurred as well in the middle basin of the Siret River. The most important adverse hydrological events associated with the maximum spill occurred in 1991, 2008 and 2010 (). The historical flood of 1991 started on 27 July and lasted two days. This flood affected villages along a river sector 18.36 km long ((a)). The flow frequency of this event was 0.1% and affected 13 victims, labelling it the most devastating flash flood that occurred in the NE region of Romania. Another historical flood recorded in the middle Siret river basin started on 23 July 2008 and lasted 23 days ((b)). This flood affected an area of 306.05 km² and had a flow frequency of 1%. No casualties occurred, though significant economic losses were recorded. The flood from 2010 was similar to the one in 2008, demonstrating poor management of crisis situations. The event started on 20 June and lasted 23 days (flow frequency 2%), affecting 306.6 km² ((c)). These two consecutive events caused serious losses in rural communities due to their high rate of sediment transportation (CitationRomanescu & Stoleriu, Citation2013b).
Figure 4. Historical floods on Siret River – (a) 27 July 1991, (b) 23 July 2008 and (c) 20 June 2010, extracted from Landsat TM and Landsat ETM+ scenes from 31 July 1991, 29 July 2008 and 3 July 2010.
4.3. Case study: flood events in the Jijia lower basin (1991)
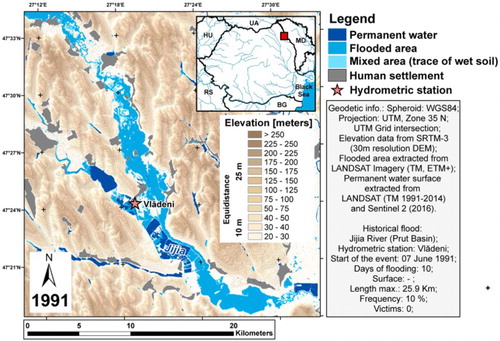
Historical floods occurred also in the Prut river basin (). The event that started on 7 June 1991 in the Jijia River (the right tributary of the middle Prut River) lasted 10 days and affected rural communities along a river sector of 25.9 km. No casualties were reported, but negative consequences affecting population health were reported due to the pollutants transported from agricultural and livestock activities nearby. At this time, as a result of these events, the entire floodplain of the Jijia River is undergoing major hydro-technical modifications to combat flooding events (CitationRomanescu & Stoleriu, Citation2013b; CitationRomanescu et al., Citation2015).
Figure 5. Historical flood on Jijia River – 7 June 1991, extracted from Landsat TM scene from 22 June 1991.
4.4. Case study: flood events in the Prut river basin – upstream of Stanca-Costesti man-maid reservoir (2008)
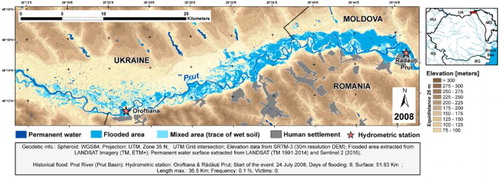
Historical floods occurred in 2008 in the upper basin of the Prut River, located at the border shared by Romania, Ukraine and the Republic of Moldova started on 24 July and lasted eight days (). The hydrological event affected 51.83 km² of agricultural land and human settlements over a total river sector length of 36.5 km. The flow frequency of this event was 0.1% (4240 m³/s, the second highest value ever recorded for Romania). During the event, no causalities occurred, but this event could have had catastrophic consequences if the Stanca-Costesti Reservoir located downstream would have yielded due to the absence of competent authorities (CitationRomanescu et al., Citation2011; CitationRomanescu & Stoleriu, Citation2017).
Figure 6. Historical flood on Prut River – 24 July 2008, extracted from Landsat ETM+ scene from 29 July 2008.
5. Conclusions
The present analysis allowed the mapping of historical flood events in the last 30 years in NE Romania. Using open-source optical imagery (i.e. Landsat and Sentinel-2) we attempted to create useful cartographical materials to represent geo-hydrological hazards. The results include supplementary data on the extent of national flood risks, which can be consulted following this link: http://gis2.rowater.ro:8989/flood/.
In this period, the number of reported floods exceeded the severity and magnitude of previous ones. As a result, continuous improvement of flood management is vital. For a better understanding of this phenomenon, accurate flood hazard maps are required and should be based on good knowledge and be applicable to the areas adjacent to the main river and to the related risk zones.
To highlight the physical and geographical particularities, which play a key role in the delineation of flood extent, the continuous improvement of datasets is mandatory. It is possible to create rapid mapping of hydrological events when the satellite images and specialized software are available. Due to image availability and different spatial mapping methods, geo-hydrological hazard maps can be produced after every major flood event, continuously improving flood risk management. For quick data acquisition and rapid mapping of the flood features, open-source imagery is sufficient, offering immediate access. In floodplains areas, the height of the flood is low, but the surface is large and can be mapped. We also relied on the fact that the inundation of the floodplain area has a persistent character and can be mapped in the immediate days following the peak of the flood.
In this study, the mapping method was applied successfully to the large floodplains located along the Siret and Prut rivers. This mapping method is efficient in terms of cost and time. The map production was inexpensive.
The launch of Sentinel-1 and Sentinel-2 missions will dramatically improve the flood mapping capabilities of Sentinel-1, the Synthetic Aperture Radar sensor that provides continuous imagery (day, night and all weather). In this way, flood extents can be output much faster with no atmospheric impediments and at a better resolution than Landsat data.
Software
Landsat TM and ETM+ images were processed using ENVI image analysis software (Harris Geospatial Solutions). Fmask software used for automatically cloud masking. For downloading pre-processing Sentinel 2 data was used QGIS software. The extracted data (flood extends – WGS84 projection) were exported as shapefile. The vector edits and maps were performed/produced using Esri software ArcGIS 10.3.
Main map
Download PDF (39.1 MB)Acknowledgements
Hydrological data were provided by the Siret Water Basin Administration from Bacau and Prut-Bârlad Water Basin Administration from Iaşi. All information was processed in the Geoarchaeology Laboratory of Alexandru Ioan Cuza University of Iasi.
Disclosure statement
No potential conflict of interest was reported by the authors.
ORCID
Gheorghe Romanescu http://orcid.org/0000-0002-1898-1885
Alin Mihu-Pintilie http://orcid.org/0000-0002-1686-9558
Cristian C. Stoleriu http://orcid.org/0000-0001-8852-2724
Related Research Data
References
- Adjim, H., Djedid, A., & Hamma, W. (2017). Urbanism, climate change and floods: Case of Tlemcen city in Algeria. Urbanism. Architecture. Constructions, 9(1), 71–80.
- Astite, S. W., Medjerab, A., Belabid, N. E., El Mahmouhi, N., El Wartiti, M., & Kemmon, S. (2015). Cartography of flood hazard by overflowing rivers using hydraulic modeling and geographic information system: Oued El Harrach case, (North of Algeria). Revista de Teledetección, 44, 67–79. doi: 10.4995/raet.2015.3985
- Balica, S., Dinh, Q., Popescu, I., Vo, T. Q., & Pham, D. Q. (2014). Flood impact in the Mekong Delta, Vietnam. Journal of Maps, 10(12), 257–268. doi: 10.1080/17445647.2013.859636
- Banskota, A., Kayastha, N., Falkowski, M. J., Wulder, M. A., Froese, R. E., & White, J. C. (2014). Forest monitoring using Landsat time series data: A review. Canadian Journal of Remote Sensing, 40(5), 362–384. doi: 10.1080/07038992.2014.987376
- Bhatt, C. M., Rao, G. S., Farooq, M., Manjusree, P., Shukla, A., Sharma, S. V., … Dadhwal, V. K. (2016). Satellite-based assessment of the catastrophic Jhelum floods of September 2014, Jammu & Kashmir, India. Geomatics, Natural Hazards and Risk, 7, 1–19. doi: 10.1080/19475705.2014.949877
- Bonansea, M., Rodriguez, M. C., Pinotti, L., & Ferrero, S. (2015). Using multi-temporal Landsat imagery and linear mixed models for assessing water quality parameters in Río Tercero reservoir (Argentina). Remote Sensing of Environment, 158, 28–41. doi: 10.1016/j.rse.2014.10.032
- Brinke, W. B. M., Knoop, J., Muilwijk, H., & Ligtvoet, W. (2017). Social disruption by flooding, a European perspective. International Journal of Disaster Risk Reduction, 21, 312–322. doi: 10.1016/j.ijdrr.2017.01.011
- Chander, G., Markham, B. L., & Helder, D. L. (2009). Summary of current radiometric calibration coefficients for Landsat MSS, TM, ETM+ and EO-1 ALI sensors. Remote Sensing of Environment, 113, 893–903. doi: 10.1016/j.rse.2009.01.007
- Chen, X., Vierling, L., & Deering, D. (2005). A simple and effective radiometric correction method to improve landscape change detection across sensors and across time. Remote Sensing of Environment, 98, 63–79. doi: 10.1016/j.rse.2005.05.021
- Cojoc, G., Romanescu, G., & Tirnovan, A. (2015). Exceptional floods on a developed river. Case study for the Bistrita River from the Eastern Carpathians (Romania). Natural Hazards, 77(3), 1421–1451. doi: 10.1007/s11069-014-1439-2
- Coppin, P., Jonckheere, I., Nackaerts, K., Muys, B., & Lambin, E. (2004). Review ArticleDigital change detection methods in ecosystem monitoring: A review. International Journal of Remote Sensing, 25(9), 1565–1596. doi: 10.1080/0143116031000101675
- Cutaia, L., Massacci, P., & Roselli, I. (2004). Analysis of Landsat 5 TM images for monitoring the state of restoration of abandoned quarries. International Journal of Surface Mining, Reclamation and Environment, 18(2), 122–134. doi: 10.1080/13895260412331295385
- Ding, H., & Elmore, A. J. (2015). Spatio-temporal patterns in water surface temperature from Landsat time series data in the Chesapeake Bay, U.S.A. Remote Sensing of Environment, 168, 335–348. doi: 10.1016/j.rse.2015.07.009
- Du, J., Feng, X., Wang, Z., Huang, Y. S., & Ramadan, E. (2002). The methods of extracting water information from spot image. Chinese Geographical Science, 12(1), 68–72. doi: 10.1007/s11769-002-0073-1
- Du, Y., Teillet, P. M., & Cihlar, J. (2002). Radiometric normalization of multitemporal high-resolution satellite images with quality control for land cover change detection. Remote Sensing of Environment, 82, 123–134. doi: 10.1016/S0034-4257(02)00029-9
- Faccini, F., Luino, F., Sacchini, A., Turconi, L., & De Graff, J. (2015). Geohydrological hazards and urban development in the Mediterranean area: An example from genoa (Liguria, Italy). Natural Hazard and Earth System Science, 15, 2631–2652. doi: 10.5194/nhess-15-2631-2015
- Gitas, I. Z., Polychronaki, A., Katagis, T., & Mallinis, G. (2008). Contribution of remote sensing to disaster management activities: A case study of the large fires in the Peloponnese, Greece. International Journal of Remote Sensing, 29(6), 1847–1853. doi: 10.1080/01431160701874553
- Goetz, S. J., Gardiner, N., & Viers, J. H. (2008). Monitoring freshwater, estuarine and nearshore benthic ecosystems with multi-sensor remote sensing: An introduction to the special issue. Remote Sensing of Environment, 112, 3993–3995. doi: 10.1016/j.rse.2008.05.016
- Hapciuc, O. E., Romanescu, G., Minea, I., Iosub, M., Enea, A., & Sandu, I. (2016). Flood susceptibility analysis of the cultural heritage in the Sucevita catchment (Romania). International Journal of Conservation Science, 7(2), 501–510.
- Ireland, G., Volpi, M., & Petropoulos, G. P. (2015). Examining the capability of supervised machine learning classifiers in extracting flooded areas from landsat TM imagery: A case study from a Mediterranean flood. Remote Sensing, 7, 3372–3399. doi: 10.3390/rs70303372
- Irish, R. R. (1998). Landsat 7 science data users handbook. Greenbelt, MD: Landsat Project Science Office-NASA’s Goddard Space Flight Center.
- Jiang, H., Feng, M., Zhu, Y., Lu, N., Huang, J., & Xiao, T. (2014). An automated method for extracting rivers and lakes from landsat imagery. Remote Sensing, 6, 5067–5089. doi: 10.3390/rs6065067
- Kaufman, Y. J., Wald, A. E., Remer, L. A., Bo-Cai Gao, L. A., Rong-Rong Li, L. A., & Flynn, L. (1997). The MODIS 2.1 μm channel-correlation with visible reflectance for use in remote sensing of Aerosol. IEEE Transactions on Geoscience and Remote Sensing, 35(5), 1286–1298. doi: 10.1109/36.628795
- Kaufman, Y. J. (1998). Atmospheric effect on spectral signature-measurements and corrections. IEEE Transactions on Geoscience and Remote Sensing, 26, 441–450. doi: 10.1109/36.3048
- Kundzewicz, Z. W., Pińskwar, I., & Brakenridge, G. R. (2013). Large floods in Europe, 1985–2009. Hydrological Sciences Journal, 58(1), 1–7. doi: 10.1080/02626667.2012.745082
- Li, W., Du, Z., Ling, F., Zhou, D., Wang, H., Gui, Y., … Zhang, X. (2013). A comparison of land surface water mapping using the Normalized Difference Water Index from TM ETM+ and ALI. Remote Sensing, 5, 5530–5549. doi: 10.3390/rs5115530
- Lillesand, T. M., & Kiefer, R. W. (1994). Remote sensing and image interpretation. Toronto: John Wiley and Sons.
- Lobo, F. L., Costa, M. P. F., & Novo, E. M. L. M. (2015). Time-series analysis of Landsat-MSS/TM/OLI images over Amazonian waters impacted by gold mining activities. Remote Sensing of Environment, 157, 170–184. doi: 10.1016/j.rse.2014.04.030
- Magliulo, P., Bozzi, F., & Pignone, M. (2016). Assessing the planform changes of the Tammaro River (southern Italy) from 1870 to 1955 using a GIS-aided historical map analysis. Environmental Earth Sciences, 75(4), 257. doi: 10.1007/s12665-016-5266-5
- Magliulo, P., & Cusano, A. (2016). Geomorphology of the Lower Calore River alluvial plain (Southern Italy). Journal of Maps, 12(5), 1119–1127. doi: 10.1080/17445647.2015.1132277
- Mayer, R., Plank, C., Bohner, A., Kollarits, S., Corsini, A., Ronchetti, F., … Jindra, P. (2008). Monitor: Hazard monitoring for risk assessment and risk communication. Georisk, 2(4), 193–222. doi: 10.1080/17499510802506139
- McFeeters, S. K. (1996). The use of normalized difference water index (NDWI) in the delineation of open water features. International Journal of Remote Sensing, 17, 1425–1432. doi: 10.1080/01431169608948714
- Miklín, J., & Hradecký, J. (2016). Confluence of the Morava and Dyje Rivers: A century of landscape changes in maps. Journal of Maps, 12(4), 630–638. doi: 10.1080/17445647.2015.1068714
- Morris, N. (2008). Low-cost remote sensing and GIS for regional disaster risk reduction, north west Costa Rica. Journal of Maps, 4, 23–38. doi: 10.1080/jom.2008.9711032
- Mueller, N., Lewis, A., Roberts, D., Ring, S., Melrose, R., Sixsmitha, J., … Ip, A. (2016). Water observations from space: Mapping surface water from 25 years of Landsat imagery across Australia. Remote Sensing of Environment, 174, 341–352. doi: 10.1016/j.rse.2015.11.003
- NASA. (2011). Landsat 7 science data users handbook Landsat project science office at NASA’s Goddard Space Flight Center in Greenbelt, 186. Retrieved from http://landsathandbook.gsfc.nasa.gov/pdfs/Landsat7_Handbook.pdf
- Olariu, P., Obreja, F., & Obreja, I. (2009). Unele aspecte privind tranzitul de aluviuni din bazinul hidrografic Trotus si de pe sectorul inferior al raului Siret in timpul viiturilor exceptionale din anii 1991 si 2005 (In romanian). Analele Universitatii Stefan cel Mare Suceava, Geografie, XVIII, 93–104.
- Otukei, J., & Blaschke, T. (2010). Land cover change assessment using decision trees, support vector machines and maximum likelihood classification algorithms. International Journal of Applied Earth Observation and Geoinformation, 12, S27–S31. doi: 10.1016/j.jag.2009.11.002
- Ouma, Y. O., & Tateishi, R. (2014). Urban flood vulnerability and risk mapping using integrated multi-parametric AHP and GIS: Methodological overview and case study assessment. Water, 6, 1515–1545. doi: 10.3390/w6061515
- Petrisor, A. I., Petre, R., & Meita, V. (2016). Difficulties in achieving social sustainability in a Biosphere Reserve. International Journal of Conservation Science, 7(1), 123–136.
- Radevski, I., & Gorin, S. (2017). Floodplain analysis for different return periods of river Vardar in Tikvesh Valley (Republic of Macedonia). Carpathian Journal of Earth and Environmental Sciences, 12(1), 179–187.
- Romanescu, G., Hapciuc, O. E., Minea, I., & Iosub, M. (2017). Flood vulnerability assessment in the mountain-plateau transition zone. Case study for Marginea village (Romania). Journal of Flood Risk Management, doi: 10.1111/jfr3.12249
- Romanescu, G., & Nistor, I. (2011). The effect of the July 2005 catastrophic inundations in the Siret River’s Lower Watershed, Romania. Natural Hazards, 57(2), 345–368. doi: 10.1007/s11069-010-9617-3
- Romanescu, G., & Stoleriu, C. C. (2013a). An inter-basin backwater overflow (the Buhai Brook and the Ezer reservoir on the Jijia River, Romania). Hydrological Processes, 28(7), 3118–3131. doi: 10.1002/hyp.9851
- Romanescu, G., & Stoleriu, C. C. (2013b). Causes and effects of the catastrophic flooding on the Siret River (Romania) in July-August 2008. Natural Hazards, 69, 1351–1367. doi: 10.1007/s11069-012-0525-6
- Romanescu, G., & Stoleriu, C. C. (2017). Exceptional floods in the Prut basin, Romania, in the context of heavy rains in the summer of 2010. Natural Hazards and Earth System Sciences, 17, 381–396. doi: 10.5194/nhess-17-381-2017
- Romanescu, G., Stoleriu, C. C., & Romanescu, A. M. (2011). Water reservoirs and the risk of accidental flood occurrence. Case study: Stanca–Costeşti reservoir and the historical floods of the Prut river in the period July–August 2008, Romania. Hydrological Processes, 25(13), 2056–2070. doi: 10.1002/hyp.7957
- Romanescu, G., Zaharia, C., Sandu, A. V., & Juravle, D. T. (2015). The annual and multi-annual variation of the minimum discharge in the Miletin catchment (Romania). An important issue of water conservation. International Journal of Conservation Science, 6(4), 729–746.
- Roy, D. P., Kovalskyy, V., Zhanga, H. K., Vermote, E. F., Yana, L., Kumar, S. S., & Egorova, A. (2016). Characterization of Landsat-7 to Landsat-8 reflective wavelength and normalized difference vegetation index continuity. Remote Sensing of Environment, 185, 57–70. doi: 10.1016/j.rse.2015.12.024
- Sakai, T., Hatta, S., Okumura, M., Hiyama, T., Yamaguchi, Y., & Inoue, G. (2015). Use of Landsat TM/ETM+ to monitor the spatial and temporal extent of spring breakup floods in the Lena River, Siberia. International Journal of Remote Sensing, 36(3), 719–733. doi: 10.1080/01431161.2014.995271
- Sami, K., Mohsen, B. A., Afet, K., & Fouad, Z. (2013). Hydrological modeling using GIS for mapping flood zones and degree flood risk in zeuss-koutine basin (south of Tunisia). Journal of Environmental Protection, 4, 1409–1422. doi: 10.4236/jep.2013.412161
- Sandholt, I., Nyborg, L., Fog, B., Lô, M., Bocoum, O., & Rasmussen, K. (2003). Remote sensing techniques for flood monitoring in the Senegal River Valley. Geografisk Tidsskrift - Danish Journal of Geography, 103, 71–81. doi: 10.1080/00167223.2003.10649481
- Sanyal, J., & Lu, X. X. (2004). Application of remote sensing in flood management with special reference to monsoon Asia: A review. Natural Hazards, 33(2), 283–301. doi: 10.1023/B:NHAZ.0000037035.65105.95
- Schott, J. (1997). Remote sensing – the image chain approach. New York, NY: Oxford University Press.
- Song, C., Woodcock, C. E., Seto, K. C., Lenney, M. P., & Macomber, S. A. (2001). Classification and change detection using Landsat TM data: When and how to correct atmospheric effects? Remote Sensing of Environment, 75, 230–244. doi: 10.1016/S0034-4257(00)00169-3
- Tebbs, E. J., Remedios, J. J., & Harper, D. M. (2013). Remote sensing of chlorophyll-a as a measure of cyanobacterial biomass in Lake Bogoria, a hypertrophic, saline–alkaline, flamingo lake, using Landsat ETM+. Remote Sensing of Environment, 135, 92–106. doi: 10.1016/j.rse.2013.03.024
- Teeuw, R. M., Mcwillian, N., Whiteside, M., & Zukowskyj, P. M. (2005). Geographical information sciences and fieldwork. London: Royal Geographical Society.
- Thomas, R. F., Kingsford, R. T., Lu, Y., Cox, S. J., Sims, N. C., & Hunter, S. J. (2015). Mapping inundation in the heterogeneous floodplain wetlands of the Macquarie Marshes, using Landsat Thematic Mapper. Journal of Hydrology, 524, 194–213. doi: 10.1016/j.jhydrol.2015.02.029
- Tulbure, M. G., Broicha, M., Stehman, S. V., & Kommareddy, A. (2016). Surface water extent dynamics from three decades of seasonally continuous Landsat time series at subcontinental scale in a semi-arid region. Remote Sensing of Environment, 178, 142–157. doi: 10.1016/j.rse.2016.02.034
- Van Alphen, J., Martini, F., Loat, R., Slomp, R., & Passchier, R. (2009). Flood risk mapping in Europe, experiences and best practices. Journal of Flood Risk Management, 2(4), 285–292. doi: 10.1111/j.1753-318X.2009.01045.x
- Visser, F. (2014). Rapid mapping of urban development from historic Ordonance survey maps: An application for fluvial flood risk in Worcester. Journal of Maps, 10(3), 276–288. doi: 10.1080/17445647.2014.893847
- Wang, Y., Colby, J. D., & Mulcahy, K. A. (2002). An efficient method for mapping flood extent in a coastal floodplain using Landsat TM and DEM data. International Journal of Remote Sensing, 23(18), 3681–3696. doi: 10.1080/01431160110114484
- Wang, Y. (2004). Using Landsat 7 TM data acquired days after a flood event to delineate the maximum flood extent on a coastal floodplain. International Journal of Remote Sensing, 25(5), 959–974. doi: 10.1080/0143116031000150022
- Xu, H. (2006). Modification of Normalized Difference Water Index (NDWI) to enhance open water features in remotely sensed imagery. International Journal of Remote Sensing, 27(14), 3025–3033. doi: 10.1080/01431160600589179
- Yang, Y., Liu, Y., Zhou, M., Zhang, S., Zhan, W., Sun, C., & Duan, Y. (2015). Landsat 8 OLI image based terrestrial water extraction from heterogeneous backgrounds using a reflectance homogenization approach. Remote Sensing of Environment, 171, 14–32. doi: 10.1016/j.rse.2015.10.005
- Zhang, F., Tiyip, T., Kung, H., Johnson, V. C., Wang, J., & Nurmemet, I. (2016). Improved water extraction using Landsat TM/ETM+ images in Ebinur Lake, Xinjiang, China. Remote Sensing Applications: Society and Environment, 4, 109–118. doi: 10.1016/j.rsase.2016.08.001
- Zhu, Z., Wang, S., & Woodcock, C. E. (2015). Improvement and expansion of the Fmask algorithm: Cloud, cloud shadow, and snow detection for Landsat 4–7, 8, and Sentinel 2 images. Remote Sensing of Environment, 159, 269–277. http://gis2.rowater.ro doi: 10.1016/j.rse.2014.12.014