
 ?Mathematical formulae have been encoded as MathML and are displayed in this HTML version using MathJax in order to improve their display. Uncheck the box to turn MathJax off. This feature requires Javascript. Click on a formula to zoom.
ABSTRACT
The earth is continually bombarded by high-energy cosmic ray particles, and the worldwide average exposure to cosmic rays represents about 13% of the total annual effective dose received by the population. Therefore, assessment of cosmic ray exposure at the ground level is of great interest to better understand population exposure to ionizing radiation. This paper presents and describes the European Annual Cosmic-Ray Dose Map at 1 km resolution (Main Map). The Main Map displays the annual effective dose that a person may receive from cosmic rays at the ground level, which ranges from 301 to 3955 μSv. Moreover, thanks to the availability of population data, the annual cosmic-ray collective dose has been evaluated and population-weighted average annual effective dose (per capita) due to cosmic ray has been estimated for each European country considered in this study. The accuracy of the present study has been confirmed by comparing our results with those obtained using other models.
KEYWORDS:
1. Introduction
Natural ionizing radiation is considered the largest contributor to the collective effective dose received by the world population. The human population is continuously exposed to ionizing radiation from several natural sources that can be classified into two broad categories: high-energy cosmic rays incident on the earth's atmosphere and releasing secondary radiation (cosmic contribution); and radioactive nuclides that originated in the earth's crust and are present everywhere in the environment, including the human body itself. For most individuals, natural exposure exceeds that from all man-made sources combined. The worldwide average exposure to cosmic rays contributes to about 13% of the total annual effective dose received by the population (CitationUNSCEAR, 2008, Volume 1, Annex B, Figure 36).
The earth is continually bombarded by high-energy particles that originate in outer space. These cosmic rays interact with the nuclei of atmospheric constituents, producing a cascade of interactions and secondary reaction products that contribute to cosmic ray exposure that decreases in intensity with depth in the atmosphere, from the stratosphere to aircraft altitudes down to the ground level. The cosmic ray interactions also produce a number of radioactive nuclei known as cosmogenic radionuclides, e.g. 3H and 14C. The primary types of radiation that originate in outer space and impinge on the top of the earth's atmosphere consist of 87% protons, 11% α particles, about 1% nuclei of atomic number Z between 4 (beryllium) and 26 (iron), and about 1% electrons of very high energy (CitationEisenbud & Gesell, Citation1997, Chap. 6, p. 185). They originate outside the solar system and only a small fraction is normally of solar origin; however, the solar component becomes significant during solar flares, which follows an 11-year cycle (CitationEisenbud & Gesell, Citation1997). The interactions of the primary particles with atmospheric nuclei produce electrons, γ rays, neutrons and mesons (CitationGrieder, Citation2001). At the ground level, the dominant component of the cosmic ray field is muons with energy mostly between 1 and 20 GeV (CitationUNSCEAR, 2008, Volume 1, Annex B, p. 231). Only 0.05% of primary protons penetrate to the sea level (CitationEisenbud & Gesell, Citation1997, Chap. 6).
Cosmic particle flux increases with latitude and altitude, and it is significantly higher on board aircraft in flight than at the ground level. For radiation protection of aircrew and frequent flyers, it is important to assess exposure to cosmic radiation on board in an aircraft (CitationEuropean Commission, Citation1996, Citation2004; CitationICRP, Citation2016). According to the European Basic Safety Standards (BSS), exposure of aircrew to cosmic radiation should be managed as a planned exposure situation (CitationEuropean Commission, Citation2009; CitationEuropean Council, Citation1996, Citation2013, Art. 35.3). At the same time, assessment of cosmic ray exposure at the ground level is of great interest to better understand population exposure to ionizing radiation (CitationChen, Timmins, Verdecchia, & Sato, Citation2009; CitationPoje et al., Citation2012; CitationSato, 2016b). Several studies have been conducted to estimate and map outdoor gamma dose rate and their components using different geostatistic techniques (CitationBossew et al., Citation2017; CitationSzabó, Jordan, Petrik, Horvath, & Szabó, Citation2017; CitationYeşilkanat, Kobya, Taşkin, & Çevik, Citation2015).
In the present paper, the European Annual Cosmic-Ray Dose Map (Main Map) is presented and described. It has been developed by the Joint Research Centre of the European Commission. The map is part of the European Atlas of Natural Radiation (EANR), which will be a collection of maps displaying the levels of natural radioactivity caused by different sources (indoor and outdoor radon, cosmic radiation, terrestrial gamma radiation and radionuclides in soil and water) (CitationTollefsen, Cinelli, Bossew, Gruber, & De Cort, Citation2014). The overall goal of the Atlas is to estimate the annual dose that the public may receive from natural radioactivity, combining all the information from different maps. Thanks to the availability of these maps the public will have a tool to (a) familiarize themselves with natural environmental radioactivity, (b) be informed about the levels of natural radioactivity caused by different sources, (c) have a more balanced view of the annual dose and its variation received by the world population, to which the natural radioactivity is the largest contributor, and (d) make direct comparisons between doses from natural sources of ionizing radiation and those from man-made (artificial), hence to better understand the latter. The digital version is now available online at https://remon.jrc.ec.europa.eu/About/Atlas-of-Natural-Radiation.
The Main Map, European Annual Cosmic-Ray Dose Map (at 1 km resolution) displays the annual effective dose – on average over its temporal variability – that a person should receive from cosmic rays at the ground level, if she/he spends all the reference time at that elevation, considering a shielding factor of 0.8 and an indoor occupancy fraction of 0.8 (CitationUNSCEAR, 2000, Annex A). Our simple and easy approach to estimate the cosmic-ray dose, based only on elevation data, has been compared with more sophisticated models, such as EXPACS (CitationSato, 2016a) and CARI-6 (CitationO’Brien, Felsberger, & Kindl, Citation2005; CitationO’Brien, Friedberg, Sauer, & Smart, Citation1996), that consider the latitude and longitude dependences of the cosmic-ray doses, the water density in the ground (EXPACS) and the date (solar cycle variation).
Thanks to the availability of maps showing the distribution of the European population (CitationBatista e Silva, Gallego, & Lavalle, Citation2013; CitationBatista e Silva, Lavalle, & Koomen, Citation2013; CitationLavalle & Jacobs Crisioni, Citation2016), further analysis based on the use of population data is possible. In this paper, the annual cosmic-ray collective dose, i.e. the total dose incurred by a population, has been evaluated using population data available at the European level. The collective dose is the sum of all individual doses to members of the population. Therefore, the population-weighted average annual effective dose due to cosmic rays has been estimated for each European country in consideration as well as for all of them together (Main Map). The coverage of the European Annual Cosmic-Ray Dose Map is based on the availability of the population data (CitationBatista e Silva, Gallego, et al., 2013; CitationBatista e Silva, Lavalle, et al., 2013; CitationLavalle & Jacobs Crisioni, Citation2016).
The estimated population-weighted average annual effective dose due to cosmic rays for each European country considered here has been compared with those reported in CitationSato (2016b), based on different population data and methodologies.
2. Materials and methods
2.1. Dose calculation
Several software codes are available to calculate the cosmic-ray dose rates at aviation altitudes. A detailed overview is given in the EURADOS 2012–2013 report (CitationBottollier-Depois et al., Citation2012), and a comparison of codes assessing radiation exposure of aircraft crew can be found in the Radiation Protection 173 issue of the European Commission (CitationEuropean Commission, Citation2012). In general, given geographical information (latitude, longitude and altitude) and time (date), these codes are used to calculate the cosmic-ray dose rate. These codes are mostly used to assess radiation doses for aircrew members.
In the present paper, the cosmic-ray dose rate at the ground level for most European countries has been assessed with the same methods as those used by CitationUNSCEAR (2008, Volume 1, Annex B, Chap. 2). The photons and direct ionizing component of cosmic radiation are considered separately from the neutron ones. The dose rate value may be considered as averages over the 11-year solar cycle, with a total range of variation of about 10% (CitationUNSCEAR, 2000, Annex B, Chap. 1; CitationBouville & Lowder, Citation1988). The only spatial variation that was considered is the altitude effect and not the latitude. The altitude data used in the present work are described in Section 2.2.
2.2. Photons and direct ionizing component of cosmic radiation
To estimate the dose rates from photons and direct ionizing component of cosmic radiation at the ground level (at different altitudes), the following formula (CitationBouville & Lowder, Citation1988) was used:(1)
(1) where z is the altitude in km and
is the annual effective dose rate at sea level, 240 μSv. The latter has been estimated assuming a dose rate of 32 nGy h−1 at sea level (CitationUNSCEAR, 2000, Annex A), a value appropriate for the latitudes considered in the present work (between 30° N and 70° N). This value agrees with the 32.7 nGy h−1 reported in Wissmann, Dangendorf, and Schrewe (Citation2005), measured at latitude 52° 17′ N and longitude 10° 28′ E. Only altitude has been considered because at the ground level, doses from photons and the direct ionizing component of cosmic radiation depend strongly on altitude and weakly on latitude. The dose rate is about 10% lower at the geomagnetic equator than at high latitudes (CitationUNSCEAR, 2008, Annex B). The variation of the dose rate at the sea level over the years has been estimated to be around 10% (Wissmann, Citation2006).
A mean shielding factor of 0.8 and an indoor occupancy factor of 0.8 have been assumed (CitationUNSCEAR, 2000, Annex A).
2.3. Neutron component of cosmic radiation
To estimate the neutron component of cosmic radiation is more complicated. Both altitude and latitude variation should be taken into account because both strongly affect exposure rates. The approach described in CitationUNSCEAR (2000, Annex A, Chap. II) has been used. In the present work, a fixed latitude of 50° was considered, being an average value for Europe, our area of interest.
A neutron fluence rate of 0.013 cm−2 s−1 at the sea level has been assumed (CitationUNSCEAR, 2000, Annex A, p. 28), and its attenuation with altitude is described using the function (CitationUNSCEAR, 2000, Annex A, p. 28), where p is the atmospheric depth in g cm−2. The following relation between height, h, in km, above sea level and atmospheric depth p is used (CitationUNSCEAR, 2000, Annex A, p. 28):
(2)
(2)
A neutron fluence energy distribution weighting factor of 200 pSv cm2 (that is 720 nSv h−1 per neutron cm−2 s−1) has been applied (CitationUNSCEAR, 2000, Annex A, p. 28).
A shielding factor of 0.8 and an occupancy factor of 0.8 were assumed (CitationUNSCEAR, 2000, Annex A, p. 28).
2.4. Geographical information: altitude
In order to use altitude data for this work, a global digital elevation model (DEM), called the GTOPO30 data-set (https://lta.cr.usgs.gov/GTOPO30), was used. This data-set was derived from several raster and vector sources of topographic information and is a raster georeferenced TIFF with a horizontal grid spacing of 30 arc seconds (approximately 1 km).
With the aim to overlay the altitude data grid and the population data grid, described in the next section, and hence for proceeding with the calculation, it was necessary to transform the original DEM to Lambert azimuthal equal-area (LAEA) projection (http://spatialreference.org/ref/epsg/etrs89-etrs-laea/), and, then, to align the DEM grid with the population grid, the reprojected DEM was resampled using the specific ArcGIS® tool ‘resample’ (CitationESRI, Citation2011).
2.5. Population data
The European Population Map 2006 (CitationBatista e Silva, Gallego, et al., 2013; CitationBatista e Silva, Lavalle, et al., 2013; CitationLavalle & Jacobs Crisioni, Citation2016) created by the DG Joint Research Centre of the European Commission and by the Centro de Estudos de Geografia e Ordenamento do Território of Portugal was used as reference in this study. This database was chosen because it is the most recently updated and improved European population grid map; still for many countries in Europe, data are distributed at coarser geographical units like municipalities.
The data are organized in a digital raster grid that reports the number of residents (night-time population) in 100 m × 100 m cells. It has been produced by downscaling census population data, at the finest available resolution, to the 100 m grid cell level given pycnophylactic constraints (redistribution or ‘disaggregation’ of data given on input support like administrative polygons into grid cells, preserving total ‘volume’, i.e. number of population in this case). This downscaling is done by using data on land use (a refined version of the Corine land cover of 2006) and soil sealing. In addition, the final outcome of this cartographic exercise was validated against reference data.
In the present study, this level of resolution (100 m × 100 m cells) was reduced to 1 km × 1 km to compare it with the information included in the European Annual Cosmic-Ray Dose Map (Main Map) (1 km cells). This upscaling process was performed using the ‘aggregate’ tool in ArcGIS® (CitationESRI, Citation2011) so that the output cell contains the sum of the input cells (100 m × 100 m) enclosed by that cell.
3. Results and discussion
3.1. Cosmic-ray dose rate map
The effective dose due to cosmic radiation (photons, direct ionizing and neutron components) at the ground level has been calculated following the methodology and elevation data described in Sections 2.1 and 2.2, respectively. In turn, the annual cosmic-ray dose at the ground level has been calculated by summing the components. The Main Map displays the European annual cosmic-ray dose map at 1 km resolution. Each value displayed in the map reports the annual effective dose that a person may receive from cosmic rays at the ground level if she/he stays all the reference time with an occupancy factor of 0.8 at that altitude. Descriptive statistics of the Annual Cosmic-Ray Dose at 1 km resolution are reported in .
Table 1. Descriptive statistics of the Annual Cosmic-Ray Dose at 1 km resolution.
The spatial distribution of the cosmic-ray dose rate over Europe obviously reflects the elevation map. The map shows that for half of the considered territory, annual cosmic-ray dose is below 360 μSv and for less than 1% above 1000 μSv. The highest values are obtained in the highest places of Europe, such as the Alps, the Pyrenees and in eastern Turkey (with mountains above 3000 m), in the latter reaching the maximum value of 3955 μSv. Medium values, ranging between 400 and 900 μSv, are also well identified in relation with the natural elevation, for instance, in Spain with a medium height of 600 m or in the European Plain, which stretches 2000 km from the French Atlantic coast to the Ural Mountains. On the contrary, the minimum value of 301 μSv at the sea level coincides mainly with coastal locations. Exceptions are cliffs and mountains diving into the sea, as for example in Norway.
3.2. Comparison between models for estimating cosmic-ray dose rate
In this study, as explained in Section 2.1, the effective dose rate due to cosmic rays has been estimated considering representative–average–constant values for longitude, latitude, water density in the ground and solar cycle influence. Models more sophisticated such as EXPACS (CitationSato, 2016a) and CARI-6 (CitationO’Brien et al., Citation1996, Citation2005) take into account all these variables. So we carried out a comparative analysis to check how much the variation between our simple approach and these models is.
In the EXPACS model, we assumed: (a) a constant weight fraction of 20% for water in soil, (b) vertical cut-off rigidity (GV) between 0 and 10, according to the coverage of the European countries mapped in this study, and (c) as effective dose rates the average of the ones estimated for an arbitrary date, 15th March in the years between 2005 and 2016 (to consider the solar cycle influence).
and report the results of the comparison between the EXPACS model and the approach used in the present study. The values estimated in the present study seem to be fully in line with the EXPACS vertical cut-off rigidity of 5. It is consistent with the assumption made in the present study. The relative differences between the two approaches are increasing with altitude for all vertical cut-off rigidity values considered, except for a decrease around 500 m.
Figure 1. Effective dose rate (μSv/h) due to cosmic rays estimated using EXPACS model considering different vertical cut-off rigidity (GV) values and using the approach described in the present study as function of altitude (km).
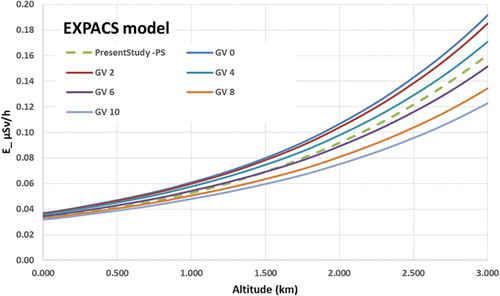
Figure 2. Relative differences between the effective dose rates due to cosmic rays estimated using EXPACS model considering different vertical cut-off rigidity (GV) values and using the approach described in the present study as function of altitude (km).
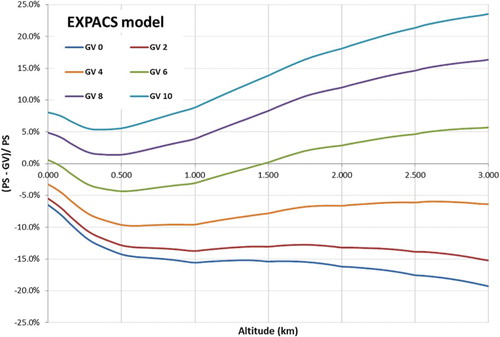
At the sea level, the differences range between −6.5% (GV0) and 8.1% (GV10), and at 1000 m between −15% (GV0) and 8.8% (GV10). Considering that the majority of the countries in Europe are located between GV2 and GV8, and the majority of the population lives at an altitude below 1000 m, the relative difference between the two models is below 13.7%.
For the CARI-6 model, we assumed (a) latitude and longitude values to have vertical cut-off rigidity (GV) between 0 and 10, according to the coverage of the European countries mapped in this study, and (b) as effective dose rates the average of the ones estimated considering in an arbitrary date, 15th March in the years between 2005 and 2016 (to consider the solar cycle influence).
and report the results of the comparison between the CARI-6 model and the approach used in the present study. The values estimated in the present study seem to be fully in line with the CARI-6 vertical cut-off rigidity of 0 and 2.
Figure 3. Effective dose rate (μSv/h) due to cosmic rays estimated using CARI-6 model considering different vertical cut-off rigidity (GV) values and using the approach described in the present study as function of altitude (km).
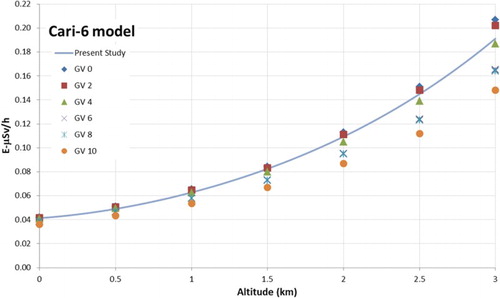
Figure 4. Relative differences between the effective dose rates due to cosmic rays estimated using CARI-6 model considering different vertical cut-off rigidity (GV) values and using the approach described in the present study as function of altitude (km).
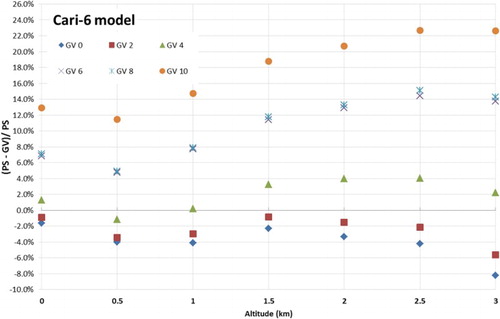
The relative differences between the two approaches are increasing with altitude for all vertical cut-off rigidity values considered, except for a decrease around 500 m, as in . At the sea level, the differences range between −1.6% (GV0) and 13% (GV10), and at 1000 m between −4.1% (GV0) and 15% (GV10). Considering that the majority of the countries in Europe are located between GV2 and GV8, and the majority of the population lives at an altitude below 1000 m, the relative difference between the two models is below 8%.
The results of the comparative analysis are satisfactory: the difference between our simple and the more sophisticated EXPACS and CARI-6 models are on the same magnitude of the variation due to other parameters (solar modulation, building shielding effects, ground condition, indoor occupancy, etc.). Thus, the simple method is adequate to use (as a first step) for the purposes of the EANR.
3.3. Population exposure
The collective dose for Europe has been estimated by taking the population data for 2006 described in Section 2.3 as a reference. The collective annual cosmic-ray dose has been calculated for each cell (1 km × 1 km) by multiplying the annual cosmic-ray dose value with the number of residents in that cell.
First, we explored how many people are exposed to a certain annual cosmic-ray dose that, of course, depends on the elevation at which they live. For this purpose, the relation between annual cosmic-ray dose and population at the cell level (1 km × 1 km) has been analysed. From (a), it can be noticed that the majority of cells present values below 400 μSv, which are the ones with the highest population values. Indeed, the few cells above 1000 μSv present the lowest population values.
Figure 5. (a) Population density (inhabitants per 1 km × 1 km cell) versus annual cosmic-ray dose (μSv). (b) Histogram reporting fraction of population in annual cosmic-ray dose classes of 25 μSv starting from 300 μSv.
This distribution of the results means that only a few per cent of the population live under the highest cosmic-ray dose rate (i.e. at the highest altitudes); no person should receive an annual cosmic-ray dose at the ground level above 1650 μSv (about 3270 m of altitude). At the ground level, only 0.02% of the population (138,025 inhabitants) may receive an annual dose due to cosmic rays higher than 1000 μSv (b). The majority of the population, about 65%, should receive values below 325 μSv (about 200 m.a.s.l) and 92% below 400 μSv (about 700 m.a.s.l).
The annual cosmic-ray collective dose over all the countries considered is approximately 0.2 million person-Sv. presents the countries in order of population size, with Germany (DE) being the most and Iceland (IS) the least populated. The annual cosmic-ray collective dose per country () follows more or less the population trend, except for Turkey (TR) that presents a collective dose higher than Germany, albeit with a lower population, because of the higher elevation average of the country.
Figure 6. Annual cosmic-ray collective effective dose (mSv*person) and the population-weighted average (per person) annual effective dose (annual dose per capita) due to cosmic rays for each country considered (the ISO country code is quoted for each country; see the supplementary material for the corresponding country name). The countries are in order of population size, from the highest, Germany, to the lowest, Iceland.
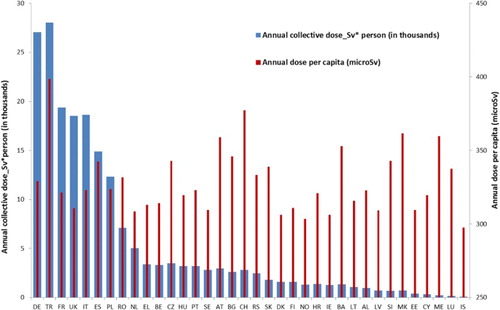
The population-weighted average (per capita) annual effective dose due to cosmic rays per country considered is also displayed in . The values range between 399 μSv (Turkey) and 298 μSv (Iceland) per capita. The average value for all the countries considered is 334 μSv per capita. Only Turkey presents a value above the global mean value of 390 μSv reported in CitationUNSCEAR (2008). (For further details on population statistics and estimated collective dose for 2006 per country, see the supplementary material.)
3.4. Comparison between models for estimating population exposure
The population-weighted average annual effective dose (per capita) due to cosmic rays for each country considered has been compared with the ones presented in CitationSato (2016b). In the Sato study (Citation2016b), the population-weighted average annual effective dose due to cosmic ray has been evaluated using (a) the PHITS-based Analytical Radiation Model in the Atmosphere – PARMA (CitationSato, Citation2015; CitationSato, Yasuda, Niita, Endo, & Sihver, 2008), (b) Gridded Population of the World version 3 (CitationGPWv3, Citation2005), and (c) global DEM GTOPO30 (https://lta.cr.usgs.gov/GTOPO30).
reports the relative differences between the population-weighted average annual effective doses (per capita) due to cosmic rays estimated in the two studies for each country considered. The relative differences between the two studies range from 0.02% to 14%, with an average of 3.7% considering all countries. The highest differences are found in the countries located at the lowest and highest latitudes (Cyprus (CY), Iceland (IS) and Norway (NO)), perhaps due to the fact that the present study considers only the altitude while CitationSato (2016b) considers also longitude and latitude.
Figure 7. Relative difference (in percentage) between the population-weighted average (per capita) annual cosmic-ray doses estimated in the present work and in CitationSato (2016b) for each country considered.
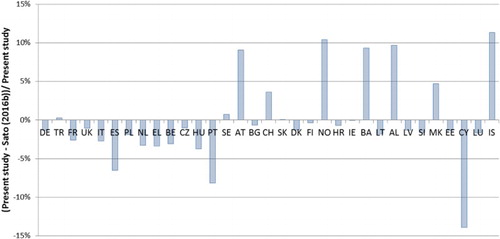
However, the comparison is satisfying, considering that in the two studies different models and different population data are used, and the differences are comparable with the variation due to solar cycle, measurements uncertainty and so on.
4. Conclusion
In the present work, the annual effective dose resulting from cosmic radiation (photons, direct ionizing and neutron components) at the ground level has been calculated following a simple methodology based only on elevation data. Hence, a European map of annual cosmic-ray dose with 1 km resolution has been developed. The spatial distribution of the cosmic-ray dose rate over Europe obviously reflects the elevation map. The map shows that for half of the considered territory, the annual cosmic-ray dose is below 360 μSv and for less than 1% above 1000 μSv. The highest values are obtained at the highest places of Europe, such as the Alps, the Pyrenees and eastern Turkey (with mountains above 3000 m), with the latter reaching the maximum value of 3955 μSv. On the contrary, the minimum value of 301 μSv at the sea level coincides mainly with coastal locations.
The map is part of the EANR, and it will be useful to estimate the annual dose that the public may receive from natural radioactivity. In fact, the main purpose of the Atlas is to inform and make the public more conscious about the levels of natural radioactivity.
Moreover, the availability of maps showing the distribution of the European population allowed us to estimate the annual cosmic-ray collective dose and the population-weighted average (per capita) annual cosmic-ray dose for the countries considered. The values range from 298 μSv (Iceland) to 399 μSv (Turkey) per capita. The average value for all the countries considered is 334 μSv per capita.
This work represents a starting point in the estimation of effective cosmic-ray dose in Europe even if further work could be done to improve the dose assessment, such as considering the latitude, the temporal variability and fluctuations of cosmic ray particles, using different occupancy factor if living in countryside or city, in South or North Europe.
The accuracy of the approach followed in the present study to estimate the annual effective dose map due to cosmic ray and the population exposure has been confirmed by the comparison with two more sophisticated models: EXPACS and CARI-6. The discrepancy between our results and the ones obtained with the two models is below 15%, values on the same order of magnitude of the uncertainties variation due to other parameters such as solar modulation, building shielding effects, ground condition and indoor occupancy. These are very satisfactory results for the easy and simple approach that we have used in this study performed for the EANR. It is an excellent compromise being the main purpose of the Atlas to inform the public, which might not seem extremely interesting in a pure scientific point of view.
Software
ArcGIS® Desktop version 10.0 software by CitationESRI (Citation2011), together with its ‘Spatial Analyst’ extension, was used for all GIS operations and for mapping. Microsoft Excel was used to make statistical analyses of the maps.
TJOM_1384934_Supplementary_Materials.zip
Download Zip (39.9 MB)Acknowledgements
The authors wish to warmly thank Dr Alessandra Bianchi for helping us in the cartographic aspects of map development. They also warmly thank Dr Frank Wissmann for his scientific support.
Disclosure statement
No potential conflict of interest was reported by the authors.
ORCID
Giorgia Cinelli http://orcid.org/0000-0001-6168-7764
Miguel Angel Hernandez-Ceballos http://orcid.org/0000-0001-7868-0833
Related Research Data
References
- Batista e Silva, F., Gallego, J., & Lavalle, C. (2013). A high-resolution population grid map for Europe. Journal of Maps, 9(1), 16–28. doi: 10.1080/17445647.2013.764830
- Batista e Silva, F., Lavalle, C., & Koomen, E. (2013). A procedure to obtain a refined European land use/cover map. Journal of Land Use Science, 8(3), 255–283. doi: 10.1080/1747423X.2012.667450
- Bossew, P., Cinelli, G., Hernández-Ceballos, M., Cernohlawek, N., Gruber, V., Dehandschutter, B., … De Cort, M. (2017). Estimating the terrestrial gamma dose rate by decomposition of the ambient dose equivalent rate. Journal of Environmental Radioactivity, 166(Part 2), 296–308. doi: 10.1016/j.jenvrad.2016.02.013
- Bottollier-Depois, J. F., Beck, P., Latocha, M., Mares, V., Matthiä, D., Rühm, W., & Wissmann, F. (2012). Comparison of codes assessing radiation exposure of aircraft crew due to galactic cosmic radiation. EURADOS Report 2012-03, EURADOS e.V., Braunschweig, Retrieved from www.eurados.org, ISBN 978-3-943701-02-9.
- Bouville, A., & Lowder, W. M. (1988). Human population exposure to cosmic radiation. Radiation Protection Dosimetry, 24(1), 293–299. doi: 10.1093/oxfordjournals.rpd.a080290
- Chen, J., Timmins, R., Verdecchia, K., & Sato, T. (2009). An estimation of Canadian population exposure to cosmic rays. Radiation and Environmental Biophysics, 48, 317–322. doi: 10.1007/s00411-009-0226-z
- Eisenbud, M., & Gesell, T. (1997). Chapter 6: Natural radioactivity. In M. Eisenbud, & T. Gesell (Eds.), Environmental radioactivity (pp. 134–200). London: Academic Press.
- ESRI. (2011). ArcGIS Desktop: Release 10. Redlands, CA: Environmental Systems Research Institute. Retrieved from www.esri.com
- European Commission. (1996). Exposure of air crew to cosmic radiation, Radiation Protection 85, European Commission, Luxembourg, 1996. ISBN 92-827-7994-7.
- European Commission. (2004). Radiation Protection 140: Cosmic radiation exposure of aircraft crew – Compilation of measured and calculated data. Luxembourg: Directorate-General for Energy and Transport of the European Commission. ISBN 92-894-8448-9.
- European Commission. (2009). Radiation Protection 156: Evaluation of the implementation of radiation protection measures for aircrew. Luxembourg: Directorate-General for Energy and Transport of the European Commission. ISBN 978-92-79-08409-6.
- European Commission. (2012). Radiation Protection 173: Comparison of codes assessing radiation exposure of aircraft crew due to galactic cosmic radiation. Luxembourg: Directorate-General for Energy and Transport of the European Commission. ISBN 978-92-79-27036-9.
- European Council. (1996). Directive 96/29/Euratom of 13 May 1996 laying down basic safety standards for the protection of the health of workers and the general public against the dangers arising from ionizing radiation. Official Journal L 159, 29/06/1996 P. 0001–0114.
- European Council. (2013). Council Directive 2013/59/Euratom of 5 December 2013 laying down Basic Safety Standards for Protection against the Dangers Arising from Exposure to Ionising Radiation. Official Journal L13 of 17/01/2014 European Commission, Brussels. Retrieved from http://eur-lex.europa.eu/legal-content/EN/TXT/PDF/?uri=CELEX:32013L0059&from=en
- GPWv3. (2005). Gridded population of the world, version 3 (GPWv3) Data Collection. SIESIN, Columbia University, Palisades, NY.
- Grieder, P. (2001). Cosmic rays at earth (1112 pp.). Amsterdam: Elsevier Science. ISBN 97-804-4450-7105.
- ICRP. (2016). Radiological protection from cosmic radiation in aviation. ICRP Publication 132. Annals of the ICRP, 45(1), 1–48.
- Lavalle, C., & Jacobs Crisioni, C. (2016). INPUT – European Population Map 2006. European Commission, Joint Research Centre (JRC) [Dataset]. Retrieved from http://data.europa.eu/89h/jrc-luisa-europopmap06
- O’Brien, K., Felsberger, E., & Kindl, P. (2005). Application of the heliocentric potential to aircraft dosimetry. Radiation Protection Dosimetry, 116, 336–342. doi: 10.1093/rpd/nci090
- O’Brien, K., Friedberg, W., Sauer, H. H., & Smart, D. F. (1996). Atmospheric cosmic rays and solar energetic particles at aircraft altitudes. Environment International, 22(Suppl 1), 9–44. doi: 10.1016/S0160-4120(96)00086-4
- Poje, M., Vuković, B., Radolić, V., Miklavčić, I., Faj, D., Varga Pajtler, M., & Planinić, J. (2012). Mapping of cosmic radiation dose in Croatia. Journal of Environmental Radioactivity, 103, 30–33. doi: 10.1016/j.jenvrad.2011.08.016
- Sato, T. (2015). Analytical model for estimating terrestrial cosmic ray fluxes nearly anytime and anywhere in the world: Extension of PARMA/EXPACS. PLoS One, 10, e0144679. doi: 10.1371/journal.pone.0144679
- Sato, T. (2016a). Analytical model for estimating the zenith angle dependence of terrestrial cosmic ray fluxes. PLoS ONE, 11(8), e0160390. doi: 10.1371/journal.pone.0160390
- Sato, T. (2016b). Evaluation of world population-weighted effective dose due to cosmic ray exposure. Scientific Reports, 6, Article number: 33932. doi: 10.1038/srep33932
- Sato, T., Yasuda, H., Niita, K., Endo, A., & Sihver, L. (2008). Development of PARMA: PHITS-based analytical radiation model in the atmosphere. Radiation Research, 170, 244–259. doi: 10.1667/RR1094.1
- Szabó, K. Z., Jordan, G., Petrik, A., Horvath, A., & Szabó, C. (2017). Spatial analysis of ambient gamma dose equivalent rate data by means of digital image processing techniques. Journal of Environmental Radioactivity, 166, 309–320. doi: 10.1016/j.jenvrad.2016.07.013
- Tollefsen, T., Cinelli, G., Bossew, P., Gruber, V., & De Cort, M. (2014). From the European indoor radon map towards an atlas of natural radiation. Radiation Protection Dosimetry, 162(1–2), 129–134. doi: 10.1093/rpd/ncu244
- United Nations Scientific Committee on the effects of Atomic Radiation (UNSCEAR). (2000). Sources and effects of ionizing radiation (Report to general assembly, Annex A and B). New York, NY: United Nations.
- United Nations Scientific Committee on the effects of Atomic Radiation (UNSCEAR). (2008). Sources and effects of ionizing radiation (Report to General Assembly, Annex B). New York, NY: United Nations.
- Wissmann, F., Dangendorf, V., & Schrewe, U. (2005). Radiation exposure at ground level by secondary cosmic radiation. Radiation Measurements, 39, 95–104. doi: 10.1016/j.radmeas.2004.03.025
- Wissmann, F. (2006). Variations observed in environmental radiation at ground level. Radiation Protection Dosimetry, 118(1), 3–10. doi: 10.1093/rpd/nci317
- Yeşilkanat, C. M., Kobya, Y., Taşkin, H., & Çevik, U. (2015). Dose rate estimates and spatial interpolation maps of outdoor gamma dose rate with geostatistical methods: A case study from Artvin, Turkey. Journal of Environmental Radioactivity, 150, 132–144. doi: 10.1016/j.jenvrad.2015.08.011