
ABSTRACT
Compared to common data presentation methods such as tables and diagrams, thematic maps have the advantage of directly presenting complex, multidimensional spatial data. In this study, over 500 thematic maps are planned that present pesticide residue data from the inspection of fruit and vegetable samples. The data contain information on the samples, pesticides, sampling locations, maximum residue limits and inspection. Different calculation strategies are used to transform the original data into highly integrated data for cartography based on the demand investigation. During the map design process, standardized design should be used to ensure rigorous and consistent display of cartographic symbols. Two of the maps are used as examples to explain the data processing and map design procedures. The process can be used on all maps in this study and on more complex data.
1. Introduction
Presenting information with thematic maps is a common visualization method. Compared to tables and diagrams, thematic maps emphasize the spatial distribution and can be helpful when mining information during spatial analysis. As a result, it is worthwhile to transform data from natural (CitationAndrea, Pierluigi, Claudia, & Ivano, 2013) or social (CitationBeconytė, Ročiūtė, Adomaitytė, Baikauskas, & Ranonis, 2011) sciences into thematic maps and to perform analyses with maps.
Agricultural maps are good examples of thematic map visualization. Cartographers and researchers often focus on the relationship between agricultural activities and environmental elements, such as climate (CitationAndrea et al., 2013), landscape (CitationKong, Liu, Liu, Chen, & Liu, 2014; CitationMiklin & Hradecky, 2016) and soil (CitationCoscarelli, Caloiero, Minervino, & Sorriso-Valvo, 2016). Many papers discuss these subjects in academic journals. Unfortunately, although the thematic maps of agri-products that are sold in markets are related to food safety and interest the public, they do not receive much attention from cartographers and researchers. It is probably because the release of information about agri-products is extremely cautious. Therefore, a series of thematic map visualization strategies needs to be created. These maps are needed to show the situation of pesticide residues on agri-products simply and directly and avoid any possible confusion of readers.
This paper discusses the progress of transforming original pesticide inspection data into thematic maps and organizing these maps to create an atlas. Data are converted to thematic maps of different subjects during this progress. These maps must not only focus on the spatial distribution of the data but also be beautiful enough to fit the publishing and printing requirements. Therefore, the most important parts of thematic map creation, the acquisition of cartographic data and the design of a standardized map language, will be discussed in detail below.
2. Goals
The main purposes of this study are to discuss how to address pesticide residue data and present these data in thematic maps (as an atlas or a geographic information system website). These maps can show the food safety condition of each region directly and simply. The visualization process with thematic maps is worth researching because it is a new form of officially presenting the report on pesticide residues on fruit and vegetable samples sold while the report itself does not contain any maps and presents the inspection data using only tables and diagrams.
Thematic maps are designed for three groups of people:
Governmental agencies: The maps are designed to allow governmental agencies (especially the quality control authorities) to grasp the food safety situation rapidly and accurately and carry out more targeted supervision.
Customers: Customers often pay more attention to the safety of certain types of food. This kind of information, which can guide the public to safe shopping, is very necessary.
Researchers: For researchers, food safety standards can be compared and analysed among different countries and regions, which is conducive to identifying the weak links in food safety regulation in these countries and can, therefore, provide inputs for standard development and updating.
The pesticide inspection data from 42 prefecture-level cities in China and the Chinese, European Union (EU) and Japanese MRLs (Maximum Residue Limits, the standard for pesticide residues) are collected in this study and used for the design of thematic maps. Maps were made for each prefecture-level city for three subjects: sampling, pesticides detected and differences among the standards. Since there are 12 maps for each prefecture-level city and over 500 maps total in the atlas, only 2 of the maps are provided as examples to show the map design process.
3. Source data and main steps
3.1 Inspection data
The inspection data contain pesticide residue information that is often provided in a yearly report of pesticide residues in food, such as the data from the United States (CitationU.S. Food and Drug Administration, 2016), the European Union (CitationEuropean Food Safety Authority, 2017), and the United Kingdom (CitationDepartment for Environment, Food & Rural Affairs, Health and Safety Executive, 2015). In China, pesticide residue information in fruits and vegetables that are sold has been collected from more than 1000 markets throughout the country since 2013. This data, however, is covert and currently protected from public viewing. Therefore, we adopted simulated data in this study to illustrate the map visualization design, and the data can be replaced by the real data when necessary. In the Chinese inspection data, liquid chromatography – quadrupole rod – time-of-flight mass spectrometry (LC-Q-TOF) and gas chromatography – quadrupole rod – time-of-flight mass spectrometry (GC-Q-TOF) were used to detect 510 frequently used pesticides in the samples purchased from 42 cities within 31 provincial administrative regions. The ‘LC-Q-TOF’ and ‘GC-Q-TOF’ are two of the most recent kinds of high precision methods for pesticide inspection that have been officially utilized by the Chinese government (CitationPang, Fan, Kang, & Chang, 2016; CitationPang, Fan, Li, & Hu, 2016; CitationPang, Fan, Li, & Chang, 2016).
The forms of inspection data from different countries are very similar. There are usually four categories of original data: the sampling location (or location of origin), sample, pesticide and pesticide residue data. In addition, the standards called maximum residue limits (MRLs) are necessary to collect.
The five categories of data often contain specific information:
Sample: names of all samples and their categories.
Pesticide: names of all identified pesticides, their CAS Rn (Chemical Abstracts Service Registry Number, a unique number assigned to each chemical substance.), category, toxicity, metabolites and former metabolites, and access status in China.
Sampling location (or origin): the provincial, local and county-level administrative identity of the sampling location (or origin) and a detailed address. The information on producing location, batch and time is not included in the current inspection data, but it will be added in the next step of the study.
Inspection standards (MRLs): sample name, pesticide name, maximum residue limit and the name of the country where the standard was developed (China, the EU and Japan). The Chinese MRLs (GB2763-2016) are developed by the Ministry of Health and Ministry of Agriculture, while the MRLs of the EU are developed by the European Food Safety Authority, and those of Japan are developed by the Ministry of Health, Labour and Welfare. In addition, the Codex Committee on Pesticide Residues (CCPR) is an institution attached to the Codex Alimentarius Commission (CAC) that is responsible for establishing and revising the maximum residue limits for pesticides in agricultural products throughout the world (CitationSong et al., 2009).
Pesticide residue data: sample number and name, name and administrative identity of the sampling location, type of sample, inspection methodology, and type and amount of residue. Each dataset (detecting record) covers only one type of pesticide residue in one sample. In the case of multiple residues in one sample, multiple datasets were generated. If no residue was detected in the sample, ‘not detected’ was shown in the data.
shows the conceptual model according to the original data described above. This model is important for establishing the database for the thematic maps website. There are several variables under each dimension. The variables with an asterisk (*) are the main linkages that represent the index of the dimension, while the variables in grey are not included in this study due to data availability issues. They should be included when the data become available in the future.
Figure 1. Conceptual model of pesticide inspection data (variables with * are main linkages, and the grey variables are not currently included in this study).
Unfortunately, due to some issues, simulated data that have the same form of the Chinese inspection data will be used in this paper. The numbers of sampling markets and samples of each provincial administrative region from the simulated data are shown in a map of China (on the Main Map).
3.2 Main stages
From the original pesticide inspection data to the final thematic map, four stages are necessary for cartographers: a demand investigation, data processing and transformation, the standard design of map language, and integrated map design. The progress of converting pesticide inspection data into thematic maps is shown in . Detailed introductions of the stages involved are discussed below.
Demand investigation
Figure 2. The main progress of converting pesticide inspection data to thematic maps.
In this stage, the structure and contents of the atlas are determined. We consider the needs of customers, government officials and researchers, and find that three pieces of information are required: sampling situation, pesticides detected, and the differences among the inspection results when compared to MRLs of different countries (regions). In that case, a group of 12 maps and 13 diagrams can be made based on the data from each cartographic region (such as the whole country, provinces or prefecture-level cities). Therefore, the content of the thematic maps can be presented as shown in .
Figure 3. The content of the thematic maps.
Out of the 12 maps of each region, 5 maps are used to describe the general situation of pesticide residues: the map of vegetables and fruits inspections, the map of the quantities of pesticide types detected, the map of the types and categories of detected pesticides, the map of residual pesticide levels, and the map of the toxicities of the pesticides detected.
(2) Data processing and transformation
Data analysis refers to the process of transforming the source data to cartographic data. When processing data, we classify the data by function and adopt different calculation strategies to acquire highly integrated data, which are then further screened to develop specific data for cartography. Decisions are made on which data need standardized design and on how to standardize the data based on the processed data. Finally, integrated design is conducted based on the cartographic data and standards.
In this study, thematic cartography mainly falls under the category of statistical cartography, and common statistics include counting, classification, grading, summation, expectation and percentage. Different statistics describe a phenomenon from different perspectives and to a different extent. Data features and cartographic goals need to be incorporated when translating original data into cartographic data for map design and development. Multiple statistical methodologies are integrated into the calculation to make sure the final data are highly integrated.
For example, to determine the share of pesticide types detected in the samples in city A, the samples are first divided into five groups: samples with no pesticide detected (no pesticide residue or residues not reaching the sensitivity of the apparatus), samples with 1 pesticide, 2–5 pesticides, 6–10 pesticides and over 10 pesticides detected. After that, the number of samples in each group is counted and the percentage of the samples in the total volume of each group is calculated.
In another example, the percentages of pesticide types are calculated: first, the types of pesticides detected are counted by the CAS Rn, then the types of each pesticide category (such as herbicides, insecticides, bactericides and so on) are counted, and finally, the percentage of the types in each pesticide category is calculated.
In the map of pesticide residues, the records of pesticide residues detected are divided into six groups: records of residues over 1000 micrograms (μg), 100–1000 μg, 10–100 μg, 5–10 μg, 1–5 μg and less than 1 μg. Then, the number of records in each group is counted, and the percentage of the records in the total volume of each group is calculated.
In the three examples above, various statistical methodologies, such as counting, grading, summation and percentage, were applied to describe the characteristics of each dataset within an administrative region. The results allow readers to have a clear idea of the varieties or types of pesticides used in the samples in a certain area.
(3) Standardized design of map language
The development of a series of thematic maps requires rigour and consistency. Therefore, the design of map elements needs to be subject to overall quality control. The symbols and annotations in maps constitute the map language system, which can be divided into three types based on presentation: graphic language, colour language and annotation language (LING Shanjin, 2012). The annotation language is relatively easy to understand and master, while the other two languages face complex issues associated with the coordination and standardization of visualization design. The screened cartographic data can be analysed to identify the features of the elements for standardization to conduct a targeted standardization design. The standardization design is the most important step of the cartographic progress because it is directly related to the unification of style and the symbol system of the maps. The key point of the standardized design is to create the symbols following both aesthetic theory and map language system theory. Therefore, the standardized design will be discussed in the next section.
(4) Integrated design
There two missions in the integrated design stage. First, the elements that do not need standardization design are created, such as the statistical diagrams and the hierarchical background colours of the regions. The second mission is the layout design, which is necessary for atlas design.
4. Standardized design
4.1 Standardization of graphic language
The graphic language includes the variables shape, direction and arrangement of cartographic elements. The following elements require consistent graphic design based on the review of the selected cartographic data to further develop cartographic standards:
Geographic base map of different regions: Different thematic maps of the same city should adopt the same base map so readers can make comparisons across different thematic elements.
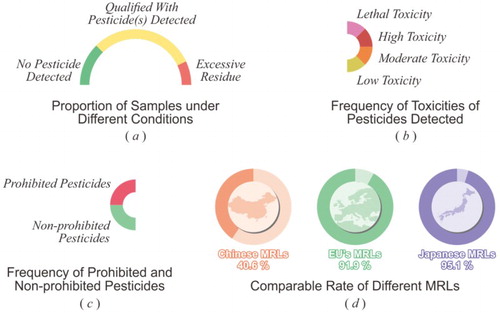
Ranking of elements based on certain logic: For example, the sequence of pesticide detections in the results should be ‘no pesticide detected’, ‘qualified with pesticide detected’ and ‘excessive’ ((a)). For pesticide toxicity, the sequence should be ‘low toxicity’, ‘moderate toxicity’, ‘high toxicity’ and ‘lethal toxicity’ ((b)), and for pesticide prohibition, it should be ‘prohibited’ and ‘non-prohibited’ ((c)). Regarding pesticide categorization, the sequence should be ‘insecticide’, ‘bactericide’, ‘herbicide’, ‘insect repellent’, ‘plant growth regulator’ and ‘synergist’. For national standards, the sequence should be ‘Chinese MRLs’, ‘Japanese MRLs’ and ‘the EU’s MRLs’ ((d)).
A thematic cartographic symbol with infrequent appearance on the maps but a strong impression on readers: For example, the symbols for sampling locations in the sample distribution map, which is the first map of one city and the only map in which the symbols appear.
A thematic cartographic element in the same spot across different maps: For example, the symbols for the samples in a county/district with excessive pesticide residue(s) on a distribution map must be consistent across different cities (Please see Section 5.1).
Figure 4. Standardization design of map language.
4.2 Standardization of colour language
The colours used in thematic maps are different from those used in normal figures, as the former usually carry unique messages, such as number and property. For example, background colours can indicate level and quality. Therefore, the colour language is a crucial part of the thematic map language system.
From an artistic perspective, thematic colours should be designed as aesthetically appealing as possible. However, when designing thematic maps, one should adopt consistency and standardization in regard to the colour of key thematic symbols, not only to effectively convey messages but also to increase the consistency of the atlas.
The colouring of thematic symbols usually conforms to certain industry standards or the perception and symbolism of some colours. Colour perception refers to the association of colours to details and emotions of real life. For example, red is associated with blood and the sun, green is associated with leaves and forests, while blue is associated with the sky and ocean. Perception can further lead to symbolism. For example, red is the colour of blood, which can mean danger and prohibition. Yellow is the colour of warning in nature, and it can lead to a perception of warning. Green is the colour of a leaf and can be associated with peace and safety because the olive branch represents world peace in the Bible.
The thematic maps in this paper are based on the above definitions when choosing colours for the symbols, and cartographic standards are developed accordingly, as follows.
Symbol colours for samples with ‘no pesticide detected’, ‘qualified with pesticide detected’ and ‘excessive’: Based on the perception and symbolism of colours, green, the colour of safety, was chosen to indicate ‘no pesticide detected’. Yellow, the colour of warning was chosen to indicate ‘qualified with pesticide detected’, while red, the colour of danger was chosen to indicate ‘excessive’ ((a)).
Symbol colours for ‘low toxicity’, ‘moderate toxicity’, ‘high toxicity’ and ‘lethal toxicity’: Pesticide toxicity is classified based on the lethal dose for humans, the lower the dose, the higher the toxicity. This is an ordinal scale. The same hue with different saturation levels should be used to differentiate the colours. However, more accentuated hues should be used for differentiation, as food safety is of key importance. As pesticide toxicity cannot be indicated by green, the colour of safety, the colours for ‘low toxicity’, ‘moderate toxicity’ and ‘high toxicity’ are yellow, orange (in between yellow and red) and red, respectively, and ‘lethal toxicity’ is indicated by purple, the colour of toxicity ((b)).
Symbol colours for ‘non-prohibited’ and ‘prohibited’: Pesticides are classified into these categories according to the local laws and regulations. Based on commonly accepted colour symbolism, ‘non-prohibited’ is indicated by green, while ‘prohibited’ is indicated by red ((c)).
Colours for countries and regions: Various colours are needed to compare different countries/regions and to differentiate pesticide residue standards. In this paper, the colours for ‘Chinese MRLs’, ‘Japanese MRLs’ and ‘the EU’s MRLs’ are red, blue and green, respectively, because red symbolizes success in China, Japan is an island country, and the EU is characterized by high-forest coverage ((d)).
5. Sample design
5.1 Sample map design targeting graphic language standardization
This section is based on the group of maps, Fruit and Vegetable Samples with Excessive Pesticide Residue(s) Under Different MRLs in Zhengzhou (on the Main Map).
First, samples from various counties and districts of Zhengzhou are counted. Then, the records of pesticides detected in all the samples are compared against the Chinese, Japanese and the EU standards, so that the lists of the samples that do not meet the different standards can be defined.
Second, the samples are counted to derive the number of samples with excessive pesticide residue(s) from various counties and districts and to derive the passing percentage of the samples under different standards. The data above are regarded as the processed cartographic data.
Symbols are used to represent the types of samples. The passing percentages are shown in hierarchical background colours. Hierarchical background colouring is outside the scope of standardized map design; therefore, the details on this design method are omitted here. Symbols for sample types should be common across the country, thus requiring standardized design.
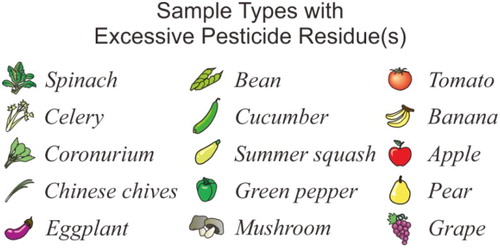
Compared to geometric symbols, pictograph symbols for different categories are much easier to understand in maps. Fifteen types of samples with excessive pesticide residue(s) that come from Zhengzhou were drawn into pictograph symbols, as shown in .
Figure 5. Design of symbols for sample types.
The standardized design of these maps has been completed by this point.
The hierarchical background colours in the maps are determined by the level of ‘Passing Percentage’ in every administrative region. The passing percentage is equal to the number of samples without excessive pesticide residue(s) divided by the total number of samples in a region. Therefore, the ‘passing percentage’ values in different regions may belong to the same level even if the numbers of samples without excessive pesticide residue(s) and the total numbers of samples are not the same. In the design of background colours, colours close to red mean low pass rate and those close to green mean high pass rate.
After standardized design and integrated design, the final maps of samples with excessive pesticide residue(s) under different MRLs are completed. Since different countries or regions have various dietary habits, the MRLs in the sample products among different countries may be not same. The purpose of this figure is to objectively show the differences among the standards of countries and not judge whether the MRLs of a region are ‘good’ or ‘not good’.
5.2 Sample map design targeting colour language standardization
This section takes the map Toxicities of Pesticides Detected in Hohhot (on the Main Map) as the reference for standardized colour design.
The processed cartographic data suitable for this map are the total number of times pesticides were detected in the samples from counties and districts, and the detection frequencies of low, moderate, high, lethal toxicity, non-prohibited and prohibited pesticides.
The data above are presented in the following way. The symbols and colours are used in the statistical chart to represent the detection frequency of low toxicity, moderate toxicity, high toxicity and lethal toxicity pesticides and the detected frequency of prohibited pesticides and non-prohibited pesticides. The height of the chart indicates the total number of times pesticides were detected in a county or district. The percentages of samples with lethal or highly toxic pesticides are used for hierarchical background colours.
The graphic symbols and colour designs are presented in (b) and (c) based on the description in Section 4.2. The two figures are arranged in parallel to integrate into a complete statistical graph.
6. Conclusions
This paper studies the visualization process used for thematic maps of pesticide residue data from fruit and vegetable samples. First, a conceptual model of the original inspection data is established, and the content of the thematic maps is created according to the demand investigation. Then, the cartographic data are obtained after integrated computing and processing. Afterwards, standardized and integrated design is conducted to eventually create hundreds of thematic maps. The cartographic progress attempts to use thematic map visualization to present large datasets, such as the pesticide inspecting data in this paper. The final thematic maps directly show the data, emphasizing the spatial distribution of data, exploring the pattern of pesticide residue distribution and greatly improving the efficiency of communicating information. In addition, the standardized design of thematic maps is explored in this paper, and it is subject to improvement to expand the application.
Thematic maps of pesticide residues on fruits and vegetables sold in China (physical and digital maps) are one visualization result of pesticide residue inspection data. These maps can directly reflect the food safety of fruits and vegetables sold in cities and assist government authorities in regulating and guiding consumption. Due to data availability issues, the maps in this paper are made using simulated data. In addition, the origin information and time information (inspection batch and date) are not included in this study. If more data are acquired, the methodology will be expanded, and the design will be normalized and become a cyclical exercise, making it more practical and useful.
Software
Microsoft Excel was used for data processing, and CorelDraw X6 was used for cartography and symbol design in this study.
Visualization_of_Pesticide_Residue_Data_-_The_Map.pdf
Download PDF (1.8 MB)Acknowledgements
The pesticide inspection team from Chinese Academy of Inspection and Quarantine
LIU Sha (translation work)
Disclosure statement
No potential conflict of interest was reported by the authors.
Related Research Data
References
- Andrea, C., Pierluigi, B., Claudia, S., & Ivano, R. (2013). Relationships between geo-hydrological processes induced by heavy rainfall and landuse: The case of 25 October 2011 in the Vernazza catchment (Cinque Terre, NW Italy). Journal of Maps, 9(2), 289–298. doi: 10.1080/17445647.2013.780188
- Beconytė, G., Ročiūtė, I., Adomaitytė, A., Baikauskas, M., & Ranonis, A. (2011). A map of 21st century conflicts in Europe. Journal of Maps, 7(1), 1–8. doi: 10.4113/jom.2011.1166
- Coscarelli, R., Caloiero, T., Minervino, I., & Sorriso-Valvo, M. (2016). Sensitivity to desertification of a high productivity area in Southern Italy. Journal of Maps, 12(3), 573–581. doi: 10.1080/17445647.2015.1054904
- Department for Environment, Food & Rural Affairs, Health and Safety Executive. (2015). Pesticide residues in food: Results of monitoring programme. Retrieved from https://www.gov.uk/government/collections/pesticide-residues-in-food-results-of-monitoring-programme
- European Food Safety Authority. (2017). The 2015 European Union report on pesticide residues in food. EFSA Journal, 15(4), 1–134. doi: 10.2903/j.efsa.2017.4791
- Kong, X., Liu, Y., Liu, X., Chen, Y., & Liu, D. (2014). Thematic maps for land consolidation planning in Hubei Province, China. Journal of Maps, 10(1), 26–34. doi: 10.1080/17445647.2013.847388
- Miklin, J., & Hradecky, J. (2016). Confluence of the Morava and Dyje Rivers: A century of landscape changes in maps. Journal of Maps, 12(4), 630–638. doi: 10.1080/17445647.2015.1068714
- Pang, G., Fan, C., Kang, J., & Chang, Q. (2016). LC-Q-TOF/MS detection technology for 544 pesticide residues in stem vegetables: CN 105675738 A[P].
- Pang, G., Fan, C., Li, X., & Hu, X. (2016). GC-Q-TOF/MS detection technology for 708 pesticide residues in stem vegetables: CN 105510502 A[P].
- Pang, G., Fan, C., Li, Y., & Chang, Q. (2016). GC-Q-TOF/MS detection technology for 708 pesticide residues in leaf vegetables: CN 105628839 A[P].
- Song, W.-C., Shan, W.-L., Ye, J.-M., Li, Z.-A., Zhou, Z.-Q., & Pan, C.-P. (2009). Present situation and development trend of MRLs for pesticides in and outside China. Chinese Journal of Pesticide Science, 11(4), 414–420. doi: 10.3969/j.issn.1008-7303.2009.04.03
- U.S. Food and Drug Administration. (2016). Pesticide residue monitoring program fiscal year 2014 pesticide report. Retrieved from https://www.fda.gov/food/foodborneillnesscontaminants/pesticides/default.htm