
ABSTRACT
The Worldwide Bioclimatic Classification System according to Rivas-Martínez (WBCS) is a bioclimatic classification that is widely used in vegetation science, geobotany, and landscape ecology. To date, only one complete WBCS map has been produced for Italy at the national scale. Here, we define two major updates to the WBCS map of Italy: improvements to the surface spatial accuracy for the climate, especially for precipitation; and detailed mapping of the Submediterraneity Index and its levels, which mainly characterize the ecotone area between the Mediterranean and the Temperate macrobioclimates. Finally, all WBCS units (i.e. macrobioclimates, bioclimatic variants, bioclimates, continentality types, bioclimatic belts) and the Submediterraneity Index are mapped on a scale of 1:2,500,000. These maps and the bioclimatic indices and monthly climatic surfaces are available here as raster data-sets (resolution, 900 m) and are useful for accurate bioclimatic diagnosis for the entire Italian territory. They will also support vegetation–environment relationship analysis, ecological modeling, and applied studies of climate change at the national scale.
1. Introduction
The Worldwide Bioclimatic Classification System according to Rivas-Martínez (WBCS; CitationRivas-Martínez, Citation1993) is a bioclimatic classification system that is widely used in vegetation sciences, especially in geobotany and landscape ecology. The WBCS has been repeatedly redefined and updated (CitationRivas-Martínez, Citation1993, Citation Citation2004, Citation2008; CitationRivas-Martínez, Sáenz, & Penas, Citation2011) to improve the correspondence between the main climatic factors, expressed as bioclimatic parameters and indices, and the distribution patterns of the vegetation at different spatial scales. It consists of the following bioclimatic units (in top-down hierarchical order): macrobioclimate, bioclimatic variant, bioclimate, and bioclimatic belt, as defined by the combination of Thermotype and Ombrotype. At a global scale, the WBCS recognizes 5 macrobioclimates (i.e. Polar, Boreal, Temperate, Mediterranean, and Tropical), 8 bioclimatic variants (CitationRivas-Martínez, Penas, Del Rio, Rivas Sáenz, & García-Sancho, Citation2015), and 28 bioclimates. At a local scale, the bioclimatic belts classify the variations within bioclimates, in terms of temperature and precipitation.
Italy covers two macrobioclimates (i.e. Mediterranean and Temperate), four bioclimates, and two bioclimatic variants (Submediterranean and Steppic) (e.g. CitationBiondi & Baldoni, Citation1993, Citation1995; CitationBlasi & Michetti, Citation2005; CitationPesaresi, Galdenzi, Biondi, & Casavecchia, Citation2014). The Mediterranean macrobioclimate is characterized by at least two consecutive arid summer months, while the Temperate macrobioclimate does not have any summer aridity.
In terms of summer aridity and plant formations, the Submediterranean bioclimatic variant (of the Temperate macrobioclimate) represents the ecotone area between the Mediterranean and Temperate macrobioclimates. This variant is identifiable and characterized by positive values of the Submediterraneity Index (Isbm), which defines six levels, from extremely weak to extremely strong, according to CitationRivas-Martínez et al. (Citation2011). The Submediterranean bioclimatic variant has been recently highlighted for its original phytocoenotic, syntaxonomic, and habitat diversity (sensu Habitats Directive 92/43/ECC; CitationBiondi et al., 2015). Indeed, there are many Submediterranean syntaxa that have been described as part of the Italian Vegetation Prodrome (CitationBiondi, Allegrezza, 2014 et al., 2014; CitationBiondi, Blasi et al., 2014; CitationBiondi, Casavecchia, Pesaresi, Gangale, & Uzunov, 2014) and have been adopted at the continental level in the European Vegetation Prodrome (CitationMucina et al., Citation2016).
The Steppic bioclimatic variant can instead belong to both of these macrobioclimates. This variant is characterized by climates that are at least semicontinental, with low winter precipitation and low summer aridity, which in a Temperate macrobioclimate can also produce positive Isbm values. Therefore, positive Isbm values, which mainly describe the Submediterranean bioclimatic variant, can also occur for the Steppic bioclimatic variant. The Steppic variant was recently mapped by CitationPesaresi et al. (Citation2014), and it is mainly located in areas of the Po Valley (as a Temperate macrobioclimate). Therefore, for Italy, detailed mapping of the bioclimatic variants and the Isbm would be a useful tool for geobotanical and syntaxonomic investigations and further insight.
To date, for Italy, the map of CitationPesaresi et al. (Citation2014) is the only full implementation of the WBCS at this national scale. This bioclimatic map of Italy, however, has two critical aspects: (i) it is based on global climatic surfaces of WorlClim (version 1.4; CitationHijmans, Cameron, Parra, Jones, & Jarvis, Citation2005), from where it obtains its spatial accuracy limits. These limits mainly concern the precipitation surfaces, and they have resulted in minor inaccuracies in Ombrotypes mapping (see Table 11 in CitationPesaresi et al., Citation2014). They are determined by the low density of the local observations used in WorldClim, in relation to the extreme variability of the rainfall levels in the Italian territories (e.g. determined locally by effects of orographic barriers, coast effects; see Figure 3 in CitationPesaresi et al., Citation2014); (ii) the Isbm levels were mapped in a simplified form, as the six levels were grouped into two groups, of weak and strong.
Therefore, the present study aims to update the bioclimatic WBCS map of Italy, by improvements to the spatial accuracy of the climatic surfaces (and especially precipitation) on which to apply the WBCS, and by mapping the Isbm in detail. All of the WBCS bioclimatic units (i.e. macrobioclimates, bioclimates, bioclimatic variants, continentality types, Thermotypes, Ombrotypes) and the Isbm have been set up as a map series, and together with bioclimatic indices and parameters, these are available as raster data-sets.
2. Materials and methods
2.1. Study area
The study area is the entire Italian territory. Due to its geographic position at the center of the Mediterranean basin, and combined with its wide latitudinal extent and orographic heterogeneity (), the Italian territory is characterized by high climatic variability and diversity. It represents a long narrow ‘bridge’ between the Temperate and Mediterranean macrobioclimates (CitationBiondi & Baldoni, 1995).
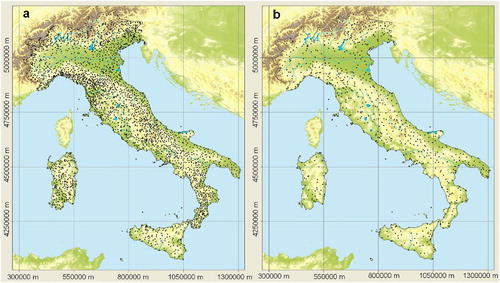
Figure 1. Maps for the collection of the local meteorological data, for the precipitation stations (a) and the thermometric stations (b). The system reference is UTM (WGS84) zone 32 N.
2.2. The WBCS
The WBCS was detailed by CitationRivas-Martínez et al. (Citation2011) and was summarized for Italy by CitationPesaresi et al. (Citation2014). The details of the Isbm and the Submediterranean and Steppic bioclimatic variants are as given in the following subsections.
2.2.1. Submediterraneity index
A territory that lies within the Temperate macrobioclimate will have a positive Isbm (i.e. >0) if at least one of the summer months has precipitation (in mm) <2.8 times the mean temperature (°C, in tenths) of the same month (Iosi <2.8). Depending on the Isbm, six distinct levels are distinguishable (from extremely weak to extremely strong; for details see CitationRivas-Martínez et al., Citation2011).
2.2.2. Submediterranean bioclimatic variant
A territory that lies within the Temperate macrobioclimate belongs to the Submediterranean bioclimatic variant if it has Isbm >0 and does not belong to the Steppic variant.
2.2.3. Steppic bioclimatic variant
A territory that lies within the Temperate or Mediterranean macrobioclimates belongs to the Steppic bioclimatic variant if it is at least low semicontinental, with low winter precipitation, and low summer aridity. In more detail, the Steppic variant must have: Continentality Index (Ic) >17; annual Ombrothermic Index (Io) from 0.2 to 6.0 (i.e. lower hyperarid to upper subhumid) with more summer precipitation than winter precipitation; and finally, at least one summer month with precipitation (in mm) <3 times the mean temperature (°C, in tenths) of the same month (Iosi <3). If this last condition is less than 2.8 (Iosi <2.8) and the territory lies within the Temperate macrobioclimate, this will produce a positive Isbm.
As indicated in the Introduction, in the Temperate macrobioclimate, both bioclimatic variants can have positive Isbm. Therefore, in the present study, we mapped in detail the bioclimatic variants and the Isbm for all of the Temperate macrobioclimate territories with Isbm >0 (including the Steppic territories) that we considered as Submediterraneity sensu lato.
2.3. Climatic data processing and WBCS mapping
Local meteorological data were collected from the ‘Italian national system for the collection of climatological data of environmental interest’ (http://www.scia.sinanet.apat.it/home.asp – CitationDesiato, Fioravanti, Fraschetti, Perconti, & Toreti, Citation2011; http://clisun.casaccia.enea.it/Pagine/Index.htm – CitationPetrarca, Spinelli, Cogliani, & Mancini, Citation1999) for the period 1960–1990 (e.g. WorldClim version 1.4). shows the locations of the 2893 precipitation stations and 869 thermometric stations. Meteorological stations with shorter observation periods (with at least 20 years) were included in the data-set for their high values in the spatial interpolation. Missing values were filled by interpolation with the nearest station.
2.3.1. Geostatistical mapping of precipitation and temperature
To obtain climatic surfaces that were suitable for improving of the spatial accuracy of the WBCS map of Italy, we considered that it was adequate to calibrate and correct (via regression kriging; CitationHengl, Citation2007; CitationPebesma, Citation2004) the WorldClim surfaces with a dense data-set of local meteorological observations (), and then not necessary to create climatic surfaces ex novo; this resulted in the search for the best spatial interpolation technique with the best set of auxiliary physiographic variables.
In practice, regression kriging between local climatic data (i.e. dependent variables) and the WorldClim data (i.e. independent variables) was applied to the following monthly variables: average mean temperature and precipitation (for each month of the year) and mean minimum and maximum temperatures for January, February, and December. These latter are useful for the calculation of the Simple and Compensated Thermicity Indices (see CitationRivas-Martínez et al., Citation2011). The mean monthly precipitation was appropriately transformed (log, sqrt) if it was far from normal.
The ten-fold cross-validation method calculation of the mean absolute error (MAE) and the normalized root mean squared error (RMSEr) were then used to select the best variogram model and to evaluate the overall accuracy of the spatial predictions. The RMSEr is the square root of the mean squared difference between the observed and predicted values, divided by the standard deviation of the data. The MAE is the mean of the absolute differences between the observed values and the predicted values. The accuracy of the spatial interpolation was adequate, with RMSEr less than (or close to) 0.4. In this case, the model accounted for 85% of the variability in the validation points (R2 = 1 − RMSEr2; CitationHengl, Citation2007).
Finally, in terms of the MAE, we compared these new calibrated climatic surfaces with those produced with different methods at national scales for the same territory (CitationBrunetti, Maugeri, Nanni, Simolo, & Spinoni, Citation2014; CitationPesaresi et al., Citation2014).
2.3.2. Mapping the WBCS
We mapped the macrobioclimates, bioclimates, bioclimatic variants, continentality types, Ombrotypes, and Thermotypes and the Isbm by applying the WBCS to the new climatic surfaces obtained here, using the mapalgebra language (in the Esri ArcGIS geographic information system). To determine the validity of these maps also at a regional scale for the Ombrotypes and Thermotypes according to the weighed Cohen’s K statistic (CitationCohen, Citation1968), we assessed the degree of agreement between the high-resolution maps constructed for the Sardinia region (CitationCanu et al., Citation2015) (see Additional Materials for more details).
3. Results
3.1. Geostatistical mapping of precipitation and temperature
The surfaces of the entire Italian territory were mapped down to 900 m spatial resolution (approximately equivalent to that of WorldClim). These referred to the period of observation from 1960 to 1990, for the monthly climatic variables considered (i.e. average mean temperature and precipitation for each month of the year; mean maximum and minimum temperatures for January, February, and December). The RMSEr and MAE for the monthly climatic surfaces obtained by ten-fold cross-validation are shown in . The variogram models selected for the regression kriging are shown in Figures S1 and S2 of the Additional Materials.
Table 1. Normalized RMSEr and MAEs for the monthly precipitation and temperature surfaces obtained by ten-fold cross-validation surfaces (months: 1 January to 12 December).
The RMSEr of the monthly precipitation surfaces were ≤0.4 for April, May, June, July, August, and September, while they were >0.4 for the other months (although all were close to 0.4, except February, March, and November). The variation explained (R2) was from 75% to 96%. The MAEs were from 5.45 to 16.12, and all were better than those of the bioclimatic map of CitationPesaresi et al. (Citation2014) ().
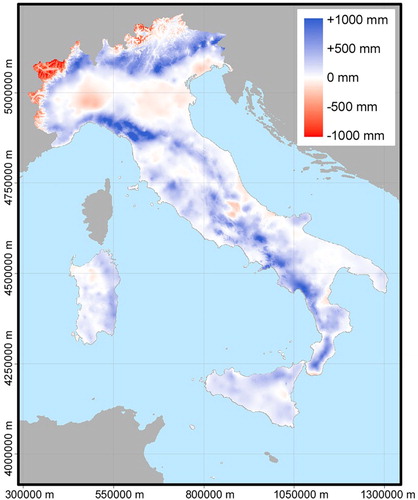
The differences (in mm) between the surfaces of the mean annual precipitation (sum of the monthly precipitation produced here) and those of WorldClim (used by CitationPesaresi et al., Citation2014) clearly showed where the precipitation levels were largely determined by the orographic barriers (also highlighting the rain shadow areas) and where the WorldClim surfaces were inaccurate and incomplete at the national scale ().
Figure 2. Mean annual precipitation differences between the surface from the present study and that of WorldClim version 1.4 (as used by CitationPesaresi et al., Citation2014). The system reference is UTM (WGS84) zone 32 N.
The RMSEr of the monthly temperature surfaces were all ≤0.4, and the variation explained (R2) was from 88% to 95%. The MAE were from 0.73 to 0.98. The MAE of the mean temperature surfaces were all smaller than those reported by CitationPesaresi et al. (Citation2014), and larger than those of CitationBrunetti et al. (Citation2014) (especially for the months from April to August).
Finally, all of the fundamental climatic surfaces for applying the WBCS to the Italian territories in terms of the RMSEr had adequate spatial accuracy, and were mean annual precipitation and temperature (with RMSEr 0.40 and 0.27, respectively; not given in ) and mean monthly precipitation and temperature for May, June, July, and August (see ).
3.2. Bioclimatic classification system mapping
The WBCS mapping process (using mapalgebra) produced the WBCS map series of Italy (Main Map), and consists of the following maps (scale 1: 2,500,000):
Macrobioclimate and bioclimatic variants;
Bioclimates and bioclimatic variants;
Submediterraneity index (Isbm);
Continentality types;
Thermotypes;
Ombrotypes;
The mapping included two macrobioclimates (Mediterranean and Temperate), two bioclimatic variants of the Temperate macrobioclimate (Submediterranean and Steppic), five Isbm levels (from Extremely weak to Highly strong; terminology in agreement with CitationRivas-Martínez et al., Citation2011), four bioclimates, seven continentality types (from strong semihyperoceanic to weak subcontinental), 11 Ombrothermic horizons (from lower semiarid to ultrahyperhumid), and 19 Thermotypic horizons (from upper infra-Mediterranean to gelid).
The Mediterranean macrobioclimate covers 39.4% of the Italian territory (301,340 km²), while the Temperate macrobioclimate covers 60.6%. The Temperate macrobioclimate is divided into Eutemperate (without any bioclimatic variant), Submediterranean (Temperate macrobioclimate, Submediterranean variant), and Steppic (Temperate macrobioclimate, Steppic variant). These cover 25.4%, 27.4%, and 7.8% of the Italian territory, respectively ().
Table 2. Pivot table of macrobioclimates and bioclimatic variants.
The Temperate macrobioclimate territories with positive Isbm (Submediterraneity sensu lato) covers 34.8% of the Italian territory (27.4% as Temperate macrobioclimate, Submediterranean variant; 7.4% as Temperate macrobioclimate, Steppic variant, with Isbm >0) (). The levels are as follows: Extremely weak (4%), Highly weak (6%), Weak (9.5%), Strong (10%), and Highly strong (5.2%). The Steppic variant of the Temperate macrobioclimate covers 7.8% of the Italian territory, and only 0.4% did not have a positive Isbm ().
In terms of the weighed Cohen’s K statistic, the agreement between the maps of Italy presented here and those realized at a regional scale for the Island of Sardinia is very high, for both Ombrotypes (k = 0.75, z = 58.3***) and Thermotypes (k = 0.82, z = 58.1***).
The monthly precipitation and temperature surfaces, the WBCS units (Main Map), and all of the indices and parameters used in the WBCS mapping of Italy are supplied in Esri grid raster format in the Additional Materials.
4. Conclusions
The bioclimatic map of Italy was successfully updated, achieving the objectives of the present study. In particular, improvements have been made to the spatial accuracy of the monthly precipitation and temperature surfaces (with reference to the period of 1960–1990), which were obtained through calibration (regression kriging) of the WorldClim surfaces with a dense point data-set of local meteorological observations. In terms of the RMSEr, the use of regression kriging as the calibration process was therefore effective on a national scale, as most of the climatic surfaces have satisfactory global spatial accuracy (only the mean monthly precipitation for February, March, and November are >0.4). Furthermore, in terms of the MAE, all of the climatic surfaces (and especially that of precipitation) are better than those used by CitationPesaresi et al. (Citation2014), although the temperature surfaces are less accurate than those produced by CitationBrunetti et al. (Citation2014) (not available online) ().
The spatial accuracy on a national scale appears effective also at the regional scale: in terms of the Cohen’s K statistic, the agreement between the WBCS map produced here and the high-resolution map of the Sardinia region (CitationCanu et al., Citation2015) is high for both Ombrotypes and Thermotypes. In addition, all of the Temperate macrobioclimate territories with positive Isbm, along with its distinct levels (five levels identified, from Extremely weak to Highly strong), have been mapped in detail.
These territories (34.8% of the entire Italian territory and 57% of the Temperate macrobioclimate) mainly describe the Submediterranean bioclimatic variant and a large part of the Steppic bioclimatic variant. The Submediterranean bioclimatic variant represents the ecotone area between the Mediterranean and Temperate macrobioclimates. It is important for its original and high phytocoenotic, syntaxonomic, and habitat diversity (sensu Habitats Directive 92/43/EEC), and it covers 27.4% of the entire Italian territory. The Steppic bioclimatic variant, instead, covers 7.8% of the Italian territories (with 7.4% with Isbm >0), and further investigations are needed to define its phytocoenotic originality.
The WBCS units of Italy mapped on a scale of 1:2,500,000 (i.e. macrobioclimates, bioclimates, bioclimatic variants, continentality types, Thermotypes, and Ombrotypes) and the Isbm levels have been organized as a map series (Main Map). All of the maps produced here and the grid raster data-set supplied (raster data-set of all parameters; WBCS bioclimatic indices and units are supplied in the Additional Materials) allow accurate bioclimatic diagnosis for the entire Italian territory. These will be useful to support the analysis of the vegetation–environment relationships, and for ecological modeling, biodiversity conservation, and applied studies of climate change at the national scale.
Software
All of the geostatistical operations (i.e. regression kriging, variogram selection, cross-validation) were performed in R (R CitationCore Team, 2012) using ‘Gstat’ (CitationPebesma, Citation2004) and ‘Automap’ (CitationHiemstra, Pebesma, Twenhöfel, & Heuvelink, Citation2009) R packages. The compilation of the algorithms of the conditional statements (i.e. the map algebra), the calculation of the parameters, and the bioclimatic indices for the generation of the maps (Main Map) were performed using Esri ArcGIS 9.0, via the raster calculator tool.
Data
We provide the maps and the most important bioclimatic indices for the full study area in raster data format. The system reference is UTM (WGS84) zone 32 N. The raster resolution is 900 m, about the same as the WorldClim resolution (30 arc-second datum WGS84). The readme.pdf file gives the code values for the classified raster and the Additional Materials.
Disclosure statement
No potential conflict of interest was reported by the authors.
Related Research Data
References
- Biondi, E., Allegrezza, M., Casavecchia, S., Galdenzi, D., Gasparri, R., Pesaresi, S., … Blasi, C. (2014). New and validated syntaxa for the checklist of Italian vegetation. Plant Biosystems – An International Journal Dealing with all Aspects of Plant Biology, 148(2), 318–332. doi: 10.1080/11263504.2014.892907
- Biondi, E., Allegrezza, M., Casavecchia, S., Galdenzi, D., Gasparri, R., Pesaresi, S., … Blasi, C. (2015). New insight on Mediterranean and sub-Mediterranean syntaxa included in the Vegetation Prodrome of Italy. Flora Mediterranea, 25(Special Issue), 77–102. doi: 10.7320/FlMedit25SI.077
- Biondi, E., & Baldoni, M. (1993). A bioclimatic characteristics of the Italian peninsula. In Gea Program (Ed.), Effects of atmospheric pollulants on climate and vegetation (pp. 225–250). Roma: Taormina.
- Biondi, E., & Baldoni, M. (1995). The climate and vegetation of peninsular Italy. Colloques Phytosociologiques, 23, 675–721.
- Biondi, E., Blasi, C., Allegrezza, M., Anzellotti, I., Azzella, M. M., Carli, E., … Zivkovic, L. (2014). Plant communities of Italy: The Vegetation Prodrome. Plant Biosystems – An International Journal Dealing with all Aspects of Plant Biology, 148(4), 728–814. doi: 10.1080/11263504.2014.948527
- Biondi, E., Casavecchia, S., Pesaresi, S., Gangale, C., & Uzunov, D. (2014). New syntaxa for the Prodrome of Italian vegetation. Plant Biosystems – An International Journal Dealing with all Aspects of Plant Biology, 148(4), 723–727. doi: 10.1080/11263504.2014.945508
- Blasi, C., & Michetti, L. (2005). Biodiversity and climate. In C. Blasi, L. Boitani, S. La Posta, F. Manes, & M. Marchetti (Eds.), Biodiversity in Italy. Contribution to the national biodiversity strategy (pp. 57–66). Roma: Palombi Editori.
- Brunetti, M., Maugeri, M., Nanni, T., Simolo, C., & Spinoni, J. (2014). High-resolution temperature climatology for Italy: Interpolation method intercomparison. International Journal of Climatology, 34(4), 1278–1296. doi: 10.1002/joc.3764
- Canu, S., Rosati, L., Fiori, M., Motroni, A., Filigheddu, R., & Farris, E. (2015). Bioclimate map of Sardinia (Italy). Journal of Maps, 11(5), 711–718. doi: 10.1080/17445647.2014.988187
- Cohen, J. (1968). Weighted kappa: Nominal scale agreement with provision for scaled disagreement or partial credit. Psychological Bulletin, 70(4), 213–220. doi: 10.1037/h0026256
- Desiato, F., Fioravanti, G., Fraschetti, P., Perconti, W., & Toreti, A. (2011). Climate indicators for Italy: Calculation and dissemination. Advances in Science and Research, 6, 147–150. doi: 10.5194/asr-6-147-2011
- Hengl, T. (2007). A Practical guide to geostatistical mapping. EUR – scientific and technical research reports. Luxembourg: Office for Official Publications of the European Communities. doi: 10.1016/0277-9390(86)90082-8
- Hiemstra, P. H., Pebesma, E., Twenhöfel, C. J. W., & Heuvelink, G. B. M. (2009). Real-time automatic interpolation of ambient gamma dose rates from the Dutch radioactivity monitoring network. Computers & Geosciences, 35(8), 1711–1721. doi: 10.1016/j.cageo.2008.10.011
- Hijmans, R. J., Cameron, S. E., Parra, J. L., Jones, P. G., & Jarvis, A. (2005). Very high resolution interpolated climate surfaces for global land areas. International Journal of Climatology, 25(15), 1965–1978. doi: 10.1002/joc.1276
- Mucina, L., Bültmann, H., Dierßen, K., Theurillat, J.-P., Raus, T., Čarni, A., … Peet, R. (2016). Vegetation of Europe: Hierarchical floristic classification system of vascular plant, bryophyte, lichen, and algal communities. Applied Vegetation Science, 19, 3–264. doi: 10.1111/avsc.12257
- Pebesma, E. (2004). Multivariable geostatistics in S: The gstat package. Computers & Geosciences, 30, 683–691. doi: 10.1016/j.cageo.2004.03.012
- Pesaresi, S., Galdenzi, D., Biondi, E., & Casavecchia, S. (2014). Bioclimate of Italy: Application of the worldwide bioclimatic classification system. Journal of Maps, 10(4), 538–553. doi: 10.1080/17445647.2014.891472
- Petrarca, S., Spinelli, F., Cogliani, E., & Mancini, M. (1999). Profilo climatico dell’Italia. Volume 0 – introduzione metodologica. Rome: ENEA.
- R Core Team. (2012). R: A language and environment for statistical computing. Vienna, Austria: R foundation for statistical computing. Retrieved from http://www.r-project.org/
- Rivas-Martínez, S. (1993). Bases para una nueva clasificacion bioclimatica de la Tierra. Folia Botanica Madritensis, 10, 1–23.
- Rivas-Martínez, S. (2004). Global bioclimatics (Clasificación Bioclimática de la Tierra). Retrieved from http://www.globalbioclimatics.org/book/bioc/global_bioclimatics_0.htm
- Rivas-Martínez, S. (2008). Global bioclimatics (Clasificación Bioclimática de la Tierra). Retrieved from http://www.globalbioclimatics.org/book/bioc/global_bioclimatics-2008_00.htm
- Rivas-Martínez, S., Penas, A., Del Rio, S., Rivas Sáenz, S., & García-Sancho, L. (2015). New bioclimatic Antarctic data variants and thermotypes. International Journal of Geobotanical Research, 5, 61–63.
- Rivas-Martínez, S., Sáenz, S. R., & Penas, A. (2011). Worldwide bioclimatic classification system. Global Geobotany, 1, 1–634.