
ABSTRACT
Although there is a need to determine the spatial accessibility of cities in China, the limitations in available data and methods hinder research in this area. The main objective of this study was to quantify the accessibility of cities in China. We developed a comprehensive analytical method to quantify spatial accessibility at a spatial resolution of one kilometer by integrating both land surface conditions and transport networks. The results show that the spatial patterns of accessibility of Chinese cities at the prefecture level and above are characterized by significant spatial heterogeneity, consistent with the patterns in physical geography, population density, and economic activities. The results improve our understanding of deficiencies in the accessibility of cities in China and provide a foundation for transportation infrastructure planning.
1. Introduction
The man-made and economic resources that provide the foundation for economic growth and human wellbeing are not distributed evenly across the planet. Instead, they are largely concentrated in cities. Thus, accessibility to the opportunities and services provided by cities is essential to the livelihood of individuals along with the overall development of cities (CitationLucas, Bates, Moore, & Carrasco, 2016; CitationWeiss et al., 2018). Since accessibility can be enhanced by constructing physical and/or digital transport infrastructure networks, advancing accessibility has become an important policy goal of international organizations and governments worldwide with the specific goal of reducing poverty and inequality. Enhancing accessibility is also a general sustainable development goal of the United Nations (CitationUnited Nations, 2015). As a powerful planning tool, accessibility has increasingly been used by policy-makers to build sustainable and equitable urban environments (CitationPáez, Scott, & Morency, 2012; CitationPereira, Schwanen, & Banister, 2017).
In the past decades, the concept of accessibility has been central to transportation and planning research (CitationPáez et al., 2012). As a result of the increasing number of studies on accessibility, the measurement of accessibility has seen significant progress. In addition to investigating the spatial disparity of accessibility itself, accessibility analyses focused on land use (CitationHansen, 1959), employment (CitationShen, 1998), population and economic impacts (CitationJin, Jiao, Qi, & Yang, 2017; CitationOzbay, Ozmen-Ertekin, & Berechman, 2003), transport infrastructure development (CitationHou & Li, 2011; CitationJiao, Wang, Jin, & Dunford, 2014; CitationLi & Shum, 2001), transport modes (CitationArranz-López, Soria-Lara, López-Escolano, & Campos, 2017; CitationMoya-Gómez & García-Palomares, 2017; CitationPérez, Quintana, & Pastor, 2011), human behavior (CitationNeutens, Delafontaine, Scott, & De Maeyer, 2012; CitationShaw & Yu, 2009), service facilities (CitationMcGrail & Humphreys, 2014; CitationWang, 2012), land value (CitationGiannopoulou, Vavatsikos, & Lykostratis, 2016), and social exclusion (CitationLucas et al., 2016; CitationPreston & Raje, 2007). Although accessibility has become an important concept that is widely used in various fields, the measurement of accessibility is often operationalized in different ways.
Generally, accessibility is defined as the potential of opportunities for interaction and is a measure of the relative ease with which individuals overcome spatial separation to reach their desired activities (CitationHansen, 1959; CitationIngram, 1971). Broadly, existing studies have calculated accessibility using both spatial and non-spatial approaches, with emphases on spatial separation (CitationJoseph & Phillips, 1984) and socioeconomic/demographic variables, respectively (CitationNeutens et al., 2012). As CitationGeurs and Van Wee (2004) pointed out, there were four basic perspectives on measuring accessibility, including infrastructure-based measure (CitationLi & Shum, 2001; CitationLinneker & Spence, 1992), location-based measure (CitationIngram, 1971; CitationZhang & Lu, 2007), person-based measure (CitationKwan & Weber, 2003; CitationLucas et al., 2016), and utility-based measure (CitationJoseph & Phillips, 1984; CitationLevine, 1998). These perspectives focus on the land-use component, the transportation component, the temporal component, and the individual component (CitationGeurs, De Montis, & Reggiani, 2015). The widely used methods include the gravity-based model (CitationGeurs & Van Wee, 2004; CitationVickerman, 1974), travel-time approach (CitationCoffee et al., 2012), two-step floating catchment area (CitationMcGrail & Humphreys, 2014; CitationWang, 2012), kernel density function (CitationGuagliardo, 2004), network analysis (CitationVentura-Fernández, González-Relaño, & Gavira-Narváez, 2017), and space–time model (CitationLiu & Zhu, 2004; CitationShaw & Yu, 2009). The methods used to measure accessibility have greatly improved as a result of advances in spatial analytical methods along with the increasing availability of high-resolution datasets. Among the methods for determining accessibility, the raster-based travel-time approach is widely used because of its excellent performance in investigating natural and socioeconomic spaces at different scales. As the specificity of the method, the raster-based accessibility algorithms concentrate more on the spatial dimension of accessibility and this differs from non-spatial accessibility approaches. From this point of view, this raster-based method, focusing on physical travel time, is believed to be more intuitive and unconditional for understanding spatial separation in the real-world environments.
However, most raster-based accessibility algorithms (CitationCao, Liu, Wang, & Li, 2013; CitationJin et al., 2017; CitationZhang & Lu, 2007) simulate accessibility based on transport networks and regard the land surface as a unified and homogeneous space. In reality, the land surface system is a complicated surface space with varying features (e.g. roads, railways, rivers, water bodies, and land cover types) and topographical conditions (e.g. elevation and slope angle). These features and topographical properties affect the travel times of humans moving through the land surface system. For instance, moving across rivers and mountains is more difficult than moving through urban areas. Therefore, neglecting the spatial heterogeneity of land surface systems leads to substantial bias when calculating accessibility in the real world.
China has experienced rapid urbanization since 2000. Between 2000 and 2016, the percentage of China’s population living in cities increased from 36.22% (459 million) to 57.35% (nearly 800 million people) (CitationNational Bureau of Statistics of China, 2017), and the urbanization rate in China is projected to reach 70% by 2030. The accessibility of cities in China has improved greatly in recent years due to the rapid development of transport infrastructure. As a result of the increasing availability of high-resolution datasets and the development of spatial analytical methods in GIS, a growing number of researchers have evaluated the spatial accessibility of cities in China, at the national scale (CitationCao et al., 2013; CitationJin et al., 2017) or regional scale (CitationHou & Li, 2011; CitationWang, Liu, Liu, Sun, & Huang, 2016; CitationZhang & Lu, 2007). At the national scale, some studies have focused on the effect of a single type of transport infrastructure on city accessibility. For example, CitationLi and Shum (2001) evaluated the effect of the national truck highway on accessibility. In contrast, other researchers adopted more comprehensive approaches that included more transport modes. For instance, CitationJiao et al. (2014) considered both high-speed rail and expressways when evaluating the national accessibility of cities in China. The effect of the development of transport infrastructure on regional accessibility (in individual provinces or cross-provincial economic regions) has also been studied, largely in the coastal provinces and mega-regions such as Jiangsu Province (CitationWang et al., 2016) and the Greater Pearl River Delta (CitationHou & Li, 2011). In general, past studies on the spatial accessibility of cities in China concentrated mainly on the effects of land-based transport infrastructure and explicitly or implicitly overlooked the influences of land surface conditions. Accordingly, land surface conditions should be included in the analytical framework used to measure spatial accessibility.
This study contributes to a better understanding of the spatial disparities in accessibility of cities in China at the prefecture level and above by integrating both land surface conditions and transport networks (air travel is not considered). Based on enhanced raster-based algorithms and integrated datasets, this study is the first to comprehensively determine the spatial accessibility of cities in China. We believe that the more accurate analysis provided in this study will serve as a foundation for the design and implementation of development policies related to the planning of transport infrastructure and spatial accessibility of cities in China.
2. Analytical framework
We operationalized accessibility in terms of travel time (i.e. the shortest accumulated travel time to the nearest city for each location in a given region through the ‘friction surface’ of the real world). To fully consider the spatial heterogeneity of land surface systems, we employed a comprehensive raster-based method for determining accessibility that integrates land surface conditions and transport networks. Using this method, we quantified the spatial accessibility of Chinese cities at the prefecture level and above.
Cost distance analysis, also known as Accumulated Cost Surface Analysis, is an analytical GIS tool used to calculate the least accumulative cost distance for each cell to the nearest source over a cost surface. The cost can be measured in various ways, including physical distance, travel time, or travel energy expenditure. This algorithm utilizes the node and link cell representation used in graph theory, in which each cell center is viewed as a node, and each node is connected to its adjacent nodes by multiple links. Every link has an impedance associated with it. Hence, the accumulated travel costs from the starting cell to the end point can be calculated by adding the costs of connecting the two cells in different ways. The least-cost path is the path that connects the starting cell and ending cell with the lowest cost to those traveling along it. Thus, the least-cost path gives the most cost-effective route between a source and a destination. Accordingly, by determining the least-cost path, cost distance analysis in GIS can be used to determine the shortest-weighted distance or the accumulated travel cost from each cell to the nearest source location.
In this study, we employed least-cost path analysis to quantify the accessibility of prefecture-level cities in China. In other words, we attempted to convert the calculation of spatial accessibility into the analysis of the shortest travel time (or the least accumulative cost) from each location to the nearest city. To conduct the cost distance analysis, a source raster and a cost raster must first be created. The source raster is a raster dataset that defines the source to which the least-cost path from each cell is calculated. The cost raster, which is crucial for determining the shortest travel time, is a raster dataset that defines the cost of traveling through each raster cell (CitationChang, 2012). Since both railways and expressways are closed systems in which stations serve as access and egress points for the transport network, the least-cost path algorithm cannot be directly applied to the closed expressways and railways (CitationWang et al., 2016). Therefore, a spatially stratified method was introduced to modify the least-cost path algorithm. shows a flowchart of the cartographic procedure used to determine spatial accessibility.
Figure 1. Flowchart of the cartographic procedure used to determine spatial accessibility.
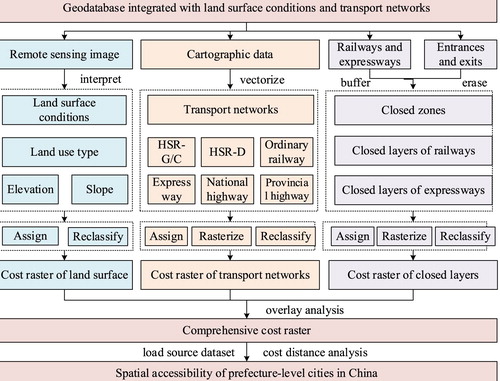
To accurately quantify the cost surface raster, both land surface conditions and transport networks were considered. The land surface conditions included land use types, elevation, and slope, while the land transport networks were high-speed railways (HSRs), including G, C, and D prefix bullet trains (for detailed information about Chinese train types, see http://trains.china.org.cn/), conventional railways, expressways, and national and provincial roads. In addition, buffer zones were established at both sides of all expressways and railways. The layers of land surface conditions, transport networks, and closed zones were then integrated into a comprehensive cost raster dataset to represent the actual time cost of each cell when traveling through the raster surface. Finally, spatial accessibility was calculated and visualized from the source dataset and cost raster dataset using the cost distance tool in ArcGIS.
3. Data and methods
3.1. Data source and preparation
The data sources used to calculate spatial accessibility are shown in .
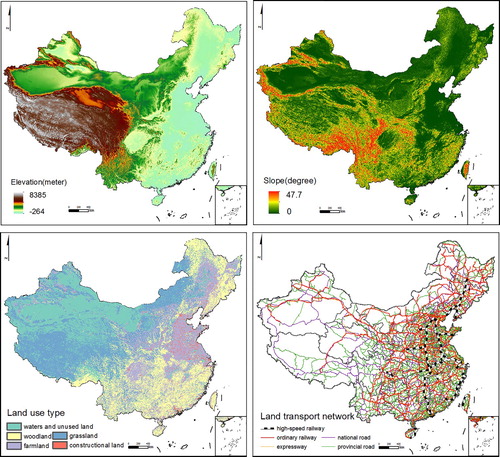
Land surface conditions. To investigate the effects of land surface conditions on spatial accessibility, land use type, elevation, and slope were considered in this study. Specifically, land use/land cover (LULC) was utilized to extract the land use type (CitationLiu et al., 2014), and the digital elevation model (DEM) was employed to calculate the topographic elevation and slope. The original national-scale LULC and DEM datasets were collected from the Data Center for Resources and Environmental Sciences, Chinese Academy of Sciences (RESDC) (http://www.resdc.cn) with spatial resolutions of 1 km and 90 m, respectively, and in the Albers equal-area coordinate system.
Land transport networks. The land transport networks were produced by integrating railway networks (including HSRs and ordinary railways) and road networks (including highways, national roads, and provincial roads) constructed as of the end of 2012. The railway and road network datasets were mainly extracted from the 1:4,000,000 Road Traffic Edition map provided by the Ministry of Communications, Human-Earth System of the Chinese Academy of Sciences (http://www.naturalresources.csdb.cn), and the National Fundamental Geographic Information System of China (http://nfgis.nsdi.gov.cn/default.asp). Some of the HSR data were manually digitized into the final land transport geodatabase based on the actual running time (https://kyfw.12306.cn).
Figure 2. Datasets of land surface conditions and transport networks used to calculate spatial accessibility.
3.2. Data processing
Previous studies often ignored the spatial heterogeneity of the land surface, leading to potential bias in the estimation of spatial accessibility. Thus, we created a comprehensive analytical algorithm that considers the topographical and geomorphological features of the land surface system to quantify the spatial accessibility of Chinese cities at the prefecture level and above. The operational process for establishing the accessibility algorithm involved the following three steps.
3.2.1. Establishment of a geodatabase
To calculate spatial accessibility, a geodatabase was constructed to contain the datasets related to land surface conditions and transport networks. For national-level analyses, the spatial resolution was set to 1 km, and the entire land area of China was divided into approximately 9.5 million effective raster cells. The LULC dataset with a spatial resolution of 1 km was then used to extract the raster dataset of land use types, which included construction land, farmland, grassland, woodland, water area, and unused land. We also used the DEM to calculate the raster datasets of elevation and slope with spatial resolutions of 1 km. The vector-based datasets for land transport networks included HSRs (G, C, and D prefix bullet trains), ordinary railways, highways, and national and provincial roads.
3.2.2. Technical solution to the closed railway and expressway systems
As mentioned earlier, railways and expressways are both closed systems; thus, the cost path analysis cannot be directly applied to these two modes of transport. Thus, we first conducted buffer analyses with the closed railways and expressways. The outputs of the buffer analyses were polygon layers that wrapped the two sides of the railways and expressways. We then conducted buffer analyses of the layers of the entrances and exits within the railways and expressways. The output buffer zones were used to ‘erase’ the initial buffer zones, and closed polygon layers with entrances and exits were then produced. Specifically, the buffer sizes for both closed systems and entrances and exits were set as 3 kilometers so that the buffers were able to wrap the both two sides of the railways and expressways.
3.2.3. Calculation of spatial accessibility
To obtain cost surfaces, operating speeds were assigned to the different layers of land surface conditions, transport networks, and closed zones (see ), and all layers were then combined to generate a composite layer. According to the Technical Standards of Highway Engineering of China (CitationMinistry of Communications, 2004), the average operating speeds of expressways, national roads, and provincial roads are 100, 80, and 60 km/h, respectively. According to the operating speeds of different types of rail transport in China, the average speeds for the G, C, and D prefix bullet trains and ordinary railways are 250, 250, 160, and 90 km/h, respectively. Speeds of travel were assigned to the raster cells according to the different land uses, elevations, and slopes. For the closed zones, the traveling speed was set at 1 km/h to represent the barrier property of these transport types.
Table 1. Traveling speeds of cells with different attributes.
After assigning speed values to each layer, we further rasterized and reclassified the vector layers of the transport networks and closed zones. We then converted these layers into raster datasets with spatial resolutions of 1 km × 1 km along with land surface datasets. Subsequently, considering the speed constraints of the different raster elements, we merged the different types of raster layers to create a composite speed raster surface according to the priorities of the different raster datasets (namely, transport mode > closed zone > land use type > elevation > slope). Finally, the cost raster surface was produced from the speed raster datasets using the conversion formula.
Based on the least-cost path analysis, we used the cost distance tool to calculate the least accumulative cost to the nearest source for each cell through a cost surface. The cost raster datasets were obtained in the previous sections. Here, as the source dataset, we loaded 290 cities at the prefecture level and above. We then employed the cost distance tool within the ArcGIS spatial analysis module to calculate the shortest accumulated time to the nearest city for each cell through the cost surface. Finally, we obtained the cost distance raster and spatially visualized the accessibility of cities in China at the prefecture level and above.
4. Result
The result of this study was a Main Map that visualizes the spatial patterns of the accessibility of Chinese cities in 2012. The overall accessibility patterns of cities in China show significant spatial heterogeneity, consistent with the patterns in physical geography, population density, and economic activities.
The most accessible regions are largely concentrated on the northern China, the Central Plains region, the northern part of eastern China, the Chengdu-Chongqing region, and the Pearl River Delta, which correspond to the North China Plain, the Middle-Lower Yangtze Plain, the Sichuan Basin, and the Pearl River Alluvial Plain, respectively. In other regions, the plateaus, mountains, and hills have significant negative effects on regional accessibility. The regions with the highest accessibility constitute vast continuous stretches of urban areas, while other regions only demonstrate relatively high accessibility surrounding the larger cities. From the perspective of spatial accessibility, the spatial structures of some of the urban and regional systems at different scales have emerged to some extent.
At the regional scale, several highly accessible regions have formed one-hour isochronous circles with relatively advanced levels of regional economic integration. These regions include the Yangtze River Delta, the Pearl River Delta, Beijing-Tianjin-Hebei, the Shandong Peninsula, the Central Plains, and Chengdu-Chongqing. However, some mega-regions (e.g. Harbin-Changchun, the Guanzhong Plain, the Middle Yangtze River, Lanzhou-Xining, and Central Inner Mongolia) do not show dense connectivity, and they conversely remain unbound between single metropolitan areas. Within these regions, disparities in accessibility and development are observed between the primary cities and the surrounding medium- and small-sized cities.
5. Conclusions
Spatial accessibility plays a key role in improving the mobility of people and goods, producing far-reaching effects on development of different regions, positive or negative. Previous studies adopted various methods to quantify accessibility at the global, national, and regional scales with the goal of providing a basis for the design and implementation of accessibility-based development policies. However, most previous studies concentrated on the effects of land-based transport infrastructure on spatial accessibility and largely ignored the influences of different land surface conditions. In this study, we developed a more comprehensive analytical method that integrates land surface conditions and transport networks to more reliably determine the real spatial accessibility of cities in China at the prefecture level and above. The resulting accessibility map highlights the spatial heterogeneity and large disparities in accessibility in China at different spatial scales.
Compared to previous studies on this topic (CitationCao et al., 2013; CitationJin et al., 2017), the results obtained in this study provide more detail and generate important insights. As shown in the Main Map, the analytical method developed in this study resulted in three main improvements over past investigations. First, the variations in travel time in urban areas throughout China are larger than in previous studies. Due to the topographical limitations resulting from mountains, rivers, and different land covers, the accessibility map of cities in China indicates disparities in accessibility between urban and non-urban areas. Second, the mountainous and hilly areas in southeast and southwest China have relatively poor accessibility, which has been ignored in previous studies. Third, the Main Map reveals the low accessibility of remote areas in western and northeastern China, which was not identified in previous studies. The accessibility of cities in these regions is worse than in eastern and middle China due to the poor geomorphological and transportation conditions.
The raster-based accessibility algorithm used in this study considers both land surface conditions and transport networks, eliminating the problems caused by neglecting spatial heterogeneity when calculating accessibility. Thus, the enhanced approach greatly improves the analytical accuracy and fine-granularity of simulating and visualizing spatial accessibility. The proposed method provides a spatial representation of accessibility that accounts for both land surface conditions and transport networks. This new approach is believed to be well-adaptable to real-world environments, and the findings are applicable to real scenarios. From this point of view, the proposed analytical method has great potential to be applied on the global, national, and subnational scales to understand complicated natural and social phenomena.
Software
The data were displayed, processed, and analyzed using ESRI ArcGIS 10.2. Python 2.7 was used for the spatial overlay analyses of the multiple raster datasets.
Main_Map.pdf
Download PDF (11.1 MB)Disclosure statement
No potential conflict of interest was reported by the authors.
Additional information
Funding
Related Research Data
References
- Arranz-López, A., Soria-Lara, J. A., López-Escolano, C., & Campos, A. P. (2017). Making ‘retail mobility environments’ visible for collaborative transport planning. Journal of Maps, 13(1), 90–100. doi: 10.1080/17445647.2017.1383945
- Cao, J., Liu, X. C., Wang, Y., & Li, Q. (2013). Accessibility impacts of China’s high-speed rail network. Journal of Transport Geography, 28(2), 12–21. doi: 10.1016/j.jtrangeo.2012.10.008
- Chang, K. (2012). Introduction to geographic information systems (6th ed). New York, NY: McGraw-Hill Education.
- Coffee, N., Turner, D., Clark, R. A., Eckert, K., Coombe, D., Hugo, G., & Tonkin, A. A. (2012). Measuring national accessibility to cardiac services using geographic information systems. Applied Geography, 34, 445–455. doi: 10.1016/j.apgeog.2012.01.007
- Geurs, K. T., De Montis, A., & Reggiani, A. (2015). Recent advances and applications in accessibility modelling. Computers, Environment and Urban Systems, 49(1), 82–85. doi: 10.1016/j.compenvurbsys.2014.09.003
- Geurs, K. T., & Van Wee, B. (2004). Accessibility evaluation of land-use and transport strategies: Review and research directions. Journal of Transport Geography, 12(2), 127–140. doi: 10.1016/j.jtrangeo.2003.10.005
- Giannopoulou, M., Vavatsikos, A. P., & Lykostratis, K. (2016). A process for defining relations between urban integration and residential market prices. Procedia-Social and Behavioral Sciences, 223, 153–159. doi: 10.1016/j.sbspro.2016.05.338
- Guagliardo, M. F. (2004). Spatial accessibility of primary care: Concepts, methods and challenges. International Journal of Health Geographics, 3(3), 1–13.
- Hansen, W. G. (1959). How accessibility shapes land use. Journal of the American Institute of Planners, 25(2), 73–76. doi: 10.1080/01944365908978307
- Hou, Q., & Li, S. M. (2011). Transport infrastructure development and changing spatial accessibility in the Greater Pearl River Delta, China, 1990–2020. Journal of Transport Geography, 19(6), 1350–1360. doi: 10.1016/j.jtrangeo.2011.07.003
- Ingram, D. R. (1971). The concept of accessibility: A search for an operational form. Regional Studies, 5(2), 101–107. doi: 10.1080/09595237100185131
- Jiao, J., Wang, J., Jin, F., & Dunford, M. (2014). Impacts on accessibility of China’s present and future HSR network. Journal of Transport Geography, 40(10), 123–132. doi: 10.1016/j.jtrangeo.2014.07.004
- Jin, F., Jiao, J., Qi, Y., & Yang, Y. (2017). Evolution and geographic effects of high-speed rail in East Asia: An accessibility approach. Journal of Geographical Sciences, 27(5), 515–532. doi: 10.1007/s11442-017-1390-8
- Joseph, A. E., & Phillips, D. R. (1984). Accessibility and utilization: Geographical perspectives on health care delivery (pp. 93–109). London: Sage.
- Kwan, M. P., & Weber, J. (2003). Individual accessibility revisited: Implications for geographical analysis in the twenty-first century. Geographical Analysis, 35(4), 341–353. doi: 10.1111/j.1538-4632.2003.tb01119.x
- Levine, J. (1998). Rethinking accessibility and jobs-housing balance. Journal of the American Planning Association, 64(2), 133–149. doi: 10.1080/01944369808975972
- Li, S. M., & Shum, Y. M. (2001). Impacts of the national truck highway system on accessibility in China. Journal of Transport Geography, 9(1), 39–48. doi: 10.1016/S0966-6923(00)00040-5
- Linneker, B. J., & Spence, N. A. (1992). Accessibility measures compared in an analysis of the impact of the M25 London Orbital Motorway on Britain. Environment and Planning A, 24(8), 1137–1154. doi: 10.1068/a241137
- Liu, J., Kuang, W., Zhang, Z., Xu, X., Qin, Y., Ning, J., … Yan, C. (2014). Spatiotemporal characteristics, patterns, and causes of land-use changes in China since the late 1980s. Journal of Geographical Sciences, 24(2), 195–210. doi: 10.1007/s11442-014-1082-6
- Liu, S., & Zhu, X. (2004). An integrated GIS approach to accessibility analysis. Transactions in GIS, 8(1), 45–62. doi: 10.1111/j.1467-9671.2004.00167.x
- Lucas, K., Bates, J., Moore, J., & Carrasco, J. (2016). Modelling the relationship between travel behaviours and social disadvantage. Transportation Research Part A: Policy and Practice, 85, 157–173.
- McGrail, M. R., & Humphreys, J. S. (2014). Measuring spatial accessibility to primary health care services: Utilising dynamic catchment sizes. Applied Geography, 54, 182–188. doi: 10.1016/j.apgeog.2014.08.005
- Ministry of Communications of the People’s Republic of China. (2004). Technical standard of highway engineering (JTG B01-2003). Beijing: China Communications Press.
- Moya-Gómez, B., & García-Palomares, J. C. (2017). The daily dynamic potential accessibility by car in London on Wednesdays. Journal of Maps, 13(1), 31–39. doi: 10.1080/17445647.2017.1305301
- National Bureau of Statistics of China. (2017). China statistical yearbook 2017. Beijing: China Statistics Press.
- Neutens, T., Delafontaine, M., Scott, D. M., & De Maeyer, P. (2012). An analysis of day-to-day variations in individual space-time accessibility. Journal of Transport Geography, 23(3), 81–91. doi: 10.1016/j.jtrangeo.2012.04.001
- Ozbay, K., Ozmen-Ertekin, D., & Berechman, J. (2003). Empirical analysis of the relationship between accessibility and economic development. Journal of Urban Planning and Development, 129(2), 97–119. doi: 10.1061/(ASCE)0733-9488(2003)129:2(97)
- Páez, A., Scott, D. M., & Morency, C. (2012). Measuring accessibility: Positive and normative implementations of various accessibility indicators. Journal of Transport Geography, 25, 141–153. doi: 10.1016/j.jtrangeo.2012.03.016
- Pereira, R. H. M., Schwanen, T., & Banister, D. (2017). Distributive justice and equity in transportation. Transport Reviews, 37(2), 170–191. doi: 10.1080/01441647.2016.1257660
- Pérez, E. O., Quintana, S. M., & Pastor, I. O. (2011). Road and railway accessibility atlas of Spain. Journal of Maps, 7(1), 31–41. doi: 10.4113/jom.2011.1167
- Preston, J., & Raje, F. (2007). Accessibility, mobility and transport-related social exclusion. Journal of Transport Geography, 15(3), 151–160. doi: 10.1016/j.jtrangeo.2006.05.002
- Shaw, S. L., & Yu, H. (2009). A GIS-based time-geographic approach of studying individual activities and interactions in a hybrid physical-virtual space. Journal of Transport Geography, 17(2), 141–149. doi: 10.1016/j.jtrangeo.2008.11.012
- Shen, Q. (1998). Location characteristics of inner-city neighborhoods and employment accessibility of low-wage workers. Environment and Planning B: Planning and Design, 25(3), 345–365. doi: 10.1068/b250345
- United Nations. (2015). Transforming our world: The 2030 agenda for sustainable development. Retrieved from http://www.un.org/ga/search/view_doc.asp?symbol=A/RES/70/1&;referer=/english/&Lang=E
- Ventura-Fernández, J., González-Relaño, R., & Gavira-Narváez, A. (2017). Accessibility of rail trails in Huelva, Andalusia (Spain). Journal of Maps, 13(1), 62–66. doi: 10.1080/17445647.2017.1323033
- Vickerman, R. W. (1974). Accessibility, attraction, and potential: A review of some concepts and their use in determining mobility. Environment and Planning A, 6(6), 675–691. doi: 10.1068/a060675
- Wang, F. (2012). Measurement, optimization, and impact of health care accessibility: A methodological review. Annals of the Association of American Geographers, 102(5), 1104–1112. doi: 10.1080/00045608.2012.657146
- Wang, L., Liu, Y., Liu, Y., Sun, C., & Huang, Q. (2016). Use of isochrone maps to assess the impact of high-speed rail network development on journey times: A case study of Nanjing city, Jiangsu province, China. Journal of Maps, 12(sup1), 514–519. doi: 10.1080/17445647.2016.1195296
- Weiss, D. J., Nelson, A., Gibson, H. S., Temperley, W., Peedell, S., Lieber, A., … Gething, P. W. (2018). A global map of travel time to cities to assess inequalities in accessibility in 2015. Nature, 553(7688), 333–336. doi: 10.1038/nature25181
- Zhang, L., & Lu, Y. (2007). Regional accessibility of land traffic network in the Yangtze River Delta. Journal of Geographical Sciences, 17(3), 351–364. doi: 10.1007/s11442-007-0351-z