
 ?Mathematical formulae have been encoded as MathML and are displayed in this HTML version using MathJax in order to improve their display. Uncheck the box to turn MathJax off. This feature requires Javascript. Click on a formula to zoom.
ABSTRACT
Pictured Rocks National Lakeshore is located in the Upper Peninsula of Michigan along the southern shore of Lake Superior. The park spans approximately 300 km2 and is almost fully incorporated within the ten 7.5-minute quadrangles presented in this new, detailed surficial geology map. The western quadrangles are mainly characterized by thin accumulations of undifferentiated Quaternary sediment above shallow bedrock while the eastern quadrangles mostly show thick accumulations of various glacial outwash units. This map was produced by integrating field data with a high-resolution LiDAR digital elevation model and associated hillshade, aerial imagery, and passive seismic data. The high-resolution elevation information was essential to differentiate between outwash units, post-glacial sand accumulations, and interpreting subtle glacial features that would have otherwise remained unrecognized. This new map provides fundamental information to help decipher the glacial history of this region to enhance our understanding of how this popular landscape developed.
1. Introduction
Pictured Rocks National Lakeshore consists of approximately 69 km (43 mi) of scenic landscape along the southern shore of Lake Superior in the Upper Peninsula of Michigan (). It is among the most popular parks in Michigan, yet prior to this mapping project, it lacked a detailed surficial geology map characterizing the distribution of sediments and landforms. The park is about 300 km2 (114 mi2) and is almost fully incorporated within ten 7.5-minute quadrangles () presented in this newly completed map, which covers approximately 1,330 km2 (513 mi2).
Figure 1. Location map. Pictured Rocks National Lakeshore is located along the southern shore of Lake Superior in the Upper Peninsula of Michigan.
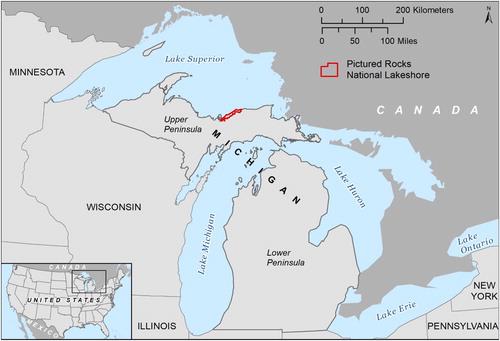
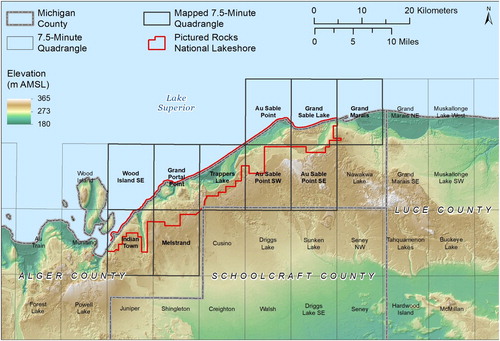
Figure 2. Regional elevation and 7.5-minute quadrangle references. Highest elevations are in white and tan, and lowest elevations are in teal. Pictured Rocks National Lakeshore is located in Alger county and almost fully incorporated within the ten distinguished 7.5-minute quadrangles.
Pictured Rocks earns its name from colorful mineral oxides (mainly iron, copper, and manganese oxides) that stain the sides of sandstone cliffs, which average approximately 30 m (100 ft) above Lake Superior along the shore in the Indian Town, Wood Island SE, and Grand Portal Point quadrangles. The bedrock throughout the mapped region consists of various units of sandstone, dolomitic sandstone, and limestone of the Jacobsville (Neoproterozoic), Munising (Late Cambrian), and Au Train (Early Ordovician) Formations (CitationHaddox & Dott, 1990; CitationHamblin, 1958; CitationMalone et al., 2016; CitationMiller et al., 2006). The Au Train Formation is sometimes separated and classified as the Trempealeau Formation (Late Cambrian) and Prairie du Chien Group (Ordovician; e.g. CitationMilstein, 1987). The Pictured Rocks cliffs are mainly composed of the Munising Formation. Glacial sediments of varying thicknesses, which were deposited as the Laurentide Ice Sheet (LIS) retreated through the region approximately 13–11 ka (e.g. CitationBlewett et al., 2014; CitationLarsen, 1987), cover most of the bedrock in the Pictured Rocks area.
2. Methods
This surficial geology map was created by integrating extensive field investigations of surficial materials and sediment textural analysis with several additional datasets, including digital elevation models (DEMs), aerial imagery, the soil survey of Alger County (CitationSchwenner, 2013), and existing geology maps, reports, and geologic literature covering the Pictured Rocks area. Additionally, newly-acquired geophysical data (CitationVanderMeer, 2018) provided a more detailed representation of the thicknesses of sediment accumulations as well as the subsurface bedrock topography throughout the region. The new surficial geology map and geophysical data were applied with previous geologic studies to interpret a more detailed reconstruction of the glacial history and processes that sculpted the Pictured Rocks region (CitationVanderMeer, 2018).
2.1. Field Mapping Methods
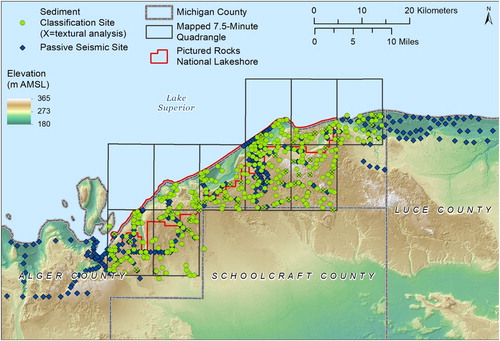
Field mapping began in the western-most portion of the study area (Indian Town quadrangle) and progressed to the northeast, one quadrangle at a time. Mapping sites were determined in each quadrangle using a combination of aerial imagery and a high-resolution 0.6 m (2 ft) Light Detection and Ranging (LiDAR) DEM and associated hillshade prior to field investigation. A handheld Global Positioning System (GPS) unit was used to accurately navigate the Pictured Rocks area to the predetermined locations of interest. Sediment observation and classification mainly occurred within shallow hand-augured borings and/or small pits dug by the investigators, and also natural exposures, road and stream cuts, and construction or sand/gravel pit excavations. Depth of investigation was generally around 1.5 m (5 ft) except in areas of greater exposure, like deep road cuts and sand/gravel pits. A map unit was preliminarily assigned at each mapping location and confirmed (or adjusted accordingly) during digital cartography after the data were analyzed. Each quadrangle that excludes significant portions of Lake Superior averaged approximately 50 mapping sites, totaling 372 throughout the ten quadrangles of this study area ().
Figure 3. Locations of sediment classifications (372 sites) for surficial geology mapping and passive seismic data collection sites (347 total). Sediment classification sites with ‘X’ designate samples used in textural analysis.
2.2. Sediment Textural Analysis
The various outwash units all exhibit very similar sandy characteristics, so textural analysis was selected as a method to potentially reveal any subtle grain size differences or patterns that could further define and distinguish between the outwash units. Additionally, textural analysis was performed on sediment collected from other landforms in an attempt to detect any sedimentological signatures unique to other map units as well. Textural analysis was performed on 36 sediment samples (out of the 372 total), which were selected from a variety of landforms in the mapped region. Samples that underwent textural analysis are indicated with an ‘X’ in . Samples were processed using dry sieving methods (e.g. CitationAmerican Society for Testing and Materials, 1970; CitationVanderMeer, 2018) with a seven-sieve stack plus bottom pan to collect fines (silt and clay). Weight percentages of fines selected to describe map units were estimated from textural analysis results plus general field observations of the sediments.
2.3. HVSR Passive Seismic Technique
Sediment thicknesses and the subsurface bedrock topography throughout the Pictured Rocks region were estimated using the horizontal-to-vertical spectral ratio (HVSR) passive seismic technique (e.g. CitationEsch & Sauck, 2015; CitationVanderMeer, 2018). This technique uses a broadband instrument with 3-component geophones to record ambient seismic signals for a set time (typically 10–30 min) at a single site. These data undergo HVSR analysis (GRILLA software was used in this study), and the resulting fundamental frequency value determined at the site is used to estimate the depth to bedrock at each passive seismic location using a calibration equation. The calibration equation developed in this study is as follows:(1)
(1) where Z is bedrock depth and fo
is the fundamental resonance frequency. This equation was developed by J. Esch (personal communication, Citation2016) by employing the HVSR passive seismic technique at 56 locations throughout the Upper Peninsula with known bedrock depth (as reported in water-well logs; CitationVanderMeer, 2018). The HVSR technique was performed on passive seismic data collected from 347 locations () to provide regional subsurface information concerning the thickness and extent of surficial geologic units and also the regional bedrock topography. The Michigan Department of Environment, Great lakes, and Energy Wellogic and historical scanned water-well log databases were viewed to confirm plausibility of sediment thickness estimates throughout the Pictured Rocks region.
2.4. Digital Cartography
Each of the ten quadrangles were digitized at a 1:24,000-scale using ESRI ArcMap10 software. The final surficial geology map document compiling all ten 7.5-minute quadrangles (also produced using ESRI ArcMap 10) is presented at a 1:62,500-scale to accommodate common printing dimensions. The DEM and associated hillshade used during digital cartography were created from LiDAR data of Alger County with approximately 0.6 m (2 ft) resolution, though the quadrangles are intended to be viewed at a 1:24,000-scale. The National Park Service provided the high-resolution LiDAR DEM and hillshade of Alger County, as well as a LiDAR DEM of the small northern section of Schoolcraft County that is included within the Trappers Lake, Au Sable Point SW and Au Sable Point SE quadrangles (). Quadrangle boundaries, lake outlines, river locations, and county boundaries were obtained from the GIS open data website provided by the State of Michigan. Nearly all the lake polygons within the mapped area were edited to reflect the accuracy of the high-resolution LiDAR DEM and hillshade, and rivers were also edited where they displayed significant spatial errors when viewed at a 1:24,000-scale. Areas of peat and muck (Qp) were digitized using aerial imagery (georeferenced from Google Earth), field data, and the LiDAR DEM hillshade. Remaining map unit polygons were then digitized using field data and the LiDAR DEM and hillshade. The high-resolution elevation data was proven especially valuable to differentiate between outwash units and to locate and interpret subtle features, such as diamicton ridges (Qd) and several eskers (Qe), which would otherwise have remained unrecognized. Due to heavy vegetative cover and poor exposures, map contacts are approximate and inferred from topographic expressions visible on the high-resolution DEM and hillshade (other than lake boundaries, which are certain).
3. Results and Discussion
The Pictured Rocks region is a relatively high-relief landscape in Michigan. Elevations throughout the mapped area range from approximately 184 m (600 ft) above mean sea level (AMSL) along the low sandy beaches of the Lake Superior coastline, to approximately 340 m (1,100 ft) AMSL along parts of the Munising outwash fan complex (Qm) in the Au Sable Point SE and Au Sable Point SW quadrangles. The Grand Sable Dunes (Qb in the Grand Sable Lake quadrangle) are located approximately 280-300 m (920-985 ft) AMSL along the Lake Superior shoreline and are among the highest elevations within Pictured Rocks. Only 150 m (500 ft) inland from the shoreline, the bluff itself (the Grand Sable Banks) represents the highest relief in the area, rising almost 120 m (400 ft) above Lake Superior.
3.1. Sediment Thicknesses and Bedrock Topography
The HVSR passive seismic technique was used to estimate the sediment thickness (depth to bedrock estimated in m deep from the surface) above the bedrock at individual sites throughout the Pictured Rocks region. Within the mapped quadrangles, the west portion of Pictured Rocks is characterized by thin sediment accumulations above bedrock, typically less than about 10 m (33 ft). The eastern portion of Pictured Rocks generally displays much thicker accumulations of sediment, often between about 40-80 m (130-260 ft) with regions of even greater thickness, most notably in the eastern-most quadrangle (Grand Marais) where values are estimated to exceed 160 m (525 ft).
Individual sediment thickness estimates were corrected to remove surficial topographic influence to approximate the bedrock elevation in m above mean sea level (m AMSL) at each location. Within the mapped quadrangles, the western portion of Pictured Rocks is characterized by higher bedrock elevations that decrease slightly to the east. Several clusters of low bedrock elevation data points throughout the study region define linear bedrock troughs oriented approximately N-S that are buried beneath glacial and/or post-glacial sediment mapped in this study.
Passive seismic data were collected beyond the Pictured Rocks park boundary in order to investigate locations of buried segments of glacial tunnel valleys that are carved into the floor of the eastern Lake Superior basin north of Pictured Rocks (CitationPatterson et al., 2003; CitationRegis et al., 2003). Tunnel valleys are interpreted to form as high-pressure, subglacial meltwater escapes the glacial system and carves over-deepened conduits into basal sediment and bedrock (e.g. CitationKehew et al., 2012). Dimensions, geometries, and positions of the deep bedrock troughs observed throughout the study area suggest that these features are likely southern extensions of the N-S oriented glacial tunnel valleys observed north of Pictured Rocks in the Lake Superior basin (CitationVanderMeer, 2018).
3.2. Western Quadrangles
The western quadrangles (Indian Town, Melstrand, Wood Island SE, and Grand Portal Point) are characterized by thin accumulations of undifferentiated Quaternary sediment (Qts) averaging approximately 5 m (16 ft) or less overlying shallow bedrock. Sediments mapped as Qts lack distinct glacial or post-glacial characteristics to distinguish their origin. Exceptions to the general thin sediment accumulation pattern in the western quadrangles include areas of glacial outwash deposits (Qsg, Qg, and Qs) where sediment accumulations generally exceed 5 m (16 ft). The steep bedrock cliffs exposed along the Lake Superior shoreline in these quadrangles translate into very narrow bedrock (R) polygons on the map along much of the coast and near inland waterfalls. Eskers (Qe), drumlins (Qdr), and a stacked push moraine (Qpm) located in the western quadrangles all indicate that former ice-flow direction was toward the southeast in this area. The stacked push moraine is interpreted to have developed as a seasonally-oscillating ice margin sequentially shoved several single push moraines (composed of pre-existing stratified outwash) on top of one another (CitationVanderMeer, 2018). Bedding is folded and dips in the direction of ice advance (southeast). Subtle discontinuous diamicton ridges also occur in the western quadrangles. These features are interpreted to represent small, single push moraines and appear to trace former ice margin positions that connect to previously-established positions along the crests of the Grand Marais and Munising outwash fan complexes (Qm and Qg) in the eastern quadrangles (CitationVanderMeer, 2018).
3.3. Eastern Quadrangles
The eastern quadrangles (Trappers Lake, Au Sable Point SW, Au Sable Point SE, Au Sable Point, Grand Sable Lake, and Grand Marais) include thicker accumulations of quartz-rich sands, which are interpreted as multiple glacial outwash units (primarily Qg, Qm, Qs, and Qkt1-6). Meltwater kame terraces (Qkt1-6) are interpreted to have developed as the LIS retreated from the Upper Peninsula for the final time following the Marquette glacial phase (CitationBlewett, 1994; CitationVanderMeer, 2018): after the Grand Marais outwash fans (Qg) were deposited from meltwater flowing southward from the ice margin, the LIS retreated northward exposing areas of lower elevations; meltwater was then routed eastward following the lowest exposed elevations, constrained between the LIS margin to the north and the crests of the Grand Marais and Munising outwash fans to the south; continued exposure of lower-elevation areas during deglaciation led to step-like surfaces, and incisions developed within several terraces.
3.4. Munising and Grand Marais Outwash Fan Complexes
The Munising and Grand Marais outwash fan complexes (Qm and Qg, respectively) are among the most prominent glacial landforms in the region that flank the southern Pictured Rocks boundary. The crests of the Munising and Grand Marais outwash fan complexes represent ice margin positions where the LIS paused for a significant period of time and deposited large, southward-grading fans from meltwater exiting the subglacial system. These outwash fan complexes were originally classified as a single landform and interpreted as a moraine, termed the Munising moraine (CitationBergquist, 1936; CitationLeverett, 1911; Citation1929; CitationMartin, 1957). More recent studies, however, have indicated that this nearly continuous upland is composed of two landforms, often termed the Munising and Grand Marais moraines, that were deposited at separate times when the LIS margin paused at this common position (CitationBlewett, 1994; CitationBlewett et al., 2014; CitationDrexler et al., 1983). The Munising and Grand Marais ‘moraines’ have been reinterpreted as heads of outwash with a series of associated outwash fans resulting from a stagnant ice margin (CitationBlewett & Rieck, 1987), which is verified in this mapping study. This surficial geology map refers to the sediments of the Munising and Grand Marais ‘moraines’ as the Munising and Grand Marais outwash fan complexes (Qm and Qg, respectively).
Cross-cutting relationships between the Munising and Grand Marais outwash fan complexes and the configuration of each of their southern fan limits indicate that the Munising outwash fans are older than Grand Marais outwash fans. Munising outwash fans likely graded into Lake Algonquin (CitationBlewett et al., 2014), which was a large proglacial lake that filled the Lake Michigan and Huron basins and inundated much of the eastern Upper Peninsula and northern tip of the Lower Peninsula approximately 13 ka (e.g. CitationLarsen, 1987). The southern edge of this fan complex displays a clear terminus in the quadrangles directly south and southeast of the Au Sable Point SW and Au Sable Point SE quadrangles (Driggs Lake, Sunken Lake, Seney NW, Tahquamenon Lakes; ) as outwash was abruptly deposited upon entering Lake Algonquin (CitationBlewett et al., 2014). Munising outwash fans display hummocky topography and generally lie at higher elevations than the younger Grand Marais outwash fans. The higher elevations may be attributed to greater pressures acting on the subglacial meltwater during Munising outwash fan deposition.
The Grand Marais outwash fan complex is typically associated with LIS retreat following the Marquette glacial phase approximately 11 ka (e.g. CitationBlewett et al., 2014). These fans display smooth topography interspersed with areas of pitted (kettled) terrain and cross-cut Munising outwash fans. Grand Marais fans lack a distinct southern terminus south of the mapped area, and instead show gentle southern gradation across much of the width of the Upper Peninsula to the northern Lake Michigan shore. Both the Munising and Grand Marais fan complexes are cross-cut by glacial meltwater sluiceways (Qs) that carried meltwater southward from the ice margin (CitationBlewett, 2012; CitationHughes, 1989). As meltwater exited the glacial margin, approximately N-S oriented channels were carved, and outwash was deposited in these sluiceways.
3.5. Post-Glacial Sediments
Following deglaciation, water levels in the Lake Superior basin varied due to fluctuating outlet elevations and climate conditions (e.g. CitationBlewett, 2012; CitationHough, 1958; Citation1959). Lake Nipissing occupied the Upper Great Lakes basins (Lakes Superior, Michigan, and Huron) approximately 5 ka (e.g. CitationLarson & Schaetzl, 2001). Lake Nipissing closely mimicked the present Upper Great Lakes shorelines with water levels several meters higher than current levels. In the Pictured Rocks region, the Nipissing shoreline occurs approximately 12 m (40 ft) above Lake Superior (CitationBlewett, 2012).
The modern beach complex was developed as Holocene sand accumulated along the shoreline as water levels dropped from Lake Nipissing to present day levels. Twelvemile Beach is a stretch of Holocene sand (Qb) along Lake Superior in the Trappers Lake, Au Sable Point SW, and Au Sable Point quadrangles that connects the bedrock cliffs in the west (mainly composed of the Munising and Au Train Formations) to the wave-cut bedrock platform exposed at Au Sable Point (Jacobsville Formation).
The Grand Sable Dunes are a perched dune system along the Lake Superior coast in the Grand Sable Lake quadrangle that rise almost 122 m (400 ft) above the current water level of Lake Superior. The Grand Sable Banks consist of the northern bluff of the highest kame terrace (Qkt1), and transitions to Qkt5 in the east. The Grand Sable Dunes initially developed with rising water levels of Lake Nipissing approximately 5 ka, episodically building and stabilizing in response to water levels in the Lake Superior basin (CitationAnderton & Loope, 1995; CitationFarrell & Hughes, 1985; CitationLoope et al., 2004). The bluff is destabilized during periods of high Lake Superior water levels, which allows predominant northwest winds to blow sand up the bluff, and the windblown sand (Qb) is then deposited as part of the dune system that is ‘perched’ on top of the much larger glacial landforms (Qkt1 and Qkt5; CitationAnderton & Loope, 1995; CitationFarrell & Hughes, 1985; CitationLoope et al., 2004). Lower water levels allow for bluff stabilization; therefore, active dune building ends during these periods.
3.5.1. Textural Analysis
All sediment samples involved in textural analysis indicated either medium or fine sand (0.250 and 0.125 mm particle diameter, respectively) composing the largest percentage of sample weight. The percentages of fines within all but five samples were under 3% by weight. Undifferentiated thin sediment above bedrock (Qts) and diamicton ridges (Qd) typically yielded the highest percentages of fines, ranging between 6-13% by weight. No grain size grain size differences or trends that could further define and distinguish between the various outwash units were detected from textural analysis results.
4. Conclusions
Detailed surficial geology mapping of the Pictured Rocks region revealed that the western quadrangles are characterized by shallow bedrock and thin sediment accumulations, as well as the exposed bedrock cliffs along the Lake Superior shoreline. These quadrangles also display subtle subglacial and ice-marginal landforms such as drumlins, eskers, and low-relief diamicton ridges. These small ridges appear to trace former ice margin positions that connect to positions along the crests of the Grand Marais and Munising outwash fan complexes in the eastern quadrangles. The eastern quadrangles display larger glaciofluvial landforms that are composed of thicker accumulations of outwash.
The high-resolution LiDAR DEM and associated hillshade proved essential to differentiate between outwash units and to locate and interpret subtle features in the western quadrangles (diamicton ridges and several eskers), which would otherwise have remained unrecognized. Textural analysis did not indicate significant grain size differences between various outwash units, though topographic patterns were used to distinguish and delineate these units. Because of the high-resolution elevation data, the Munising and Grand Marais outwash fans could be differentiated and delineated in detail for the first time.
This new, detailed surficial geology map provides fundamental information that can be used to help reconstruct the past glacial history in this region. Additionally, map information can enhance interpretations of glacial and post-glacial landform development and evolution. Like all surficial geology maps, this map provides a basic foundation for subsequent research, such as continued surficial geology mapping, aquifer delineation and protection, resource exploration, and local maintenance and/or development strategies.
Software
Field mapping locations were determined using a combination of aerial imagery (viewed via Google Earth software) and a high-resolution LiDAR DEM, viewed with ESRI ArcMap10 software. Passive seismic data were processed using GRILLA software. The surficial geology map was produced one quadrangle at a time (each at a 1:24,000-scale, but all ten are fully presented at a 1:62,500-scale) using ESRI ArcMap10 software by viewing/integrating several datasets into ESRI ArcMap10 (e.g. LiDAR DEM and hillshade, aerial imagery, soil classifications, existing reports, etc.).
Geolocation Information
Pictured Rocks National Lakeshore general GPS coordinates: 46.56435642, -86.31628733.
Supplemental Material
Download PDF (28.1 MB)Acknowledgements
This work was partially supported by the United States Geological Survey National Cooperative Geologic Mapping Program EDMAP award number G15AC00158 (2015); and the National Park Service Geoscientists-in-the-Park (GIP) program in partnership with AmeriCorps, the Conservation Legacy Environmental Stewards program, and the Geological Society of America (2016–2017). The authors appreciate the help of the following individuals for data collection and project collaboration: Dr. El Hachemi Bouali (Trinity College; Michigan Technological University); Dr. William Sauck (Western Michigan University); Dr. Walter Loope (United States Geological Survey); John Esch (Michigan Department of Environmental Quality); Sita Karki (Western Michigan University and the Michigan Geological Survey); Bruce Heise and Bruce Leutscher (National Park Service); and Tim Connors, Jim Chappell, Jason Kenworthy, Stephanie O’Meara, and James Winter (National Park Service).
Disclosure statement
No potential conflict of interest was reported by the author(s).
Additional information
Funding
Related Research Data
References
- American Society for Testing and Materials . (1970). Special procedures for testing soil and rock for engineering purposes. In J. P. Gnaedinger , & W. G. Holtz (Eds.), ASTM Special Technical Publication 479 , 2487–1969.
- Anderton, J. , & Loope, W. (1995). Buried soils in a perched dunefield as indicators of Late Holocene lake-level change in the Lake Superior basin. Quaternary Research , 44 , 190–199. https://doi.org/10.1006/qres.1995.1063
- Bergquist, S. G. (1936). The Pleistocene history of the Tahquamenon and Manistique Drainage region of the northern Peninsula of Michigan. Michigan Geological Survey Publication , 40 (part 1), 7–148.
- Blewett, W. L. (1994). Late Wisconsin history of Pictured Rocks National Lakeshore and vicinity: Pictured Rocks Resource Report #94-01: National Park Service . U.S. Government Printing Office. p. 1–8.
- Blewett, W. L. (2012). Geology and landscape of Michigan’s Pictured Rocks National Lakeshore and Vicinity . Wayne State University Press.
- Blewett, W. L. , Drzyzga, S. A. , Sherrod, L. , & Wang, H. (2014). Geomorphic relations among glacial Lake Algonquin and the Munising and Grand Marais moraines in eastern Upper Michigan, USA. Geomorphology , 219 , 270–284. https://doi.org/10.1016/j.geomorph.2014.05.009
- Blewett, W. L. , & Rieck, R. L. (1987). Reinterpretation of a portion of the Munising moraine in northern Michigan. Geological Society of America Bulletin , 98 , 169–175. https://doi.org/10.1130/0016-7606(1987)98<169:ROAPOT>2.0.CO;2
- Drexler, C. W. , Farrand, W. R. , & Hughes, J. D. (1983). Correlation of Glacial Lakes in the Superior basin with eastward discharge events from Lake Agassiz. In J. T. Teller , & L. Clayton (Eds.), Glacial Lake Agassiz - Geological Association of Canada Special Paper 26 (pp. 309–329).
- Esch, J. M. (2016). Personal communication: HVSR passive seismic calibration equation for the Upper Peninsula of Michigan.
- Esch, J. M. , & Sauck, W. A. (2015). Evaluation of the horizontal-to-vertical spectral ratio (HVSR) passive seismic method for bedrock depth determination in Michigan. Abstracts with Programs - Geological Society of America , 47 (5), 74.
- Farrell, J. P. , & Hughes, J. D. (1985). Long term implications, from a geomorphological standpoint, of maintaining H-58 in its present location at Grand Sable Lake: National Park Service Contract Report 60000-4-0839, Available at the Pictured Rocks National Lakeshore Headquarters, Munising, Michigan.
- Haddox, C. A. , & Dott, R. H. J. (1990). Cambrian shoreline deposits in northern Michigan. Journal of Sedimentary Petrology , 60 (5), 697–716. https://doi.org/10.1306/212F9250-2B24-11D7-8648000102C1865D
- Hamblin, W. K. (1958). The Cambrian sandstones of northern Michigan: Michigan Department of Conservation. Geological Survey Division, Publication 51, 146.
- Hough, J. L. (1958). Geology of the Great Lakes . University of Illinois Press.
- Hough, J. L. (1959). Geologic framework of the Great Lakes basins. Bulletin of the Geological Society of America , 70 , 1806–1807.
- Hughes, J. (1989). When Green Bay was a valley. In J. C. Palmquist (Ed.), The Au Train-Whitefish-Green Bay spillway . (pp. 49–65). Perin Press.
- Kehew, A. E. , Piotrowski, J. A. , & Jørgensen, F. (2012). Tunnel valleys: Concepts and controversies - A review. Earth-Science Reviews , 113 (1–2), 33–58. https://doi.org/10.1016/j.earscirev.2012.02.002
- Larsen, C. E. (1987). Geological history of glacial Lake Algonquin and the upper Great Lakes. U.S. Geological Survey Bulletin, 1801, 35.
- Larson, G. J. , & Schaetzl, R. J. (2001). Origin and evolution of the Great Lakes. Journal of Great Lakes Research , 27 (4), 518–546. https://doi.org/10.1016/S0380-1330(01)70665-X
- Leverett, F. (1911). Map of the surface formations of the Northern Peninsula of Michigan: Michigan Department of Conservation, Geological Survey Division, map, 1:380,160 scale.
- Leverett, F. (1929). Moraines and shorelines of the Lake Superior region: U.S. Geological Survey Professional Paper 154-A.
- Loope, W. L. , Fisher, T. G. , Jol, H. M. , Goble, R. J. , Anderton, J. B. , & Blewett, W. L. (2004). A Holocene history of dune-mediated landscape change along the southeastern shore of Lake Superior. Geomorphology , 61 , 303–322. https://doi.org/10.1016/j.geomorph.2004.01.005
- Malone, D. H. , Stein, C. A. , Craddock, J. P. , Kley, J. , Stein, S. , & Malone, J. E. (2016). Maximum depositional age of the Neoproterozoic Jacobsville sandstone, Michigan: Implications for the evolution of the Midcontinent Rift. Geosphere , 12 (4), 1271–1282. https://doi.org/10.1130/GES01302.1
- Martin, H. M. (1957). Map of the surface formations of the Northern Peninsula of Michigan: Michigan Department of Conservation, Geological Survey Division, 1:500,000 scale.
- Miller, J. F. , Ethington, R. L. , & Rosé, R. (2006). Stratigraphic implications of Lower Ordovician conodonts from the Munising and Au Train Formations at Pictured Rocks National Lakeshore, Upper Peninsula of Michigan. Palaios , 21 , 227–237. https://doi.org/10.2110/palo.2004.p04-50
- Milstein, R. L. (1987). Pictured Rocks National Lakeshore, northern Michigan. In D. L. Biggs (Ed.), Geological society of America Centennial field guide – north-central section (pp. 277–280).
- Patterson, C. J. , Regis, R. , Rausch, D. E. , & Wattrus, N. (2003). Subglacial drainageways preserved on the floors of Lakes Superior and Michigan: Abstracts with Programs. Geological Society of America , 35 (6), 297–298.
- Regis, R. S. , Jennings-Patterson, C. , Wattrus, N. , & Rausch, D. (2003). Relationship of deep troughs in the eastern Lake Superior basin and large-scale glaciofluvial landforms in the central Upper Peninsula of Michigan: Abstracts with Programs. Geological Society of America , 35 (2), 55.
- Schwenner, C. F. (2013). Soil Survey of Alger County . U.S. Department of Agriculture, Natural Resources Conservation Service and Forest Service.
- VanderMeer, S. M. (2018). Mapping and interpreting the glacial geology of pictured rocks National Lakeshore . Western Michigan University. 238 p.