
ABSTRACT
The study presents a 1:3300 scale map, encompassing an area of 1.05 km2, depicting the first detailed map of the shallow-water water hydrothermal system in Paleochori Bay, Milos, Greece. The seafloor was mapped using orthophotos acquired by a drone survey and processed using ArcGIS. The map shows the distribution of white microbial mats, former microbial mats, sea grass and ‘normal’ sand down to a depth of 15 m. Generation of a comprehensive map with native shapefiles and layer files, where any GPS coordinate in Paleochori Bay can be obtained, allows to target specific locations for data collection, rather than resorting to vague site descriptions, as has been the practice in the past. Sea floor temperature measurements carried out by Scuba divers in conjunction with GPS coordinates were mapped and interpolated to evaluate the temperature distribution in Paleochori Bay, which in turn supports the overall understanding of the hydrothermal system.
1. Introduction
Historically, most research on marine hydrothermal venting focused primarily on deep-sea black smoker-type locations, although hydrothermal venting is not confined to the deeper parts of the ocean. Recent studies point towards an abundance of hydrothermal venting in shallow marine, near shore environments. Approximately 70 such locations, which are generally described as ‘marine shallow-water hydrothermal systems’ (MSWHS), have been documented (CitationPrice & Giovannelli, 2017). This type of hydrothermal activity can have a considerable impact on the biologically important coastal ocean by creating micro-environments due to the discharge of reduced, hot hydrothermal fluids often containing potentially toxic elements (CitationBrinkhoff et al., 1999; CitationChen et al., 2018; CitationKleint et al., 2017; CitationMarani et al., 1997; CitationMeyer-Dombard et al., 2012; CitationPichler, 2005; CitationPichler & Veizer, 2004; CitationPrice et al., 2007; CitationRistova et al., 2017; CitationRuiz-Chancho et al., 2013; CitationStanulla et al., 2017). Although presently not adequately measured, there are convincing indications that flux from MSWHS could be a considerable source of heavy metals and metalloids, such as Hg, Pb, Sb and (CitationCanet et al., 2005; CitationGodelitsas et al., 2015; CitationLeal-Acosta et al., 2013; CitationMarani et al., 1997; CitationPrice et al., 2013b; CitationStoffers et al., 1999). Since the flux of hydrothermal fluid and gas can be difficult to measure, flux estimates currently exist only for a few MSWHS (CitationChen et al., 2018; CitationDando et al., 1995; CitationForrest et al., 2005; CitationPichler et al., 1999). Thus, to reliably estimate contributions from MSWHS to global oceanic cycles, additional flux estimations are crucial.
One of the best-studied MSWHS is located in Paleochori Bay on the south side of Milos Island, Greece (36°40’N, 24°31’E). There, hydrothermal fluids discharge at depths between 2 and 15 m below sea level across an area of about 1000 by 500 m. However, despite more than 25 years of research in Paleochori Bay, no dependable biogeochemical model concerning the interaction between hydrothermal and biological processes exists, nor do we have reliable repeat measurements at single locations to record chemical and biological changes with time. This is owed to the fact that the study area of about 500,000 m2 is too large to cover in short time and underwater orientation in the bay is challenging. To date, there are no GPS coordinates given for any of the sites studied and thus, although descriptions of the general locations and characteristics of vent sites exist for most of the investigations, returning to those specific sites is virtually impossible. Authors often refer to sampled sites with vague descriptions and names such as, ‘Rocky Point’, named for its location near a large rock outcrop offshore (CitationGodelitsas et al., 2015; CitationPrice et al., 2013a). A lack of GPS coordinates for the studied locations makes it difficult, if not impossible to exactly revisit study/sampling sites. To overcome that limitation, our study aimed to address this problem by creating an accurate geo-referenced map of Palaeochori Bay using aerial photography.
Aerial photography and mapping either by plane or drone has been successfully applied in shallow, near shore marine environments during studies of submarine groundwater discharge and for monitoring of coral reef development (CitationCasella et al., 2016, Citation2017; CitationJohnson et al., 2008), but to date has not been applied to MSWHS. With this in mind, we created a map of Paleochori Bay from high-resolution, geo-referenced aerial photos, which were collected by drone. The orthophoto was exported into the ArcGIS software package, where GPS coordinates can be picked for any pixel on the image. With the possibility to obtain GPS coordinates on the image, it was possible to pick the exact locations for sample collection, including temperature and flux measurements. Furthermore, it was possible to correlate hydrothermal features between their actual occurrence and their representation on the map, i.e. to ground-truth the aerial photograph. This work has significance beyond Paleochori Bay since this approach will be easily transferable to other sites of MSWHS worldwide.
2. Study area
Milos is an island arc volcano within the Hellenic Volcanic Arc in the Aegean Sea that was formed during the closure of Tethys Ocean because of the collision of African and Aegean continental plates (CitationMcKenzie, 1972). The island is almost entirely composed of acid volcanic and volcaniclastic rocks lying on the metamorphic and sedimentary basement (CitationMegalovasilis, 2014; CitationPapachristou et al., 2014). Milos potentially hosts one of the largest shallow-water water hydrothermal systems in the world with an area of venting estimated at 35 km2 (; CitationDando et al., 1995).
Figure 1. (a) Hydrothermally active island of Milos (highlighted in red) located within the Hellenic Volcanic Arc. (b) Close-up of Milos and the study site of Palaeochori Bay. The shaded area around the island represents the extent (35 km2) of observed hydrothermal activity on the island (CitationDando et al., 1995).
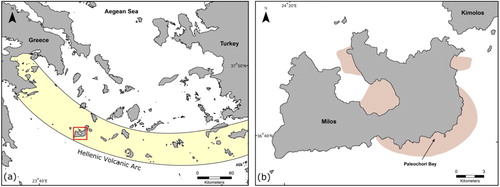
The most active hydrothermal area is Paleochori Bay in the south-eastern region of the island (). In Paleochori Bay, the hydrothermal fluids are acidic (pH ≈ 5), hot (up to 122 °C), highly sulfidic (up to 3 mM H2S), discharging intermittently in an area of approximately 1000 m by 500 m (; e.g. CitationValsami-Jones et al., 2005). The seafloor in Paleochori Bay is covered by sediments (sand) of volcanic origin and slopes gradually to a depth of 15 m about 500 m offshore. In areas where hydrothermal discharge occurs, the sediments are colored white and yellow-orange, due to the formation of bacterial mats, hosting chemolithotrophic sulfur oxidizing and sulfate-reducing bacteria (e.g. CitationYücel et al., 2013). In addition, the sediments can also be colored reddish and yellowish due to the precipitation of hydrous ferric oxides and arsenic sulfides from the hydrothermal fluids (e.g. CitationGodelitsas et al., 2015). The white areas, which are by far the most abundant ((c)), are easily discerned in the aerial photos taken by drone. The different colors are related to different sediment temperatures and hence different hydrothermal fluid temperatures, where the white areas have temperatures ranging from 45 to >80 °C, while reddish and yellowish sediments have slightly lower temperatures. The reddish and yellowish colors typically surround the white areas ((c)). The hottest areas (> 85 °C) are often characterized by a bright yellowish to yellow-orange precipitate, which are exclusively found in the center of the white areas ((c)).
Figure 2. An aerial map of Palaeochori bay produced using 156 photographs from an UAS survey in 2016. White areas indicate bacterial mats, which formed due to the discharge of hydrothermal fluids. The darker areas are sea grass meadows.
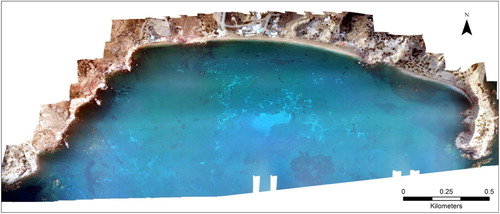
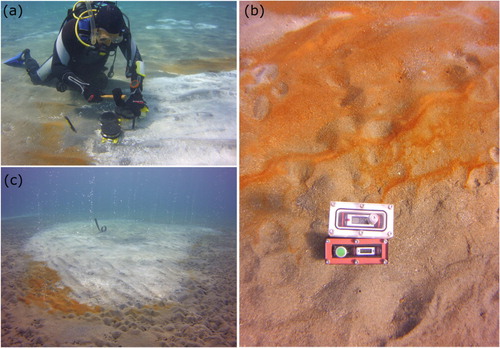
Figure 3. (a) Sampling the bacterial mats, (b) Temperature measurements using the custom-built temperature probe, (c) Typical seafloor features in Paleochori bay showing gaseous discharge, white bacterial mats and yellow-orange hydrothermal precipitates. Water depth is around 4 m. The images were captured with a SeaLife Micro 2.0 underwater camera with a high resolution 16MP SONY® Image Sensor.
3. Aerial photography and map generation
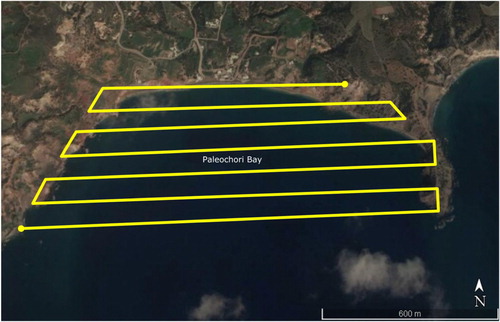
The detailed mapping of the shallow water hydrothermal system in Paleochori Bay was based on aerial imagery collected in October 2016 by an unmanned aircraft system (UAS) consisting of an unmanned aerial vehicle (drone), a ground-based controller, a system of communications between the two and off-the-shelf software to calculate and execute flight patterns. The survey for the main map was carried out at an altitude of 200 m, which allowed us to obtain a Ground Sample Distance (GSD) of 6.73 cm/pixel. We used an off-the-shelf drone, Mavic Pro by DJI, equipped with a 12.7-megapixel camera. The camera is embedded in the drone, and is mounted on a three-axis gimbal support to ensure the maximum stability and image sharpness. The images were geotagged automatically by to the built-in GPS receiver in the drone. The flight patterns were determined and executed using the off-the-shelf software package Map Pilot by Maps Made Easy, which was installed on an over-the-counter smartphone. Missions were generally flown in the mornings to assure calm conditions and hence a smooth water surface in Paleochori Bay. shows the flight pattern of the survey. We used a forward overlap greater than 60% and a side overlap of 75%. The Main Map was created using 156 high-resolution photos collected over a single drone flight with a maximum speed of 15 ms−1, covering a sea area of 1.05 km2.
Figure 4. Flight plan for the UAS survey. The flight plan was calculated using the MapPilot software.
The drone images were analyzed using the software Agisoft PhotoScan, which uses photogrammetric and Structure-From-Motion algorithms to align the images. Following the alignment, we built a point-cloud counting ∼ 46.8 million points with a density of 44.6 points/m2. This point-cloud was calculated using the GPS camera positions as recorded from the drone, and it was then converted into to an orthomosaic with a cell size 7.8 × 6.0 cm (GSD 6.3 cm/pixel). The orthomosaic was then georeferenced to UTM 35N coordinate system using seven ground control points (GCPs) collected on the ground by selecting identifiable terrestrial features on the map. GCPs were measured with a Trimble differential GPS (dGPS) system receiving sub-meter, real time Omnistar HP corrections. The resulting ortho-rectified image () was exported to ArcGIS, allowing for the extraction of coordinates for any pixel of the map; hence, the opportunity to pick the exact locations for sample collection, including porewater and temperature measurements.
4. Classification and verification
The aerial imagery () was classified using a supervised classification in ArcGIS (Main Map). This approach has been tried in the past by several studies, especially for monitoring vegetation health and land cover classification (CitationDell et al., 2019; CitationGoldblatt et al., 2017; CitationMattupalli et al., 2018; CitationUpadhyay et al., 2016). The maximum likelihood classification rule was used in the classification of the white areas. The process involves creating a signature file of training samples (sea floor features in this instance) and uses mean vector and the covariance matrix of a class to calculate the probability that a given pixel belongs to that specific class, assuming the class sample distribution is normal. The bright white areas were classified as ‘Bacterial mats’, the darker and paler white areas were manually classified as ‘Former bacterial mats’ and the dark grey areas were classified as ‘Sea grass’. It was not deemed necessary to classify the remaining area, which represents the sandy seafloor in Paleochori Bay.
Several locations were selected following the import of the digital image into ArcGIS for ground truthing (verification). The features (e.g. sand, sea grass, white zonations) that were identified aerially were subsequently confirmed underwater by Scuba divers and their coordinates were recorded using a handheld GPS (Garmin West Marine 76CS Plus).
5. Sampling
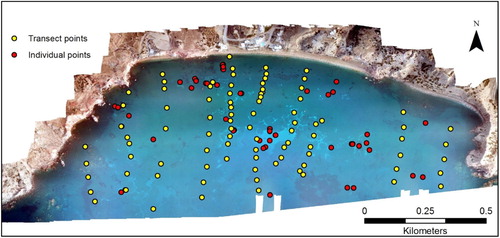
Once ground-truthing was completed this information was used to develop a sampling program, which spatially covered Paleochori Bay, while at the same time putting extra attention to the areas classified as ‘Bacterial mats’ and ‘Former bacterial mats’ (). The sampling program involved conducting ten transects roughly along the north–south axis with a distance of around 30 m between each sampling location. SCUBA divers were equipped with a compass to ensure transects were as close to the north–south axis as possible and each sampling location was recorded by GPS (Garmin West Marine 76CS Plus) (). Additionally, several additional locations, especially the white zonations, were selected for their geochemical importance. The divers, following the protocols established by CitationPrice et al. (2013b), collected sediment pore-water temperatures in-situ, at a sediment depth of 10 cm, using a temperature probe in a custom-built underwater housing ((b)). The temperature measurements were then exported to ArcGIS to show the temperature distribution patterns in Paleochori bay. Temperature points were converted to form a surface using Kriging interpolation method in ArcGIS. Kriging is best suited for datasets with a directional bias and is able to factor in the local and regional trends (CitationFoster et al., 2005; CitationHoldaway, 1996).
Figure 5. Map showing the sampling locations. Ten transects with the aim to spatially cover the bay were planned in addition to the several individual locations in the areas of interest.
6. Results and discussion
Our study, for the first time, provided a seabed classification map for the hydrothermally active Paleochori Bay (Main Map). Such maps are essential in establishing the importance of MSWHS to the local ecosystems and in understanding the elemental cycling in hydrothermal systems, especially those of potentially toxic heavy metals and metalloids (e.g. CitationBreuer & Pichler, 2013). Therefore, a detailed knowledge of the shallow-water hydrothermal system in Paleochori Bay is necessary to ascertain the impacts of such heavy metals from regional to global scales. In this study, we explored a standard procedure that could be applied to other shallow-water hydrothermal systems to create detailed maps of such regions. The combination such a map with field measurements, such as temperature, for example allows to relate heat-flux to ocean floor features (). This work can then be easily expanded to include other chemical and biological parameters.
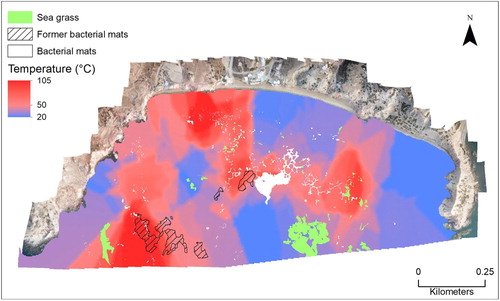
Figure 6. Temperature contour image of Paleochori Bay. The contours were created using the Contour tool in ArcGIS after the temperature data was interpolated across Paleochori Bay.
The identification of different classes in the map that was created from the aerial represent the variation in temperature and physicochemical conditions in Paleochori Bay. They were identified using the classification algorithms complemented with direct observations during the sampling process and then manually digitized to correct for discrepancies. The background and sea grass could not be easily distinguished using the supervised classification techniques and therefore, were manually digitized on the map in ArcGIS as different feature classes. The brightest white areas were most accurately classified in the ‘Bacterial mats’ class while some of the paler white areas were not identified accurately and thus were manually digitized into the ‘Former bacterial mats’ class. These are areas on the seafloor where bacterial mats were present, but currently are no longer active, while retaining a whitish color and the shape of the mats. Observations by Scuba divers confirmed that these areas are still mildly hydrothermally active (e.g. elevated temperatures). The cause for their absence is unclear, but is most likely related to the amount of hydrothermal flux. Generally, sea grass does not occur in regions of white microbial mats. The absence of sea grass could be caused either by the presence of toxic metals and metalloids in the hydrothermal fluids or the elevated temperature around the white zonations. However, a combination of both effects is the most likely cause.
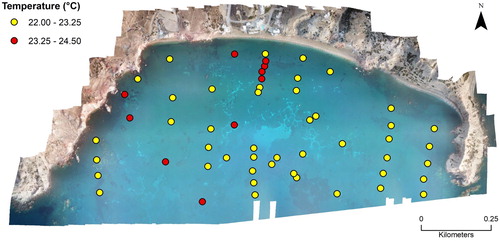
The temperature distribution map () was constructed by interpolating 141 individual data points. The map displays the magnitude of heat flux in Paleochori Bay, one of the most hydrothermally active regions in the Aegean Sea (CitationDando et al., 1995; CitationNaden et al., 2005). The individual temperature point measurements ranged from as low as 21.2 °C in the background class to the highest recorded temperature in Paleochori bay yet of 122.4 °C. Based on previous observations in the region, the bacterial mats are strongly correlated with higher temperatures and the data collected in this study confirms this (; CitationPrice et al., 2013a; CitationValsami-Jones et al., 2005; CitationYücel et al., 2013). There is a distinct trend in the temperature distribution across the bay as the western section of Paleochori bay appears to be warmer than the eastern section (). The relative lack of bacterial mats in the eastern section of the bay further supports the idea that the western part of the Paliochori bay is hydrothermally more active. The map in shows the distribution of the measurements considered to be the ‘non-hydrothermal’ or background temperature in the sediments in Paleochori Bay. The temperature data show that the background sediment temperatures in Paleochori Bay are generally less than 25 °C, and that they are similar to previously reported values (e.g. CitationPrice et al., 2013b; CitationValsami-Jones et al., 2005). The temperature distribution trend observed in , i.e. higher background temperatures in the western part of the bay, is the same as observed for the higher temperatures (). This has implications in determining the depth of the hydrothermal heat source. Since both the background and the hydrothermal vent samples, show a similar temperature distribution, the heat source must be shallow as it affects the whole bay. A deeper heat source should not produce the observed temperature trend in the non-hydrothermal area of the bay, as it cannot influence the background sediment samples. Whereas the hydrothermal fluids, delivered via fractures, cracks and fissures from deep beneath the surface (e.g. CitationPurnomo & Pichler, 2014), is responsible for the observation that the western Paleochori Bay is more hydrothermally active.
Figure 7. Locations where temperatures below 25°C were measured in the sediment in Paleochori Bay.
The parameters used to interpolate the data points can influence the resultant surface (CitationMeng et al., 2013; CitationSahlin et al., 2014; CitationWu & Li, 2013). In this study, kriging was selected over the other interpolation methods since it tends to produce the least biased linear outputs, despite it being more time-consuming (CitationMueller et al., 2004; CitationPhillips & Marks, 1996). The Focal statistics tool in ArcGIS was used to post-process the output produced using kriging interpolation, which was angular. The output of the focal statistics tool is a surface where each output cell is a function of the input values that are in the specified neighborhood, a circle of 3-cell radius in this case, around that location (CitationKumhálová et al., 2011; CitationPanagiotidis et al., 2017). Other interpolation methods, such as Natural neighbor and inverse-distance weighting (IDW), should be explored to ascertain the best method to represent the temperature distribution in Paleochori Bay. Additionally, it is paramount to obtain further temperature measurements across the bay to provide a better understanding of the heat flux in the region and reducing the spatial interpolation biases.
7. Conclusions
The existence of the hydrothermal system at shallow water depths of less than 15 m in Paleochori Bay, along with the relatively clear water conditions, allowed for the use of remote sensing techniques to map the bay. Hence, we generated several thematic maps of the hydrothermally active Paleochori Bay in Milos using aerial imagery collected by an unmanned aircraft system (UAS) consisting of an unmanned aerial vehicle (drone), a ground-based controller, a system of communications between the two and off-the-shelf software to calculate and execute flight patterns. Discernible features in the aerial imagery were subsequently confirmed and identified by Scuba divers (i.e. ground truthing). The so generated maps are the likely the most detailed depictions of the shallow-water water hydrothermal system in Paleochori Bay to date. The aerial imagery allowed detailed mapping of geochemically important microbial mats on the Paleochori seafloor, which formed due to the discharge of hydrothermal fluid. Field observations in conjunction with the aerial imagery provided a spatial understanding of the temperature distribution in the seafloor sediments. The temperature distribution patterns observed in Paleochori Bay () have long been speculated in the literature but not been proven. The data presented shows that the western Paleochori Bay is hydrothermally more active, something that is reflected in the background sand sediment temperatures, which were higher in the western part of the bay. The accuracy of the temperature distribution trends could be improved by additional field measurements, although is unlikely that the overall picture of temperature distribution would change.
In the past, it was difficult to reproduce results of scientific studies that were concerned with various aspects of the hydrothermal system in Paleochori Bay due to the difficulty (inability) to exactly revisit specific locations. Now this problem should be resolved since we have a comprehensive map with native shapefiles, where GPS coordinates of sampling locations can be obtained, which is available for future research in Paleochori Bay (Supplementary material S1). This approach has the potential to facilitate research of other shallow-water hydrothermal systems around the world. Nevertheless, it must be stated that map accuracy tends to decrease with increasing depths and thus could be improved by using underwater GPS devices instead of relying on hand-held GPS devices on the sea surface.
Software
The flight patterns for the drone were calculated with the software app Map Pilot by Maps Made Easy installed on an Apple iPhone. Image processing was carried out using Agisoft Photoscan. The map was produced by using Esri ArcMap 10.6 program, which is part of the ArcGIS package.
Open Scholarship


This article has earned the Center for Open Science badges for Open Data and Open Materials through Open Practices Disclosure. The data and materials are openly accessible at https://doi.pangaea.de/10.1594/PANGAEA.915881.
Supplemental Material
Download Zip (615.9 KB)Paleochori_Map.pdf
Download PDF (33 MB)Acknowledgements
The authors would like to thank the efforts of Athanasios Godelitsas, Hannah Roberts, Manuel Ruben, Cornelius Brombach and Roy Price who assisted in the field. AK particularly would like to thank Dr Elisa Casella for help with processing. The final version benefited from the comments made by three reviewers. The authors would like to thank Mike Vichos for excellent support during fieldwork on Milos.
Disclosure statement
No potential conflict of interest was reported by the author(s).
Supplementary Data
Supplementary material S1 – ESRI shapefiles of white zonations, former white zonations and sea grass to be used for future research in Paleochori Bay.
Additional information
Funding
Related Research Data
References
- Breuer, C. , & Pichler, T. (2013). Arsenic in marine hydrothermal fluids. Chemical Geology , 348 , 2–14. https://doi.org/10.1016/j.chemgeo.2012.10.044
- Brinkhoff, T. , Sievert, S. M. , Kuever, J. , & Muyzer, G. (1999). Distribution and diversity of sulfur-oxidizing Thiomicrospira spp. at a shallow-water hydrothermal vent in the Aegean Sea (Milos, Greece). Applied and Environmental Microbiology , 65 (9), 3843–3849. https://doi.org/10.1128/AEM.65.9.3843-3849.1999
- Canet, C. , Prol-Ledesma, R. M. , Proenza, J. A. , Rubio-Ramos, M. A. , Forrest, M. J. , Torres-Vera, M. A. , & Rodríguez-Díaz, A. A. (2005). Mn-Ba-Hg mineralization at shallow submarine hydrothermal vents in Bahía Concepción, Baja California Sur, Mexico. Chemical Geology , 224 (1–3), 96–112. https://doi.org/10.1016/j.chemgeo.2005.07.023
- Casella, E. , Collin, A. , Harris, D. , Ferse, S. , Bejarano, S. , Parravicini, V. , Hench, J. L. , & Rovere, A. (2017). Mapping coral reefs using consumer-grade drones and structure from motion photogrammetry techniques. Coral Reefs , 36 (1), 269–275. https://doi.org/10.1007/s00338-016-1522-0
- Casella, E. , Rovere, A. , Pedroncini, A. , Stark, C. P. , Casella, M. , Ferrari, M. , & Firpo, M. (2016). Drones as tools for monitoring beach topography changes in the Ligurian Sea (NW Mediterranean). Geo-Marine Letters , 36 (2), 151–163. https://doi.org/10.1007/s00367-016-0435-9
- Chen, X.-G. , Lyu, S.-S. , Garbe-Schönberg, D. , Lebrato, M. , Li, X. , Zhang, H.-Y. , Zhang, P.-P. , Chen, C.-T. A. , Ye, Y. , & Press, A. I. N. (2018). Heavy metals from Kueishantao shallow-sea hydrothermal vents, offshore northeast Taiwan. Journal of Marine Systems , 180 , 211–219. https://doi.org/10.1016/j.jmarsys.2016.11.018
- Dando, P. R. , Hughes, J. A. , Leahy, Y. , Niven, S. J. , Taylor, L. J. , & Smith, C. (1995). Gas venting rates from submarine hydrothermal areas around the Island of Milos, Hellenic Volcanic Arc. Continental Shelf Research , 15 (8), 913–929. https://doi.org/10.1016/0278-4343(95)80002-U
- Dell, M. , Stone, C. , Osborn, J. , Glen, M. , McCoull, C. , Rimbawanto, A. , Tjahyono, B. , & Mohammed, C. (2019). Detection of necrotic foliage in a young Eucalyptus pellita plantation using unmanned aerial vehicle RGB photography–a demonstration of concept. Australian Forestry , 82 (2), 79–88. https://doi.org/10.1080/00049158.2019.1621588
- Forrest, M. J. , Ledesma-Vázquez, J. , Ussler, W. , Kulongoski, J. T. , Hilton, D. R. , & Greene, H. G. (2005). Gas geochemistry of a shallow submarine hydrothermal vent associated with the El Requesón fault zone, Bahía Concepción, Baja California Sur, México. Chemical Geology , 224 (1–3), 82–95. https://doi.org/10.1016/j.chemgeo.2005.07.015
- Foster, S. , Maher, W. , Taylor, A. , Krikowa, F. , & Telford, K. (2005). Distribution and speciation of arsenic in temperate marine saltmarsh ecosystems. Environmental Chemistry , 2 (3), 177–189. https://doi.org/10.1071/EN05061
- Godelitsas, A. , Price, R. E. , Pichler, T. , Amend, J. , Gamaletsos, P. , & Göttlicher, J. (2015). Amorphous as-sulfide precipitates from the shallow-water hydrothermal vents off Milos Island (Greece). Marine Chemistry , 177 , 687–696. https://doi.org/10.1016/j.marchem.2015.09.004
- Goldblatt, R. , Ballesteros, A. R. , & Burney, J. (2017). High spatial resolution visual band imagery outperforms medium resolution Spectral imagery for ecosystem assessment in the semi-arid Brazilian Sertão. Remote Sensing , 9 , 1–26. https://doi.org/10.3390/rs9121336
- Holdaway, M. R. (1996). Spatial modeling and interpolation of monthly temperature using kriging. Climate Research , 6 , 215–225. https://doi.org/10.3354/cr006215
- Johnson, A. G. , Glenn, C. R. , Burnett, W. C. , Peterson, R. N. , & Lucey, P. G. (2008). Aerial infrared imaging reveals large nutrient-rich groundwater inputs to the ocean. Geophys. Res. Lett , 35 , 1–6. https://doi.org/10.1029/2008GL034574
- Kleint, C. , Pichler, T. , & Koschinsky, A. (2017). Geochemical characteristics, speciation and size-fractionation of iron (Fe) in two marine shallow-water hydrothermal systems, Dominica, Lesser Antilles. Chemical Geology , 454 , 44–53. https://doi.org/10.1016/j.chemgeo.2017.02.021
- Kumhálová, J. , Kumhála, F. , Kroulík, M. , & Matějková, Š . (2011). The impact of topography on soil properties and yield and the effects of weather conditions. Precision Agriculture , 12 (6), 813–830. https://doi.org/10.1007/s11119-011-9221-x
- Leal-Acosta, M. L. , Shumilin, E. , Mirlean, N. , Delgadillo-Hinojosa, F. , & Sánchez-Rodríguez, I. (2013). The impact of marine shallow-water hydrothermal venting on arsenic and mercury accumulation by seaweed Sargassum sinicola in Concepcion Bay, Gulf of California. Environmental Science: Processes & Impacts , 15 (2), 470–477. https://doi.org/10.1039/c2em30866e
- Marani, M. P. , Gamberi, F. , & Savelli, C. (1997). Shallow-water polymetallic sulfide deposits in the Aeolian island arc. Geology , 25 (9), 815–818. https://doi.org/10.1130/0091-7613(1997)025<0815:SWPSDI>2.3.CO;2
- Mattupalli, C. , Moffet, C. A. , Shah, K. N. , & Young, C. A. (2018). Supervised classification of RGB aerial imagery to evaluate the impact of a root rot disease. Remote Sensing , 10 (6), 917. https://doi.org/10.3390/rs10060917
- McKenzie, D. (1972). Active tectonics of the Mediterranean region. Geophysical Journal International , 30 (2), 109–185. https://doi.org/10.1111/j.1365-246X.1972.tb02351.x
- Megalovasilis, P. (2014). Partition geochemistry of hydrothermal precipitates from submarine hydrothermal fields in the Hellenic Volcanic Island Arc. Geochemistry International , 52 (11), 992–1010. https://doi.org/10.1134/S0016702914110044
- Meng, Q. , Liu, Z. , & Borders, B. E. (2013). Assessment of regression kriging for spatial interpolation – Comparisons of seven GIS interpolation methods. Cartography and Geographic Information Science , 40 (1), 28–39. https://doi.org/10.1080/15230406.2013.762138
- Meyer-Dombard, D. R. , Price, R. E. , Pichler, T. , & Amend, J. P. (2012). Prokaryotic populations in arsenic-rich shallow-sea hydrothermal sediments of Ambitle Island, Papua New Guinea. Geomicrobiology Journal , 29 (1), 1–17. https://doi.org/10.1080/01490451.2010.520073
- Mueller, T. G. , Pusuluri, N. B. , Mathias, K. K. , Cornelius, P. L. , Barnhisel, R. I. , & Shearer, S. A. (2004). Map quality for ordinary kriging and inverse distance weighted interpolation. Soil Science Society of America Journal , 68 (6), 2042–2047. https://doi.org/10.2136/sssaj2004.2042
- Naden, J. , Kilias, S. P. , & Darbyshire, D. P. F. (2005). Active geothermal systems with entrained seawater as modern analogs for transitional volcanic-hosted massive sulfide and continental magmato-hydrothermal mineralization: The example of Milos Island, Greece. Geology , 33 (7), 541–544. https://doi.org/10.1130/G21307.1
- Panagiotidis, D. , Abdollahnejad, A. , Surový, P. , & Chiteculo, V. (2017). Determining tree height and crown diameter from high-resolution UAV imagery. International Journal of Remote Sensing , 38 (8–10), 2392–2410. https://doi.org/10.1080/01431161.2016.1264028
- Papachristou, M. , Voudouris, K. , Karakatsanis, S. , D’Alessandro, W. , & Kyriakopoulos, K. (2014). Geological setting, geothermal conditions and hydrochemistry of south and southeastern Aegean geothermal systems. Geothermal Systems and Energy Resources: Turkey and Greece, 7, 47–75.
- Phillips, D. L. , & Marks, D. G. (1996). Spatial uncertainty analysis: Propagation of interpolation errors in spatially distributed models. Ecological Modelling , 91 (1–3), 213–229. https://doi.org/10.1016/0304-3800(95)00191-3
- Pichler, T. (2005). Stable and radiogenic isotopes as tracers for the origin, mixing and subsurface history of fluids in submarine shallow-water hydrothermal systems. Journal of Volcanology and Geothermal Research , 139 (3–4), 211–226. https://doi.org/10.1016/j.jvolgeores.2004.08.007
- Pichler, T. , & Veizer, J. (2004). The precipitation of aragonite from shallow-water hydrothermal fluids in a coral reef, Tutum Bay, Ambitle Island, Papua New Guinea. Chemical Geology , 207 (1–2), 31–45. https://doi.org/10.1016/j.chemgeo.2004.02.002
- Pichler, T. , Veizer, J. , & Hall, G. E. M. (1999). The chemical composition of shallow-water hydrothermal fluids in Tutum Bay, Ambitle Island, Papua New Guinea and their effect on ambient seawater. Marine Chemistry , 64 (3), 229–252. https://doi.org/10.1016/S0304-4203(98)00076-0
- Price, R. E. , Amend, J. P. , & Pichler, T. (2007). Enhanced geochemical gradients in a marine shallow-water hydrothermal system: Unusual arsenic speciation in horizontal and vertical pore water profiles. Applied Geochemistry , 22 (12), 2595–2605. https://doi.org/10.1016/j.apgeochem.2007.06.010
- Price, R. E. , & Giovannelli, D. (2017). A review of the geochemistry and microbiology of marine shallow-water hydrothermal vents. Reference Module in Earth Systems and Environmental Sciences . https://doi.org/10.1016/B978-0-12-409548-9.09523-3
- Price, R. E. , Lesniewski, R. , Nitzsche, K. S. , Meyerdierks, A. , Saltikov, C. , Pichler, T. , & Amend, J. P. (2013a). Archaeal and bacterial diversity in an arsenic-rich shallow-Sea hydrothermal system undergoing phase separation. Frontiers in Microbiology , 4 , 1–19. https://doi.org/10.3389/fmicb.2013.00158
- Price, R. E. , Savov, I. , Planer-Friedrich, B. , Bühring, S. I. , Amend, J. , & Pichler, T. (2013b). Processes influencing extreme as enrichment in shallow-sea hydrothermal fluids of Milos Island, greece. Chemical Geology , 348 , 15–26. https://doi.org/10.1016/j.chemgeo.2012.06.007
- Purnomo, B. J. , & Pichler, T. (2014). Geothermal systems on the island of Java, Indonesia. Journal of Volcanology and Geothermal Research , 285 , 47–59. doi: 10.1016/j.jvolgeores.2014.08.004
- Ristova, P. P. , Pichler, T. , Friedrich, M. W. , & Bühring, S. I. (2017). Bacterial diversity and biogeochemistry of two marine shallow-water hydrothermal systems off dominica (Lesser Antilles). Frontiers in Microbiology , 8 , 1–17. https://doi.org/10.3389/fmicb.2017.02400
- Ruiz-Chancho, M. J. , Pichler, T. , & Price, R. E. (2013). Arsenic occurrence and speciation in Cyclope neritea, a gastropod inhabiting the arsenic-rich marine shallow-water hydrothermal system off Milos Island, Greece. Chemical Geology , 348 , 56–64. https://doi.org/10.1016/j.chemgeo.2012.05.017
- Sahlin, J. , Mostafavi, M. A. , Forest, A. , & Babin, M. (2014). Assessment of 3D spatial interpolation methods for study of the marine pelagic environment. Marine Geodesy , 37 (2), 238–266. https://doi.org/10.1080/01490419.2014.902883
- Stanulla, R. , Stanulla, C. , Bogason, E. , Pohl, T. , & Merkel, B. (2017). Structural, geochemical, and mineralogical investigation of active hydrothermal fluid discharges at Strýtan hydrothermal chimney, Akureyri Bay, Eyjafjörður region, Iceland. Geothermal Energy , 5 (1). https://doi.org/10.1186/s40517-017-0065-0
- Stoffers, P. , Hannington, M. , Wright, I. , Herzig, P. , De Ronde, C. , Arpe, T. , Battershill, C. , Botz, R. , Britten, K. , Browne, P. , Cheminée, J. L. , Fricke, H. W. , Garbe-Schönberg, D. , Hekinian, R. , Hissman, K. , Huber, R. , Robertson, J. , Schauer, J. , Schmitt, M. , … Smith, I. (1999). Elemental mercury at submarine hydrothermal vents in the Bay of Plenty, Taupo volcanic zone, New Zealand. Geology , 27 (10), 931–934. https://doi.org/10.1130/0091-7613(1999)027<0931:EMASHV>2.3.CO;2
- Upadhyay, P. , Mahadik, S. , & Kamble, A. (2016). Image classification using visible RGB bands. In International Conference on Computing for Sustainable global development (INDIACom) (pp. 2660–2663).
- Valsami-Jones, E. , Baltatzis, E. , Bailey, E. H. , Boyce, A. J. , Alexander, J. L. , Magganas, A. , Anderson, L. , Waldron, S. , & Ragnarsdottir, K. V. (2005). The geochemistry of fluids from an active shallow submarine hydrothermal system: Milos Island, Hellenic Volcanic Arc. Journal of Volcanology and Geothermal Research , 148 (1–2), 130–151. https://doi.org/10.1016/j.jvolgeores.2005.03.018
- Wu, T. , & Li, Y. (2013). Spatial interpolation of temperature in the United States using residual kriging. Applied Geography , 44 , 112–120. https://doi.org/10.1016/j.apgeog.2013.07.012
- Yücel, M. , Sievert, S. M. , Vetriani, C. , Foustoukos, D. I. , Giovannelli, D. , & Le Bris, N. (2013). Eco-geochemical dynamics of a shallow-water hydrothermal vent system at Milos Island, Aegean Sea (Eastern Mediterranean). Chemical Geology , 356 , 11–20. https://doi.org/10.1016/j.chemgeo.2013.07.020