
ABSTRACT
Land capability classification is based on chemical and physical properties of soils for agricultural purposes. Objective of this study is the realization of the land capability map in the Vernazza catchment, an historically terraced landscape in the Cinque Terre National Park, recognized as a World Heritage site by UNESCO since 1997. A pedolandscape map with a descriptive legend, based on the soil-landscape paradigm for the prediction of soil classes and their spatial distribution, was produced. After, a land capability map was created by classifying the pedolandscape units to aid the sustainable territorial planning in the National Park. The results were plotted on a 1:4000 scale map with a descriptive legend. Land capability map is dominated by lands with severe limitation and only the 30% of the study area may be used for crops but it requires very careful management and conservation practice.
1. Introduction
Land capability classification (LCC) may be defined as a system of grouping land into various classes based on inherent limitations imposed on sustained use by soil attributes, topography, drainage and climate (CitationKlingebiel & Montgomery, 1961). An LCC map is a valid tool in helping land managers and land use planners to read the soil maps, to manage land considering soil proprieties and potentialities, to identify areas with physical constraints for a range of nominated land uses. In contrast to the CitationFAO's (1976) land suitability classification, which is a widely used framework for assessing physical land suitability for a specific use based on expert knowledge (CitationRellini et al., 2011), LCC is a broad evaluation for determining suitability for agro-silvo-pastoral use in general.
The objective of this study is the realization of a land capability map (Main Map) in an historical terraced coastal agricultural landscape in the Cinque Terre area, the Vernazza catchment, in northwestern Italy (Liguria Region, ). Because of its historical and environmental importance, Cinque Terre area is a National Park recognized as a World Heritage site by UNESCO since 1997.
Figure 1. Location of the study area in the region of Liguria (north-western Italy).
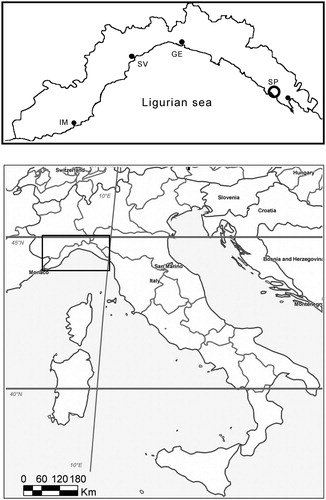
The Vernazza catchment, located along the Tyrrhenian side of the northern Apennines, shows typical geomorphological features characteristic for most of the Ligurian coastal catchments such as a small area (about 5.7 km2), very steep slopes due to the proximity of mountains to the sea and short streams.
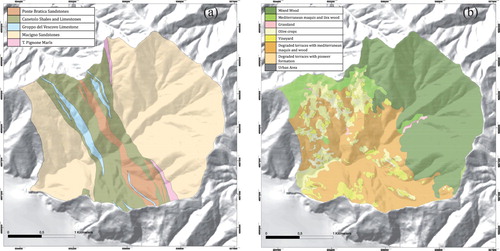
The bedrock is mainly composed of a sandstone-claystone flysch (Macigno Formation, Late Oligocene–Early Miocene) and a pelitic complex (Canetolo Shales and Limestones, Canetolo Unit, Cretaceous), (a). One particular land-use characterized all the Cinque Terre area and the slopes within the Vernazza catchment (CitationCevasco et al., 2013; b). These slopes have been almost completely terraced for vineyards and olive groves during the past millennium. Following the exodus of farmers in the last century, terraced slopes have been progressively abandoned and covered by Mediterranean scrub and pine. In the upper part of the catchment, where the slopes were not terraced, the mixed mesophylls wood is dominant.
Figure 2. Study area: geological map (a) and land use types (b).
The aim of the land capability analysis in the Vernazza catchment is to provide useful information for territorial planning in the National Park. There is a growing need for interpreted soil information for policy making. New emerging policy areas are demanding detailed, updated and policy relevant soil information that can underpin the decision-making process (CitationMontanarella, 2010).
2. Materials and methods
2.1. The pedo-landscape map of Vernazza catchment
The pedo-landscape map in this study was developed following a strategy based on the concept of soil formation factors coupled with soil-landscape relationships (CitationHudson, 1992) and using a GIS approach (CitationRellini et al., 2017). In these terms, the local patterns of topography or relief, parent material, and time, along with their relationships to land use and microclimate, can be used to predict the types of soils in small areas (CitationUSDA, 1993). To create the map unit, we superimposed the topographic information layer derived from the DEM and all the layers related to the accessory information traditionally collected in soil surveys and now available in digital form (such as vegetation patterns, geomorphology, geology, and land use). In a GIS environment (ArcGIS 9.2 Desktop©, CitationESRI, 2006) all these environmental data of the area were analyzed: first, we processed a 5-m-resolution digital elevation model (DEM). The DEM was based on an interpolation of contour lines from a 1:5000 topographic map (CitationRegione Liguria, 2007) using a thin plate spline algorithm proposed by CitationHutchinson (1996). The DEM was preprocessed with low-pass filtering to artefacts and errors, such as local noise and terraces (CitationVorpahl et al., 2012), using SAGA GIS (Saga 6.3©, CitationConrad et al., 2015). The DEM was then hydrologically corrected to eliminate sinks using the algorithm proposed by CitationPlanchon and Darboux (2001). Then, derived attributes, such as slope gradient and wetness index, were calculated from DEM by using SAGA GIS (Saga 6.3©, CitationConrad et al., 2015).
One or more representative soil profiles were described for each map unit following CitationCostantini (2007). The laboratory soil analyses were performed by the Regional Soil Analysis Laboratory in Sarzana (Spezia, Liguria) (ISO 9001 certified). For each soil sample from each horizon, the routine laboratory procedures and analyses were performed according to the CitationMinistero delle Politiche Agricole e Forestali (2000): particle size distribution, pH, total carbonate, total organic carbon, cation exchange capacity, concentrations of extracted chemical elements.
Thus, after linking the soil information to the first draft of the map unit, the spatial distribution and variability of the most extensive soil types were reproduced in GIS and presented in a pedo-landscape map, with a descriptive legend based on World Reference Base (WRB) classification (CitationIUSS, 2015).
2.2. The land capability classification map of Vernazza catchment
To draw the LCC map (Main Map), we followed the LCC procedure manual (CitationKlingebiel & Montgomery, 1961). For each pedo-landscape unit, we analyzed the parameters in . Parameters analyzed were: proprieties of land (as erosion rate, runoff, climatic limitation etc.) and soil proprieties (as texture, presence of gravel, pH, Cation Exchange Capacity and Base Saturation of superficial horizon etc.). Land capability class of a specific unit is determined by its most limiting parameter. There are eight classes and the numbers indicate progressively greater limitations and narrower choices for practical use ( – classes LCC).
Table 1. Parameters used for LCC.
Table 2. Classes of LCC.
Land capability subclasses were defined adding a letter E, W, S or C to the class numeral to indicate the main restrictive parameter. For example, the letter E shows that the main hazard is the risk of erosion unless close-growing plant cover is maintained; W shows that water in or on the soil interferes with plant growth or cultivation (in some soils the wetness can be partly corrected by artificial drainage); S shows that the soil is limited mainly because it is shallow, droughty, or stony; and C, shows that the chief limitation is climate that is very cold or very dry.
In our study we classified all the map units; for the pedo-landscape unit map with a soil association, we gave to soil map the class of dominant soil. Results are presented in . In this perspective, the pedo-landscapes represent homogeneous areas by type and intensity of the pedogenetic process where the same type of sustainable use is conceivable.
Table 3. LCC of the pedo-landscape unit map.
3. Results and discussion
As shown in the pedo-landscape map (Main Map), soils in the area are identified in three Reference Soil Groups (RSGs) among the 28 soil profiles: Cambisol, Regosol and Leptosol.
Cambisols include soils with at least incipient subsurface soil formation. They are characterized by moderate weathering of the parent material, early stages of horizon differentiation and evident changes in soil structure, color and clay content. Cambisols are the most extensive RSG in the study area (45%) on linear slopes, but it is possible to find them also on terraced slopes with vineyard cultivation; they are deep soils with high useful depth (150 cm).
Regosols are very weakly developed soils in unconsolidated material originating from different rocks types (see pedo-landscape map legend) and have no diagnostic horizons. Regosols (36%) are a common soil type within the study area, found on the terraced slopes and in highly eroded areas in the upper parts of the catchment.
Leptosols are very shallow soils with continuous rocks very close to the surface or soils that are extremely gravelly. Leptosols are also a less common soil group in the study area (20%), found in areas with very steep slopes with severe erosion or in long abandoned terraces.
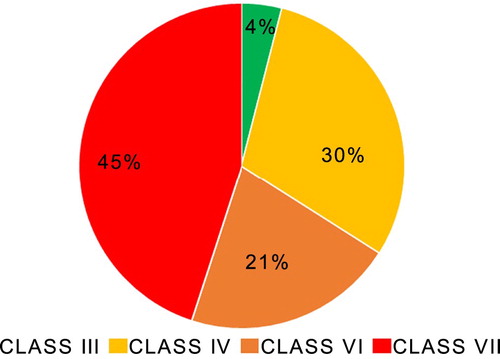
As regards the land capability analysis, the results can be seen in . They show that, in the study area, Class I, II, V and VIII are not present; Land capability class in the study area is dominated by land capability classes IV (30% of the area) and VII (45% of the area) whit various limitation factors namely percent of stoniness, presence of coarse fragments, useful depth and slope gradient.
Figure 3. Results of land capability analysis.
The absence of Class I and II, which are classes with few limitations and suitable for crops, pasture, range, forest production, woodland and industrial plant (CitationKlingebiel & Montgomery, 1961) can be explained with the fact that in the study area not all plantations are possible. The study area is not suitable for extensive agriculture: the presence of steep slopes, stoniness, coarse fragments and low useful depth had allowed, in time, only the cultivation of grapes and olive on terraced slopes. These two crops have not particular requirement in soil characteristics, and they grow well in poor soil with superficial stones and gravels in the soil.
The grapevine is a fairly tolerant plant, growing on both alkaline soils and acidic soils. Poor nutrient soil enhances quality while rich nutrient, deep soil is more favorable for quantity. Root growth depends on soil depth, texture and the proportions of fine soil and pebbles. However, soil is rarely a limiting factor. The quality of the soil has an influence on the kind of wine production, but not on grape growing (CitationCostantini, 2006).
Olive trees are more tolerant than other fruit trees, generally requiring shallow, sandy soil with stones and gravels. Above all, the presence of stones, considered for other crops a restrictive parameter, guarantees a better drainage condition for olive growth (CitationCostantini, 2006).
This is the reason why, for millennium, the production of wine and oil has been the only production possible and present in the area.
As consequence, in our study area, land capability Class III (4% of total area) and IV (30% of the area) are generally located on terraced slopes with vineyards and olive crops or abandoned terraces from recent time, with shrub or scrubland (maquis). For a correct and suitable management of these lands, land capability results suggest to keep cultivating the terraces with vineyard and olive trees. In fact, the presence of cultivated terraces allows the conservation of soil depth, the reducing of erosion rate, the removal of big rocks that are the limiting parameters present in Class VI. In this class (21% of total area), we find land generally located on degraded terraces from a long period, with scrubland and wood, or land without terraces with a scrubland as vegetation cover. The conservation of terraces in the lowest part of the area, corresponding to LCC III and IV, is strongly recommended also for the valorization of the landscape, leading to the protection of cultural history and local economy. Above all the vineyards in Cinque Terre, represent a strong resource for small or medium-size holdings, producing famous local wine with the denomination DOC – Controlled Designation of Origin ‘Cinque Terre’ and ‘Cinque Terre Sciacchetrà’ (CitationRellini et al., 2019). Moreover, olive groves must be preserved, also as a non-productive olive, just to protect soil and terraces.
Class VII, which is the most representative class with more than 45% of area, is a class where lands have very severe limitations that make them unsuited to cultivation and that restrict their use largely to grazing, woodland or wildlife, protect forest and nature reserve (CitationKlingebiel & Montgomery, 1961). In our study area we find mainly above all on linear slopes, without terraces, covered by mesophylls broad – leaved forest or pinewood. Limiting parameters are, consequentially, the slope, the soil depth and the erosion rate. The capability classification for these lands suggests a conservation of natural vegetation to protect soil and reduce soil erosion rate.
Moreover, the protection of soil and the conservation of mixed wood in this area have two important implications: (i) from a hydrogeological point of view, natural vegetation reduce impact of rain drops on soils, intercept hidden precipitations (mist and fog), allowing the conservation of water in soils; (ii) from an ecological point of view, soils are one of the most significant reservoirs of soil organic carbon and have the capacity to store carbon over very long periods of time (CitationSaint-Laurent et al., 2017), in particular soil organic carbon increases under conifer and broadleaved woodlands (CitationRodríguez-Murillo, 2011).
4. Conclusions
The objectives of this study were to develop a pedo-landscape map and a land capability classification of Vernazza catchment, in the Cinque Terre National Park (Main Map). Land capability map of the study area is dominated by class VII, these are lands with severe limitation due namely to stoniness, presence of rock fragments, useful depth and slope that make them generally unsuited to cultivation; only the 30% of the area may be used for crops but it requires very careful management and conservation practice. The map of the land capability classification will be a valid tool in helping Cinque Terre land managers and land use planners to manage land considering soil proprieties and potentialities, identifying areas with physical constraints for a range of land uses. In an historically terraced coastal agricultural landscape of a National Park recognized as a World Heritage site by UNESCO, a sustainable and correct territorial planning is pivotal.
Software
ESRI ArcGIS 9.2 is used to create the attribute database and compilation of the suitability map for this area and to produce the DEM. Saga GIS 6.3 is used to preprocess and correct the DEM while ADOBE InDesign CS2 is used to create figures and the Map Design.
Map_new.pdf
Download PDF (3.5 MB)Disclosure statement
No potential conflict of interest was reported by the author(s).
Related Research Data
References
- AbdelRahman, M. A. E. , Natarajanb, A. , & Hegdeb, R. (2016). Assessment of land suitability and capability by integrating remote sensing and GIS for agriculture in Chamarajanagar district, Karnataka, India. The Egyptian Journal of Remote Sensing and Space Science , 19 (1), 125–141. https://doi.org/10.1016/j.ejrs.2016.02.001
- Cevasco, A. , Brandolini, P. , Scopesi, C. , & Rellini, I. (2013). Relationships between geo-hydrological processes induced by heavy rainfall and land-use: The case of 25 October 2011 in the Vernazza catchment (Cinque Terre, NW Italy). Journal of Maps , 9 (2), 289–298. https://doi.org/10.1080/17445647.2013.780188
- Conrad, O. , Bechtel, B. , Bock, M. , Dietrich, H. , Fischer, E. , Gerlitz, L. , Wehberg, J. , Wichmann, V. , & Böhner, J. (2015). System for automated geoscientific analyses (SAGA) v. 2.1.4. Geoscientific Model Development , 8 (7), 1991–2007. https://doi.org/10.5194/gmd-8-1991-2015
- Costantini, E. A. C. (2006). La classificazione della capacità d'uso delle terre (land capability classification). In E. A. C. Costantini (Ed.), Metodi di valutazione dei suoli e delle terre (pp. 10–22). Cantagalli.
- Costantini, E. A. C. (2007). Linee guida dei metodi di rilevamento e informatizzazione dei dati pedologici . CRA-ABP.
- ESRI . (2006). ArcGIS 9.2 Desktop© . Environmental Systems Research Institute.
- FAO . (1976). A framework for land evaluation . Soils bulletin 32. Food and Agriculture Organization of the united nations.
- Hudson, B. D. (1992). The soil survey as a paradigm-based science. Soil Science Society of America Journal , 56 , 836–841. doi: 10.2136/sssaj1992.03615995005600030027x
- Hutchinson, M.F. (1996, January). A locally adaptive approach to the interpolation of digital elevation models. In Proceedings, third international conference/workshop on integrating GIS and environmental modeling (pp. 390-396). National Center for Geographic Information and Analysis. CD-ROM.
- IUSS Working Group WRB . (2015). World reference base for soil resources 2014, update 2015. International soil classification system for naming soils and creating legends for soil maps . World Soil Resources Reports, 106. FAO.
- Klingebiel, A. A. , & Montgomery, P. H. (1961). Land capability classification. USDA agricultural handbook 210 . US Government Printing Office.
- Ministero delle Politiche Agricole e Forestali . (2000). Metodi di analisi chimica del suolo . F. Angeli.
- Montanarella, L. (2010). Need for interpreted soil information for policy making. 19th World Congress of Soil Science, Soil Solutions for a Changing World 1-6 August 2010, Brisbane, Australia. Published on DVD.
- Planchon, O. , & Darboux, F. (2002). A fast, simple and versatile algorithm to fill the depressions of digital elevation models. Catena , 46 (2-3), 159–176. https://doi.org/10.1016/S0341-8162(01)00164-3
- Regione Liguria . (2007). Carta tecnica regionale ligure. https://geoportal.regione.liguria.it .
- Rellini, I. , Olivari, S. , Scopesi, C. , & Firpo, M. (2017). The soils of the Portofino promontory (NW Italy): distribution, genesis and palaeoenvironmental implications. Geografia Fisica e Dinamica Quaternaria , 40 (2), 211–232. https://doi.org/10.4461/GFDQ2017.40.13
- Rellini, I. , Scopesi, C. , Piazza P. , Olivari, S. , Perrone M. , & Firpo, M. (2019). First contributions to the definition of the “cinque Terre” DOC wines Terroir (NW-Italy). Bulletin of Environmental and Life Science , 1 , 60–74. https://doi.org/10.15167/2612-2960/BELS2019.1.1.1070
- Rellini, I. , Pavarino, M. , Scopesi, C. , & Zotti, M. (2011). Physical land suitability map for Tuber magnatum Pico in Piana Crixia municipality territory (Liguria-Italy) . Journal of Maps , 7 (1), 353–362. https://doi.org/10.4113/jom.2011.1180
- Rodríguez-Murillo, J. C. (2001). Organic carbon content under different types of land use and soil in Peninsular Spain. Biology and Fertility of Soils , 33 (1), 53–61. https://doi.org/10.1007/s003740000289
- Saint-Laurent, D. , Gervais-Beaulac, V. , Paradis, R. , Arsenault-Boucher, L. , & Demers, S. (2017). Distribution of soil organic carbon in riparian forest soils affected by frequent floods (Southern Québec, Canada). Forests , 8 (4), 124. https://doi.org/10.3390/f8040124
- USDA United States Department of Agriculture Natural Resources Conservation Service . (1993). Soil survey manual. Handbook 18 . United States Department of Agriculture, Natural Resources Conservation.
- Vorpahl, P. , Elsenbeer, H. , Märker, M. , & Schröder, B. (2012). How can statistical models help to determine driving factors of landslides? Ecological Modelling , 239 , 27–39. https://doi.org/10.1016/j.ecolmodel.2011.12.007