
ABSTRACT
Based on long-lasting multidisciplinary and multitemporal investigations, in 2016 the first geomorphological map of the central area of Rome was presented. It introduced innovative solutions for cartographic restitution of urban landforms. Under this work, the urban geomorphological analysis delved deeper, because the study focused on the smaller area of the Urbs, the ancient city centre that has been modified by human activities over millennia. The main goal of the new study was to verify if the 1:5000 scale survey could allow to improve the legend symbols, in order to better represent landforms from natural and anthropogenic processes in urban environment. Since the map scale was doubled compared with the previous and consequently the map area available was four times bigger, we were able to provide much more details. Moreover, results better highlighted the applicative significance of urban geomorphological maps as complementary tool for the assessment of natural hazards and risks.
1. Introduction
The issue of Anthropocene, in a broad meaning, was highlighted in 1873 by the Italian geologist Antonio Stoppani, who proposed to consider human activity as a modifying agent of the Earth's surface, like other morphogenetic processes. The term Anthropocene was more recently proposed by CitationCrutzen and Stoermer (2000) to refer to the time when mankind has begun to affect the global environment through intensive land use, deforestation, consumption of fossil fuels and the emission of harmful chemicals into the atmosphere. Since then, the scientific community has opened a debate whether it is also to be included in the international chronostratigraphic scale of the geological time (CitationZalasiewicz et al., 2019). From a geomorphological point of view, there is no doubt that mankind is radically reshaping the surface of the Earth, and these anthropogenic changes have marked fingerprints in the geological record of our planet (CitationBrandolini, 2017; CitationBrandolini et al., 2018; CitationBrown et al., 2017; CitationGoudie, 2018; CitationLi et al., 2017; CitationSzabó et al., 2010; CitationTarolli et al., 2019).
Besides the Anthropocene studies, the urban geomorphology topic has developed since early studies (CitationCoates, 1974, Citation1976; CitationCooke, 1976). It examines geomorphic constraints on urban development, suitability of different landforms for specific urban uses, the impact of urban activities on Earth surface processes, landforms created by urbanisation, and geomorphic consequences of extractive industries in, and around, urban areas (CitationDouglas & James, 2015; CitationMcCall et al., 1996; CitationReynard et al., 2017; CitationThornbush, 2015). Recently, many geomorphological studies have concerned urban areas, sometimes including historical centres (e.g.: CitationBini et al., 2018; CitationDall’Aglio et al., 2017; CitationJeong et al., 2018; CitationMozzi et al., 2018; CitationRusso Ermolli et al., 2014). However, few studies have focussed on issues specifically connected with the cartographic representation of geomorphological processes and landforms in urban environments, with layouts at scales ranging 1:100,000–1:10,000 (CitationBrandolini et al., 2017, Citation2018, Citation2019; CitationDel Monte et al., 2016; CitationZwoliński et al., 2018).
In the context of the above cited recent urban geomorphology studies, an extraordinary example of human-driven ‘Anthropocene’ forces overwhelming natural processes in re-shaping the landscape is the long and complex Rome's evolution, which holds about three millennia. As a result of more than 25 years of research, in order to tentatively reconstruct the original physical landscape of the centre of Rome within the railway ring (bordered by the red line marked in ) and the subsequent human-driven processes and landforms, CitationDel Monte et al. (2016) tested an innovative methodology based on multitemporal analyses of interdisciplinary data. They implemented a legend to represent landforms and processes, and their evolution over time, useful to output large-scale urban geomorphological maps. In particular, that test output the geomorphological map of the wide urban centre of Rome at the scale of 1:10,000.
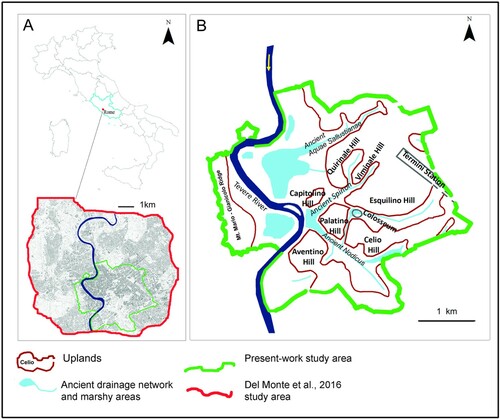
Figure 1. Geographical setting of the urban area of Rome. (A) Study area location and comparison between the urban area mapped in CitationDel Monte et al. (2016) and the present work study area; (B) Main topographical elements described in the text.
In this work, we moved forward the research, testing both theoretical and practical issues connected with a very detailed urban geomorphological study. Compared to the previous, the scale of this study was doubled, and consequently the 1:5000 study focussed on a smaller area, corresponding to the core of the historical centre, i.e. the Roman-age Urbs within the ancient walls. Regarding this area, according to previous experiences in historical centres (CitationLuberti et al., 2019, and references therein), a fundamental role towards the detection of anthropogenic modifications was played by the analysis of archaeological and historical data, which were matched with those provided by the data collected from both geognostic and geoarchaeological investigations. Citing three examples among several, previous researches highlighted how the archaeological facts regarding Circus Maximum and Tiberina Island have allowed to infer the palaeogeographical conditions present when Rome was founded (CitationDel Monte et al., 2013), or the archaeological data on ancient marshy areas supported the reconstruction of the natural drainage network in the city centre(CitationLuberti et al., 2018); moreover, the genesis of the Monte della Giustizia is related to the construction, since the 6th century BC, of a huge military-defence system, including walls (Servian Walls), a moat and an embankment, which elevated the previous structural surface at the top of the Esquiline hill as the highest relief of Rome on the left side of the Tevere (CitationLuberti & Del Monte, 2020; CitationPica et al., 2017). Aim of this work was to verify to what extent the 1:10,000 scale-map legend is still useful doubling the scale of the map, and which symbols may, or need to, be expanded. In addition, since the adoption of the 1:5000 scale implies that the area available for mapping landforms is four times bigger than at the 1:10,000 scale, the second aim was to test how much the bigger scale map is useful to represent processes and landforms in an urban environment. Finally, as a result of the fact that more geomorphic information can be drawn in the bigger scale map, a further aim was to verify whether this map may be more useful to address a wider range of applied topics, such as natural hazard and urban risk planning.
2. Geographical setting
Rome is located in central Italy (), between the Apennine chain and the Tyrrhenian sea. The city is 20–30 kilometres far from the coast. A Plio-Pleistocene marine sedimentary basement, several hundred-metre thick, represents the Roman-area bedrock. Since Middle Pleistocene, the cyclical repetition of volcanic, tectonic and glacio-eustatic events resulted in a volcanic plateau whose deposits, erupted by the Sabatini Mountains and Alban Hills complexes, alternate with fluvial, lacustrine and palustrine sediments. During the Last Glacial period, the plateau was deeply incised, and fluvial and palustrine sediments were later deposited by aggradational sedimentary processes (CitationLuberti et al., 2017, and references therein).
The ancient landscape of Rome appeared hillier than today. Deep valleys carved into often lithic pyroclastic rocks hosted small rivers and marshes. The residual structural surface of the plateau, interrupted by the alluvial plain of the Tevere river, was better preserved on the eastern side of the Tevere river valley. Actually, this structural surface has mainly been modified by several human activities performed over centuries (CitationDel Monte et al., 2016).
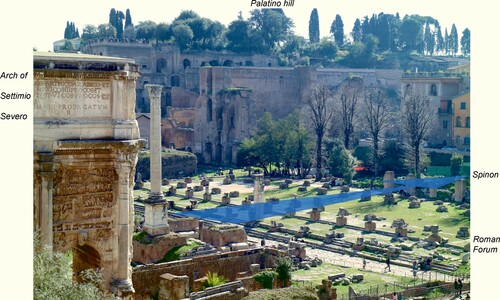
As a result of a millennial urbanisation, particularly on the eastern side, valleys have been partially or completely filled by anthropogenic deposits up to 20 m thick, whereas some reliefs, even more than 20 m high have been erased. Today, a valley-shape anthropogenic depression with the main axis along via dei Fori Imperiali connects piazza Venezia to the Colosseum. This huge topographic feature, which determines that the Palatino and Capitolium appear as square isolated hills (), is the result of many human interventions over time. From Nero to Maxentius emperors (1st – 4th centuries AD), a progressive reduction and obliteration of the Velia hill, which was part of a ridge connecting the southern portion (Carinae) of the Esquilino hill to the Palatino hill, was operated, while the saddle between the Quirinale hill and the Capitolium was erased in a decade of the second century AD (). The rest of the Velia hill was finally demolished, and the area between the two hills completely levelled in the twentieth century, while since the nineteenth century many archaeological digging works in the Forum area had determined many minor more-depth depressions.
Figure 2. View of the north-western portion of the Palatino hill, taken from the eastern portion of the Capitolium: in the middle, the Roman Forum; on the right side, some building founded on the bottom of the ancient Spinon river valley (whose stream direction is marked by the arrow), covered by several-metre thick anthropogenic deposits partially filling the fluvial valley.
On the mainly clayey-sandy western side of the Tevere river, which is characterised by higher reliefs and deeper and longer valleys, as well as superficial erosion processes and landsliding, anthropogenic modifications are less frequent (CitationDel Monte et al., 2013, Citation2016; CitationPalombi, 1997; CitationVentriglia, 1971, Citation2002; see lithological hillshaded scheme in the main map).
3. Materials and methods
In order to address the aims of this work (see Chapter 1) related to the decision to double the scale of the map, compared to the 1:10,000 geomorphologic map by CitationDel Monte et al. (2016), the study area was limited to the so-called Urbs, the name of the ancient Rome now included within the Aureliane walls, on the east side, and Leonine walls, on the west side (). This choice is, however, consistent with the fact that the geomorphological evolution has profoundly been influenced over time by human actions much more in this core area than outside the walls. For this reason, the interdisciplinary analyses of archaeological and historical data with those given from both geognostic (e.g. borehole) and geoarchaeologic (e.g. georadar) investigations yielded from various sources (e.g. professionals and companies, archives, literature) were fundamental to detect the most ancient modifications not recorded by historical maps (methododological guidelines in papers e.g.: CitationBrandolini et al., 2019; CitationLuberti et al., 2018, Citation2019; CitationMozzi et al., 2018). The archaeological records provided many local, but essential insights into the man-made and infilled ground, whereas historical documentation (e.g. written archive sources, iconographic data) gave descriptive or physical explanations to many landforms that are totally or partially not connected with natural processes.
The examination of the Regional Technical Map (Carta Tecnica Regionale: CitationRegione Lazio, 2003-2014) at greater scale (1:5000) and detail, adopted as the cartographic basis of the new map, evidenced the necessity to re-analyse previously collected data and to yield new data. The base map is modified after the Regional Technical Map of Lazio Region, implemented in 2005 working on aerial data of 2002; it was selected since significant modifications to morphology or urbanisation were not performed in the study area after its implementation.
A renewed detailed field geomorphological survey of Rome city centre was conducted, considering the opportunity to map objects with geomorphologic relevance that we were not able to draw as symbols in the less detailed 1:10,000 map previously output (CitationDel Monte et al., 2016). In particular, the updated geomorphological survey aimed at detecting minor urban-landscape landforms, e.g. the retaining walls and the still existing segments of the ancient walls. At the same time, the geomorphological survey of the landscape was supported by a more in-depth multitemporal analysis of historical maps and archive documents, archaeological reports and maps, and aerial photographs. Moreover, geological and thematic maps, as well as professional reports and project-scale maps, including borehole logs, were locally evaluated under the methodological principles given by CitationLuberti (2018), CitationLupia Palmieri et al. (1998), and CitationLuberti et al. (2015), Citation(2019). In addition, even iconographic documents, including old terrestrial photos and landscape paints from the sixteenth to the nineteenth centuries were examined in order to extract data useful to be georeferenced (). lists the main materials that were analysed.
Figure 3. Methodological flow diagram. Collected data are listed in .
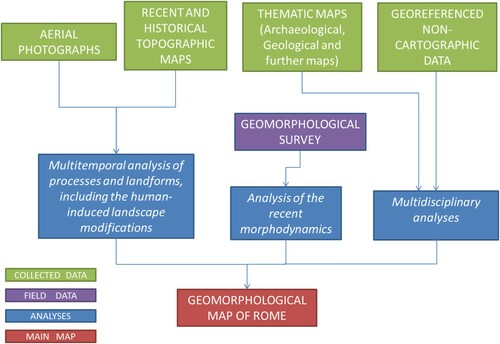
Table 1. List of the main data sources.
Based on the same methodology that resulted in the first geomorphologic map of Rome (for the operational flow scheme, see in CitationDel Monte et al., 2016), the long-lasting research moved forward. Besides the analogical analysis of couples of stereoscopic aerial photos, the multitemporal analysis of historical maps and the co-analysis of geological, archaeological and thematic maps was facilitated by a Geographic Information System (ArcGIS 10.4 software). The Projected Coordinate System is ED50, UTM projection, Zone 33 North.
The 1:5000 Geomorphological Map of Rome centre, about 14 km2 wide, is drawn at a scale 1:6000 because of the fact that the maximum available paper size is A0 (Supplementary Materials).
Despite the fact that the present-study map displays an area that is about four times smaller than that drawn into the A0 size 1:10,000 map, and because of that, less geomorphological processes and landforms were likely to be represented, new geomorphological symbols were introduced. In particular, some processes are represented in the new map by a deeply enriched symbology, depending on the higher detail of the representation and the multiplying of landforms that are reliable to be mapped at this scale. For example, each element of the digital numerical version of the topographic map which shows a difference in height greater than 5 metres was extracted from these maps, and underwent geomorphological analyses in order to reveal its anthropogenic or natural morphogenetic origin.
Due to the extraordinary complexity and relevant man-made modifications that characterise the Urbs, the legend of landforms and anthropogenic processes in this map was more significantly improved and integrated than the legend in the map by CitationDel Monte et al. (2016), which in turn hold a much wider area. Due to the very large scale of this study, the legend was also improved with respect to the symbols published under the revision of the Italian national guidelines for geomorphological mapping (CitationCampobasso et al., 2018).
4. Results and discussion
A brief comparison of the two geomorphologic maps of Rome, i.e. the one authored by CitationDel Monte et al. (2016) and the Main Map, shows that the oldest one holds a quite bigger area (amounting 63 km2) that includes the ancient city centre within the walls (about 14 km2 wide), which is the study area of the present map, plus a relevant portion of the ancient Suburbium (CitationWitcher, 2005). The suburban area on the western side of Rome includes the Mt. Mario-Gianicolo tectonic ridge, which is affected by many gravitational processes because of the higher energy relief and the local geologic outcrops. This is mainly made of clayey and sandy sediments much more exposed to weathering and erosion, being often not covered by the pyroclastic rocks and less urbanised than on the other side of the Tevere river. There, structural and fluvial landforms present a wider variety of types that have deeply been modified only during the last 150 years (CitationDel Monte et al., 2016; CitationLuberti, 2018).
Despite the reduction of the study area, the doubling of the scale let us discriminate a higher number of natural and anthropogenic processes, their spatial and temporal relationships and the resulting landforms. In some cases, the larger scale evidenced the opportunity to represent landforms in a more detailed way, just adopting another symbol already available in the legend. In other cases, we realised that a new symbol needed to be introduced for the 1:5000 geomorphologic map.
Some point or line features were improved respectively as line or polygon features, according to the dimension of each landform in comparison with the adopted scale. This is, for example, the case of landslides that in the previous study were represented as point feature.
Among the forms in the legend, a great improvement in terms of symbol representation, density of elements and their discernible in the map at the 1:5000 scale, was given to:
Man-made scarp edges and retaining walls. A specific symbol was used for the river bank retaining wall, the so-called ‘muraglioni’. Retaining walls were symbolised in the map when higher than 5 m. Great work has been done on the anthropogenic slope edges, which were extracted from the numerical topographic map and analysed one by one (they were almost 3000, then many have been discarded). Most of them are man-made scarp edges, which are all characterised by retaining walls lower than 5 m, while few others are polygenic scarp edges (). A new symbol was introduced in order to represent structural scarp edges modified by human activities. These aspects of the urban landscape underlined the importance of filed survey even in the peculiar urban environment.
Anthropogenic trenches. The larger scale of the present-study map allowed us to distinguish two kinds of trenches: carved in rock, or with retaining walls.
Ancient walls, ancient aqueducts (or remains of them). These are positive landforms, often of great cubature, sometimes almost completely or partially covered by more recent anthropogenic features. Of great archaeological and historical interest, these works usually have a considerable visual impact, and are often helpful for the reconstruction of the recent geomorphological evolution of the surrounding territory.
Ancient ditches and drainage works. We refer to the ancient moats, partially or completely buried, and to the weir mapped in the Main Map. Like the previous ones, they are of great importance from the historical, archaeological and geomorphological-evolutionary points of view.
Surface of filling of: a. ancient valley, b. ancient quarry, c. generic depression. They are mostly flat or slightly wavy surfaces, under which lie forms buried by huge amounts (i.e. up to 20 m thick) of anthropogenic carryovers. Apart from the obvious applicative interest linked to the presence of large volumes of landfill material and to all the possible negative implications (e.g. subsurface erosion, piping phenomena, subsidence, amplification of the effects of earthquakes, development of underground cavities, collapse of the road surface, damage to infrastructures, phenomena that are widespread in the great urban area), we believe that the precise location of a form that ‘disappeared’ from the current landscape allows to reconstruct with greater accuracy the trend of the basal surface of the landfills, especially in the absence of a dense network of geognostic surveys.
Terraced slope (anthropogenic step-like slope). Also, in this case, the correct interpretation of the changes made to the natural shape of a slope allows a better prediction of what kind of potentially dangerous phenomena may occur in the next future (mass movements, development of landslide slopes, creep, gully erosion, etc.) and to foresee, consequently, the opportune interventions of mitigation of the effects induced by such expected phenomena.
Anthropogenic hills. It is known that today human activities are capable of producing enormous quantities of waste materials, which can take on dimensions and shapes comparable to those of natural hills (CitationLuberti et al., 2019, and references therein). The particularity of the analyzed urban territory is – among other things – linked to the presence of numerous hill reliefs created by man in ancient times, which then underwent profound transformations over time, up to being, in some cases, completely eliminated (CitationLuberti et al., 2019). In this work, the geomorphological survey carried out on a detailed scale and the careful analysis of the variations in the thickness of anthropic deposits have allowed us to accurately delimit the boundary of these artificial hills.
In the following subchapters, focus on peculiar case studies shows how the method was locally applied in effective ways, the improvement towards the representation of processes and landforms in comparison with the 1:10,000 map, the additional information that the new map provides in terms of identification of geologic hazard and related risk, considering the historical urban environment.
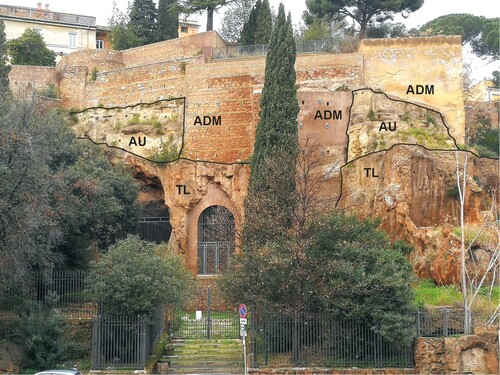
Figure 4. The southern flank of the Capitolium, photo taken from piazza della Consolazione. From the street level, the middle of the image displays the entrance to one of the huge underground quarries (latomie) operated during the ancient Roman age to provide lithic pyroclastic blocks useful for construction. The steep slopes resulted from both topple landslide processes and from anthropogenic erosion. Legend: ADM – Anthropogenic deposits and materials (retaining walls and foundations of the buildings), covering natural deposits also in the lower portion of the image; AU – Aurelia Unit fluvial-lacustrine deposits (Middle Pleistocene); TL – Tufo Lionato pyroclastic-flow deposits (Middle Pleistocene).
4.1 The via Ludovisi villas
The geomorphological survey of the via Ludovisi area (41°54′30″N, 12°29′15″E), as well as the visual analysis of stereoscopic aerial photos (CitationMAPRW, 1943-1944; CitationSARA-Nistri, 1934), let us verify that two historical villas (villa Ludovisi and villa Maraini, A and B respectively in ) are located, together with their yards, about 10 m above the street ground level. The exact measures were provided by the topographic map (CitationRegione Lazio, 2003-2014). The survey confirmed that the two villas are bordered by huge earth-retaining walls. The multitemporal analysis of historical maps and further documents revealed that this topographic configuration is the result of modern urbanisation, that acted since the end of the nineteenth century. Before that time, the area was part of the southern structural surface of the Pincio hill. Our interpretation is that the urbanisation determined the necessity of the ground levelling, and, to preserve the two historical villas, excavation works were performed, and the two square retaining walls were constructed. This interpretation is furtherly confirmed by the fact that villa Ludovisi is depicted in many historical maps (e.g. Dupérac in 1577: reference in CitationFrutaz, 1962; CitationNolli, 1748), which show that the villa (initially named as ‘villa del Nero’,) was surrounded by a very large garden that was part of the southern flat top of the Pincio hill.
Figure 5. The historical landscape evolution of via Ludovisi area, including villa Ludovisi (A) and villa Maraini (B): at the time of the map drawn by Dupérac in 1577 (a); in the 1910s, when the area resulted completely urbanised (aerial photo taken by Arrigo Lorenzo Osti from the airship P4, c.a. 1916-1918) (b); presently, according to the topographic map (CitationRegione Lazio, 2003-2014) (c); in 2019, street photo of villa Maraini (the retaining wall of the right side belongs to villa Ludovisi), taken from the position marked in the topographic map (d).
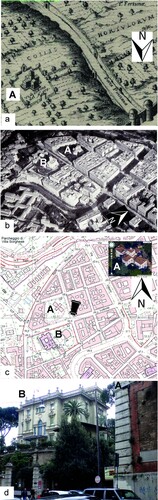
Because of the smaller scale of the map, CitationDel Monte et al. (2016) were able to just represent the two villas as part of the southern structural surface of the Pincio hill, whereas we had the opportunity to separate the structural surface into several polygons, and to border the villa's yards with the man-made scarp edge symbol.
Even in order to preserve the cultural heritage represented by the historical villas, planners may learn that particular attention should be paid to the structural maintenance of the retaining walls, whose resistance to static and dynamic forces (e.g. gravity, earthquake shaking) may have been weakened by their aging.
4.2 The Monte Giordano anthropogenic hill
Monte Giordano (41°54′05″N, 12°28′10″E) is a less famous hill (), compared to Monte Testaccio or Montecitorio, even if it has great relief evidence. Its origin goes back at least to Medieval times, being cited by Dante Alighieri at the beginning of the fourteenth century in the Divina Commedia (Canto XVIII of the Inferno, 25-33) where it is named as the ‘monte’ to, and from which, Saint Peter church pilgrims used to go and come back, crossing the river at Castel Sant’Angelo. Among others of the same century, the hill is well evidenced in the small-scale map by Lucio Fauno in 1548 (in CitationFrutaz, 1962), where however it is located too close to the Montecitorio hill. Despite it has no clear elevation evidence in the map by CitationNolli (1748), its borders were clearly marked by CitationBrocchi (1820) in its first geologic map of Rome, and they are quite consistent with those depicted in the archaeological map by CitationLanciani (1893-1901), who drew its form in a very effective way. Even in this case, the geomorphological survey played a key role in the characterisation of this landform, which has a very clear topographic evidence. The maximum elevation that we measured is about 6 m, at vicolo del Montonaccio, above the surrounding ground level located at 18 m asl, so the hill accounts an elevation of at least 24 m asl.
Figure 6. Location and geometry of the Monte Giordano hill: in the map drawn by Lucio Fauno in 1548 (a); in the geologic map by CitationBrocchi (1820) (b); in the archaeological map by CitationLanciani (1893-1901) (c); in a present-day street photo at the entrance of vicolo del Montonaccio (d), whose location is marked in the archaeological map.
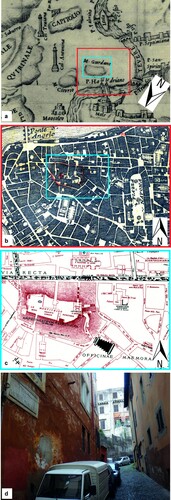
Compared to the map by CitationDel Monte et al. (2016), the much more detailed 1:5000 topographic map let us draw the border of the hill in a more precise way.
This anthropogenic-hill landform, as well as the other artificial hills, most of which are located on the alluvial plain of the Tevere river, should be identified carefully by planners, as buildings and other constructions founded over them are exposed to higher risk, especially because of the major seismic amplifications that may derive from both the unconsolidated fluvial deposits and the anthropogenic deposits, which generally have weak geotechnical characteristics.
4.3 The ‘Fosso di Santa Croce’ buried valley
The Fosso di Santa Croce (41°53′20″N, 12°30′50″E) was identified by CitationDel Monte et al. (2016) as a right side tributary of the river flowing just out of the walls, in the sector between the San Giovanni and the Santa Croce in Gerusalemme churches (). CitationLuberti et al. (2018) suggested that this river, named as Aqua Crabra or Aqua Mariana in Medieval times and later, is very likely to be the ancient Nodicus river, which flew in the valley between the Palatino and the Aventino hill and that in ancient Roman age hosted the Circus Maximum. The Fosso di Santa Croce valley is well depicted in the maps drawn by Dupérac in 1577 and Falda in 1676 (in: CitationFrutaz, 1962), which show how the valley was progressively filled for urbanisation. The valley results to be completely buried at the time of the CitationNolli (1748) map, when the straight boulevard between the two churches was already done. Like that was the urbanistic situation up to the mid twentieth century, as clearly results from both historical topographic maps and aerial photos (listed in ). More recently, archaeological digging was performed at the interior border of the walls, where the valley was artificially restored as it was at the Medieval times, when a minor gate was opened about 5 m below the present-day ground level, as measured during the geomorphologic survey.
Figure 7. The location of the Fosso di Santa Croce valley (bordered in red), compared with the churches of San Giovanni in Laterano (A) and Santa Croce in Gerusalemme (B): in the map drawn by Dupérac in 1577 (a); in the map authored by Falda in 1676 (b); in a recent aerial view photo, which shows the large strait way that was constructed between the two churches (c); presently, street-view photo showing results from archaeological works that partially restored the valley as it probably was at Medieval times (d), when a minor gate was opened (box in d).
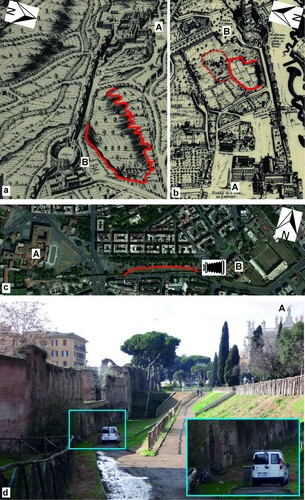
Even in this case, the more detailed 1:5000 topographic map let us draw in a better way at least the portion of the valley restored in recent times.
The information that comes from this geomorphic feature should be carefully taken under consideration by planners, in terms of the presence of considerable thicknesses of anthropogenic deposits that may locally represent an element of geotechnical weakness.
5. Conclusions
The millennial landscape evolution of Rome is an extraordinary example of ‘Anthropocene’ urban geomorphology. During the last 25 years, the geomorphological study of Rome, aiming even at the reconstruction of the physical landscape before human modifications, has been the means to create innovative methodological tools, and an effective legend to represent the urban landforms and their evolution over time. The first detailed urban geomorphological map (1:10,000 scale) of the urban centre of Rome within the railway ring (CitationDel Monte et al., 2016), introduced innovative suggestions for man-made landforms cartographic restitution. This work moves a step on, aiming at testing issues connected with mapping at a bigger scale, 1:5000, in order to improve the legend symbols, where possible. Results demonstrate that it is possible to implement it, and it is recommended, since a more detailed legend, as well as the bigger scale, allows a better representation and distinction of natural and anthropogenic landforms and morphogenetic processes operating in the urban environment.
Comparing the two geomorphologic maps of Rome, despite the one authored by CitationDel Monte et al. (2016) covers a quite bigger study area, the present-study map that covers the ancient city centre only has a richer legend of anthropogenic symbols. The smaller study area of this map allowed the present-work authors to discriminate a higher number of natural and anthropogenic processes, their spatial and temporal relationships and the resulting landforms, also thanks to the use of new symbols, whose implementation was made in the groove of the recently revised Italian national guidelines for geomorphological mapping (CitationCampobasso et al., 2018).
Software
ESRI's ArcGIS software was used to create the original map geodatabase and to compile the map, including improving the map graphics and adding the extra data and figures within the map.
mapAFTER_REVIEW_Vergari_et_al_Geomorphology_of_the_ancient_historic_centre_of_the_Urbs.pdf
Download PDF (14.4 MB)Disclosure statement
No potential conflict of interest was reported by the author(s).
References
- Bini, M., Pappalardo, M., Rossi, V., Noti, V., Amorosi, A., & Sarti, G. (2018). Deciphering the effects of human activity on urban areas through morphostratigraphic analysis: The case of Pisa, Northwest Italy. Geoarchaeology, 33(1), 43–51. https://doi.org/10.1002/gea.21619
- Brandolini, F., Cremaschi, M., & Pelfini, M. (2019a). Estimating the potential of archaeo-historical data in the definition of geomorphosites and geo-educational itineraries in the central Po plain (N Italy). Geoheritage, 11(4), 1371–1396. https://doi.org/10.1007/s12371-019-00370-5 doi: 10.1007/s12371-019-00382-1
- Brandolini, P. (2017). The outstanding terraced landscape of the Cinque Terre coastal slopes (eastern Liguria). In M. Soldati & M. Marchetti (Eds.), Landscapes and landforms of Italy, World geomorphological Landscapes (pp. 235–244). Springer International Publishing.
- Brandolini, P., Cappadonia, C., Luberti, G. M., Donadio, C., Stamatopoulos, L., Di Maggio, C., Faccini F., Stanislao C., Vergari F., Paliaga G., Agnesi V., Alevizos G., & Del Monte, M. (2019b). Geomorphology of the Anthropocene in Mediterranean urban areas. Progress in Physical Geography: Earth and Environment, https://doi.org/10.1177/0309133319881108. (First Published October 31, 2019).
- Brandolini, P., Faccini, F., Paliaga, G., & Piana, P. (2017). Urban geomorphology in coastal environment: Man-made morphological changes in a seaside tourist resort (Rapallo, eastern Liguria, Italy). Quaestiones Geographicae, 36(3), 97–110. https://doi.org/10.1515/quageo-2017-0027
- Brandolini, P., Faccini, F., Paliaga, G., & Piana, P. (2018a). Man-made landforms survey and mapping in an urban historical center on coastal Mediterranean environment. Geografia Fisica e Dinamica Quaternaria, 41, 23–34. https://doi.org/10.4461/GFDQ.2018.41.2
- Brandolini, P., Pepe, G., Capolongo, D., Cappadonia, C., Cevasco, A., Conoscenti, C., Marsico A., Vergari F., & Del Monte, M. (2018b). Hillslope degradation in representative Italian areas: Just soil erosion risk or opportunity of development? Land Degradation & Development, 29(9), 3050–3068. https://doi.org/10.1002/ldr.2999
- Brocchi, G. B. (1820). Untitled [geologic map, drawn with two colours over the “small” map by Nolli, as updated by Ignazio Benedetti in 1773, 50×73 cm]. Unpublished map. http://opac.isprambiente.it/SebinaOpac/Opac?action=multimedia&sessID=5B03FE95C6318D2601DF3CF7BB46A3E6@3ffd7715&docID=3
- Brown, A. G., Tooth, S., Bullard, J. E., Thomas, D. S., Chiverrell, R. C., Plater, A. J., Murton J., Thorndycraft V. R., Tarolli P., Rose J., Wainwright J., Downs P., & Aalto, R. (2017). The geomorphology of the Anthropocene: Emergence, status and implications. Earth Surface Processes and Landforms, 42(1), 71–90. https://doi.org/10.1002/esp.3943
- Campobasso, C., Carton, A., Chelli, A., D’Orefice, M., Dramis, F., Graciotti, R., & Pellegrini, L. (2018). Aggiornamento ed integrazioni delle Linee guida della Carta geomorfologica d’Italia alla scala 1:50.000. Progetto CARG: Modifiche ed integrazioni al Quaderno n. 4/1994 [Update and addition to the guidelines for the geomorphologic Map of Italy at the 1:50,000 scale. CARG project: Modification and addition to the Quaderno n. 4/1994]. Quaderni Serie III, 13(1), 1–95.
- Coates, D. R. (1974). Environmental geomorphology and landscape conservation. Vol. II, urban areas. Hutchinson & Ross Inc.
- Coates, D. R. (1976). Urban geomorphology. The Geological Society of America, Special Paper 174.
- Cooke, R. U. (1976). Urban geomorphology. The Geographical Journal, 142(1), 59–65. https://doi.org/10.2307/1796025
- Corazza, A., & Marra, F. (1995). Carta dello spessore dei terreni di riporto [Map of the anthropogenic-deposit thickness]. In R. Funiciello (Ed.), La geologia di Roma: Il centro storico [The geology of Rome. The city centre]. Memorie Descrittive della Carta Geologica d’Italia. , 50, tav. 13 [plate n. 13].
- Crutzen, P. J., & Stoermer, E. F. (2000). The “Anthropocene”. The International Geosphere–Biosphere Programme Global Change Newsletter, 41, 17–18.
- Dall’Aglio, P. L., De Donatis, M., Franceschelli, C., Guerra, C., Guerra, V., Nesci, O., Piacentini D., & Savelli, D. (2017). Geomorphological and anthropic control of the development of some Adriatic historical towns (Italy) since the Roman age. Quaestiones Geographicae, 36(3), 111–123. https://doi.org/10.1515/quageo-2017-0028
- Del Monte, M., D’Orefice, M., Luberti, G. M., Marini, R., Pica, A., & Vergari, F. (2016). Geomorphological classification of urban landscapes: The case study of Rome (Italy). Journal of Maps, 12(1), 178–189. https://doi.org/10.1080/17445647.2016.1187977
- Del Monte, M., Fredi, P., Pica, A., & Vergari, F. (2013). Geosites within Rome city center (Italy): A mixture of cultural and geomorphological heritage. Geografia Fisica e Dinamica Quaternaria, 36(2), 241–257. https://doi.org/10.4461/GFDQ.2013.36.20
- Direzione Generale Del Censo. (1829). Pianta topografica di Roma dalla Direzione generale del censo anno MDCCCXXIX [Topographic map of Rome by the Direzione generale del censo in the AD 1829; in 4 plates, 62×82 cm each, 1:4000 scale]. http://www.archiviocapitolinorisorsedigitali.it/piante/Cart.%20XIII,%2026.htm
- Direzione Generale Del Censo. (1854). Pianta topografica di Roma dalla Direzione generale del censo anno MDCCCLIV [Topographic map of Rome by the Direzione generale del censo in the AD 1854; map 122×163 cm, 1:4000 scale]. http://www.bsrdigitalcollections.it/WebArk/lib/maps/maps_L609_2_85_3.html
- Direzione Generale Del Censo. (1866). Pianta topografica di Roma pubblicata dalla Direzione generale del censo ed aggiornata a tutto il corrente anno MDCCCLXVI [Topographic map of Rome published by the Direzione generale del censo and updated at the AD 1866; in 4 plates, 62×82 cm each, 1:4000 scale]. http://www.archiviocapitolinorisorsedigitali.it/piante/357.htm
- Douglas, I., & James, P. (2015). Urban ecology. An introduction. Routledge.
- Frutaz, A. P. (1962). Le piante di Roma [The maps of Rome]. Istituto Nazionale di Studi Romani.
- Funiciello, R., & Giordano, G. (2008). Carta geologica del Comune di Roma. Scala 1:10.000 (Nuova edizione 2008) [geological map of Rome Municipality. Scale 1:10,000 (New Edition)]. In R. Funiciello, A. Praturlon, & G. Giordano (Eds.), La geologia di Roma dal centro storico alla periferia. Memorie Descrittive della Carta Geologica d’Italia, 80, Ver.1.1 DVD [DVD digital support].
- GAI (1954). Volo Italia [Italy Flight; aerial photographs of Rome, 23×23 cm each]. Gruppo Aereo Italiano, Istituto Geografico Militare Italiano.
- Goudie, A. (2018). The human impact in geomorphology – 50 years of change. Geomorphology. https://j.geomorph.2018.12.002. (Available online 8 December 2018).
- IGMI. (1873). Tavoletta 150 IV NO ‘Castel Giubileo’; Tavoletta 150 IV SO ‘Roma’ [topographic map, 1:25,000 scale]. Istituto Geografico Militare.
- IGMI (1907–1924). Piano Topografico di Roma e suburbio, Fogli 1-12 [topographic Plan of Rome and surroundings. Sheets 1-12; 1:5000 scale, surveyed in 1907 and updated in 1924]. Istituto Geografico Militare.
- Jeong, A., Cheung, S. Y., Walker, I. J., & Dorn, R. I. (2018). Urban geomorphology of an arid city: Case study of Phoenix, Arizona. In M. J. Thornbush & C. D. Allen (Eds.), Urban geomorphology, landforms and processes in Cities (pp. 177–204). Elsevier.
- Lanciani, R. (1893–1901). Forma Urbis Romae - Consilio et auctoritate Regiae Academiae Lyncaeorum formam dimensus est et ad modulum 1:1000 delineavit Rodolphus Lanciani Romanus [Form of the city of Rome – Council and authority of the Royal Academy of the Lincei, drawn at the scale of 1:1,000 by the Roman Rodolfo Lanciani; archaeologic map, 46 plates]. Ulrico Hoepli.
- Li, J., Yang, L., Pu, R., & Liu, Y. (2017). A review on anthropogenic geomorphology. Journal of Geographical Sciences, 27(1), 109–128. https://doi.org/10.1007/s11442-017-1367-7
- Luberti, G. M. (2018). Computation of modern anthropogenic-deposit thicknesses in urban areas: A case study in Rome (Italy). The Anthropocene Review, 5(1), 2–27. https://doi.org/10.1177/2053019618757252
- Luberti, G. M. & Del Monte, M. (2020). Il Monte della Giustizia all’Esquilino, Roma [The “Justice Mount” at the Esquiline in Rome (Italy)]. In M. Pantaloni, D. Mantero, A. Argentieri (Eds.) I siti della memoria geologica nella Regione Lazio [Sites of geologic memory in the Regione Lazio], Memorie Descrittive Carta Geologica d’Italia, 1-10 Special volume. ISPRA Servizio Geologico d'Italia.
- Luberti, G. M., Marra, F., & Florindo, F. (2017). A review of the stratigraphy of Rome (Italy) according to geochronologically and paleomagnetically constrained aggradational successions, glacio-eustatic forcing and volcano-tectonic processes. Quaternary International, 438(B), 40–67. https://doi.org/10.1016/j.quaint.2017.01.044
- Luberti, G. M., Prestininzi, A., & Esposito, C. (2015). Development of a geological model useful for the study of the natural hazards in urban environments: An example from the eastern sector of Rome (Italy). Italian Journal of Engineering Geology and Environment, 2, 41–62. https://doi.org/10.4408/IJEGE.2015-02.O-04
- Luberti, G. M., Vergari, F., Marini, R., Pica, A., & Del Monte, M. (2018). Anthropogenic modifications to the drainage network of Rome (Italy): The case study of the Aqua Mariana. Alpine and Mediterranean Quaternary, 31(2), 119–132. https://doi.org/10.26382/AMQ.2018.08
- Luberti, G. M., Vergari, F., Pica, A., & Del Monte, M. (2019). Estimation of the thickness of anthropogenic deposits in historical urban centres: An interdisciplinary methodology applied to Rome (Italy). The Holocene, 29(1), 158–172. https://doi.org/10.1177/0959683618804630
- Lupia Palmieri, E., Centamore, E., Ciccacci, S., D’Alessandro, L., Del Monte, M., Fredi, P., & Pugliese, F. (1998). Geomorfologia quantitativa e morfodinamica del territorio abruzzese: II - Il bacino idrografico del Fiume Tordino [Quantitative geomorphology and morphodynamics of the Abruzzo, Italy: II - The drainage basin of the river Tordino]. Geografia Fisica e Dinamica Quaternaria, 21(1), 113–129.
- MAPRW (1943–1944). Untitled [Aerial photos by Royal Air Force, Mediterranean Allied photo Reconnaissance Wing, 23×23 cm each]. Aerofototeca Nazionale (AFN), Ministero dei beni e delle attività culturali e del turismo, Istituto Centrale per il Catalogo e la Documentazione.
- Marra, F., & Rosa, C. (1995). Carta geologica del centro storico di Roma [geological map of the city centre of Rome]. In R. Funiciello (Ed.), La geologia di Roma: Il centro storico [The geology of Rome: The city center]. Memorie Descrittive della Carta Geologica d’Italia, 50, tav. 9 [plate n. 9].
- McCall, G. J. H., De Mulder, E. F. J., & Marker, B. R. (1996). Urban Geoscience. Balkema.
- Moltke, H. K. B. (1852). Carta Topografica di Roma e dei suoi contorni fino alla distanza di 10 miglia fuori le mura, indicante tutti i siti ed edifizii moderni ed i ruderi antichi ivi esistenti. Eseguita coll’appoggio delle osservazioni astronomiche e per mezzo della mensola delineata sulla proporzione di 1:25.000 dal Barone di Moltke Aiutante di campo di S.A. Reale il Principe Enrico di Prussia a Roma negli anni 1845 e 1846 [Topographic map of Rome and surroundings within 10 miles from the walls, including all existing modern buildings and ruins. Drawn through astronomic measures at the 1:25,000 scale in Rome during AD 1845-46 by Baron Moltke, field Attendant of H.M. Prince Henry of Prussia]. Simone Schropp e C°.
- Mozzi, P., Ferrarese, F., Zangrando, D., Gamba, M., Vigoni, A., Sainati, C., Fontana A., Ninfo A., Piovan S., Rossato S., & Veronese, F. (2018). The modelling of archaeological and geomorphic surfaces in a multistratified urban site in Padua, Italy. Geoarchaeology, 33(1), 67–84. https://doi.org/10.1002/gea.21641
- Nistri, U. (1919). Roma dall’aeroplano [Rome view from the airplane; aerial fotomosaic made of four photographs, 34.5×40.5 cm each]. Aerofototeca Nazionale (AFN), Ministero dei beni e delle attività culturali e del turismo, Istituto Centrale per il Catalogo e la Documentazione.
- Nolli, G. B. (1748). Nuova pianta di Roma data in luce da Giambattista Nolli l’anno MDCCXLVIII [New map of Rome by Giambattista Nolli in the AD 1748; topographic “Big Nolli” map, in 12 copper plates: 430/440×680/690 mm and 480×720 mm, 1:2910 scale]. https://www.lib.berkeley.edu/EART/maps/nolli.html
- Palombi, D. (1997). Tra Palatino ed Esquilino: Velia, Carinae, Fagutal [Between Palatino and Esquilino; Velia, Carinae, Fagutal]. Volume 1 of Rivista dell’Istituto nazionale d’archeologia e storia dell’arte: Supplemento. Istituto Nazionale di Archeologia.
- Pica, A., Luberti, G. M., Vergari, F., Fredi, P., & Del Monte, M. (2017). Contribution for an urban geomorphoheritage assessment method: Proposal from three geomorphosites in Rome (Italy). Quaestiones Geographicae, 36(3), 21–36. https://doi.org/10.1515/quageo-2017-0030
- Quilici, L. (1990). Forma e urbanistica di Roma arcaica [shape and urban setting of the Archaic Rome]. In M. Cristofani (Ed.), La grande Roma dei Tarquini [The great Rome of the Tarquini], (pp. 29–44). L’erma di Bretschneider.
- Regione Lazio (2003–2014). Carta Tecnica Regionale Numerica, Elementi: 374062; 374073; 374101; 374102; 374113; 374114 [Numerical Regional Technical Map, Plates: 374062; 374073; 374101; 374102; 374113; 374114; topographic map, 1:5000 scale]. LAMCO s.r.l.
- Reynard, E., Pica, A., & Coratza, P. (2017). Urban geomorphological heritage: An overview. Quaestiones Geographicae 36(3), 7–20. https://doi.org/10.1515/quageo-2017-0022
- Russo Ermolli, E., Romano, P., Ruello, M. R., & Barone Lumaga, M. R. (2014). The natural and cultural landscape of Naples (southern Italy) during the Graeco-Roman and Late Antique periods. Journal of Archaeological Science, 42, 399–411. https://doi.org/10.1016/j.jas.2013.11.018
- SARA-Nistri. (1934). Untitled [Aerial photograph flight on Rome; photographs 18×13 cm each]. Aerofototeca Nazionale (AFN), Ministero dei beni e delle attività culturali e del turismo, Istituto Centrale per il Catalogo e la Documentazione.
- Szabó, J., Dávid, L., & Lóczy, D. (2010). Anthropogenic geomorphology. Springer.
- Tarolli, P., Cao, W., Sofia, G., Evans, D., & Ellis, E. C. (2019). From features to fingerprints: A general diagnostic framework for anthropogenic geomorphology. Progress in Physical Geography: Earth and Environment, 43(1), 95–128. https://doi.org/10.1177/0309133318825284
- Thornbush, M. (2015). Geography, urban geomorphology and sustainability. Area, 47(4), 350–353. https://doi.org/10.1111/area.12218
- Ventriglia, U. (1971). Geologia della città di Roma [Geology of the city of Rome]. Amministrazione Provinciale di Roma. http://www.provincia.rm.it/dipartimentoV/SitoGeologico/HomePreciso.asp?idPreciso=34
- Ventriglia, U. (2002). Geologia del territorio del comune di Roma [Geology of the territory of the municipality of Rome]. Amministrazione Provinciale di Roma. http://www.provincia.rm.it/dipartimentoV/SitoGeologico/PagDefault.asp?idPag=52
- Verri, A. (1915). Carta Geologica Di Roma Pubblicata Dal R. Ufficio Geologico Su Rilevamento Del Tenente Generale A. Verri. Cenni Spiegativi [geologic map of Rome published by the Royal Geological Office, as surveyed by Lieutenant General A. Verri. Explanatory notes]. Istituto Geografico De Agostini.
- Witcher, R. (2005). The extended metropolis: Urbs, suburbium and population. Journal of Roman Archaeology, 18, 120–138. https://doi.org/10.1017/S1047759400007248
- Zalasiewicz, J., Waters, C. N., Williams, M., & Summerhayes, C. P. (2019). The Anthropocene as a geological time Unit. Cambridge University Press.
- Zwoliński, Z., Hildebrandt-Radke, I., Mazurek, M., & Makohonienko, M. (2018). Anthropogeomorphological metamorphosis of an urban area in the Postglacial landscape: A case study of Poznań city. In M. J. Thornbushand & C. D. Allen (Eds.), Urban geomorphology, landforms and processes in Cities (pp. 55–77). Elsevier.