
ABSTRACT
The El Estribo Volcanic Complex, located to the south of Pátzcuaro Lake (Central Mexico), forms an elevation based on a shield volcano crowned by a cinder cone. Two debris avalanches, dated at 28,000 and 14,000 ybp, cover an area of 4 km2 with a typical hummocky topography. The zone is a state natural protected area with no previous studies of hazard and risk from mass movement processes. Herein, we present a detailed geomorphological map of the debris-avalanche area, scale 1:20,000. The approach applied used two hierarchical levels, geomorphological landscapes and landforms. The fault scarp was mapped using high-resolution digital elevation models obtained whit unmanned aerial vehicles (UAV) survey. We describe and characterized four main geomorphological units, 20 subunits, 66 hummocks, and the general drainage network. This map is a valuable tool to identify and quantify risks from mass movement processes.
1. Introduction
Geomorphological maps are basic inputs for terrain understanding and serve as the starting point of specific applications such as landslide hazard and risk assessment linked to mass movement processes (CitationAlcalá-Reygosa et al., 2016; CitationDevoto et al., 2012; CitationEcheverría Arnedo, 1997; CitationLoibl & Lehmkuhl, 2013; CitationQuesada-Román & Zamorano-Orozco, 2019a; CitationTripodo et al., 2012). Our work presents a detailed geomorphological map of the El Estribo volcanic complex () – a regionally important tourist destination inhabited by more than 7900 people (CitationINEGI, 2011). This study belongs to an ongoing geomorphological inventory aimed to identify hazards related to gravitational movements and to evaluate risks in the area. El Estribo is located at the southern part of the Pátzcuaro Lake, an area covered by circa 45 volcanoes (CitationOsorio-Ocampo et al., 2018). The lake has been the site of lacustrine sedimentation since Miocene (CitationIsradé-Alcántara et al., 2005) with suitable conditions for animals (CitationRobles-Camacho et al., 2010) and human occupation (CitationOsorio-Ocampo et al., 2018). Lacustrine sedimentation has been disrupted by tectonic and volcanic processes in the past (CitationGarduño-Monroy et al., 2009a; CitationGarduño-Monroy et al., 2011). Past earthquakes have triggered landslides into the Pátzcuaro Lake such as those recorded for the El Metate, Isla de Janitzio (CitationGarduño-Monroy et al., 2011) and El Estribo volcanoes (CitationPola et al., 2014a). Such landslides surely unleashed tsunamis of unknown dimensions in the lake. Historical earthquakes have been recorded in 1845 and 1858 in this region (CitationIsradé-Alcántara et al., 2005). The Pátzcuaro Lake and its homonymous city are tourist attractions in the State of Michoacán, both visited by more than 100,000 people a year (CitationBocco et al., 1999). Therefore, there is an urgent need to produce a detailed geomorphological map of the El Estribo Volcanic Complex and its outcrops of debris-avalanche deposits exposed on the southern shore of the lake. This map will be useful for local authorities responsible for mapping landslide and hazard susceptibility, which is crucial for land-use planning in the area.
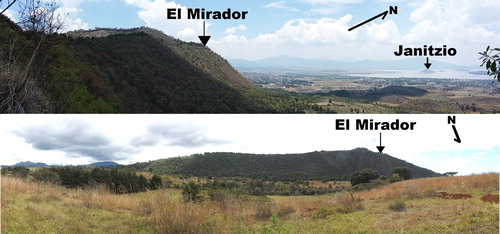
Figure 1. Up shows perspective view from the eastern scarp of El Estribo, Pátzcuaro Lake and the island of Janitzio (scoria cone). Down shows El Estribo cinder cone as seen from south (photographs of Gemma Gómez-Castillo).
2. Geographic, geological and tectonic contexts
The El Estribo Volcanic Complex is located within the Trans-Mexican Volcanic Belt (TMVB), an active continental volcanic arc that runs across central Mexico ((a)). The TMVB extends 1000 km from the states of Nayarit in the Pacific coast to Veracruz in the Gulf of Mexico (CitationDemant, 1979). It is formed by large stratovolcanoes, calderas and monogenetic volcanoes in certain areas named ‘volcanic fields’ (CitationMacías, 2005). The Michoacán–Guanajuato Volcanic Field (MGVF) is located in the central western part of the TMVB (CitationHasenaka & Carmichael, 1985), comprises nearly 900 cinder cones, 100 small structures (cones, domes, thick lava flows, etc.), and over 300 medium size volcanoes, but lacks of active ones (CitationHasenaka, 1994; CitationHasenaka et al., 1994) ((b)). Several volcanoes with partial collapse of their flanks occur within the TMVB (CitationCapra et al., 2002), one of which is the Late Pleistocene El Estribo Volcanic Complex, located south of Pátzcuaro Lake (CitationPola et al., 2014a; (c)). El Estribo is made up of a basal shield volcano (dated at 126,000 ± 7000 ybp) that is crowned by a cinder cone separated by a paleosol dated at 28,360 ± 170 ybp. The shield volcano is cut by an E–W normal fault exposing its basal diameter and 200 m of piled-up lava flows that doesn't affect the cinder cone above. This fault scarp is associated to a basal and an upper debris-avalanche deposits of different ages and an exposed hummocky topography placed north of the volcanic structure and along the southern shore of the Pátzcuaro Lake (CitationPola et al., 2014a, Citation2015).
Figure 2. (a) Location of the study area within the Trans-Mexican Volcanic Belt (TMVB), (b) the Michoacán-Guanajuato Volcanic Field (MGVF), (c) Location of the study area to the south of Pátzcuaro Lake. TMVB limits were taken from CitationFerrari et al. (2012) and MGVF from CitationMazzarini et al. (2010). White thin lines indicate state boundaries.
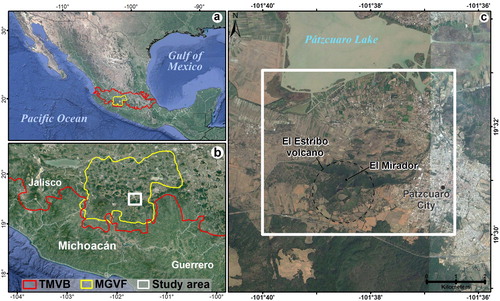
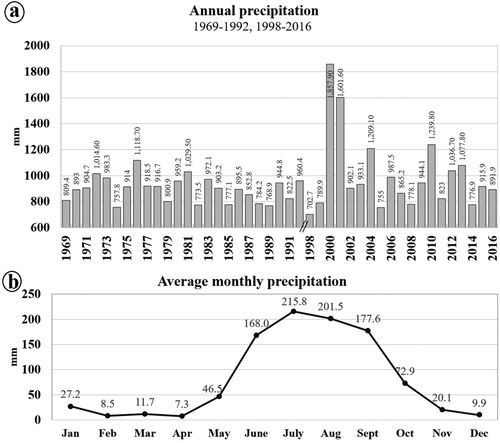
Study area is located in the municipality of Pátzcuaro in the State of Michoacán, covering an area of 35.4 km2 which includes the El Estribo Volcanic Complex, small parts of the city of Pátzcuaro and the homonymous lake. Average annual precipitation in the area is 943 mm ((a)), being July the rainiest month ((b)) (CitationCONAGUA, 2017).
Figure 3. Study area precipitation over a 43 year period between 1969 and 2016. (a) Annual precipitation. (b) Average monthly precipitation. Data from CitationCONAGUA (2017), weather station 16,087 ‘Pátzcuaro’, located at 19.516389° latitude, −101.609722° longitude.
The central part of the TMVB is disrupted by the Morelia-Acambay Fault System (MAFS) that has a predominantly extensional regime with E–W normal faults and NNW-SSE directions (CitationFerrari et al., 2012; CitationGarduño-Monroy et al., 2009b; CitationIsradé-Alcántara et al., 2005; CitationPasquarè et al., 1991; CitationSuter et al., 1992). In the Pátzcuaro area, MAFS is represented by the E–W Jarácuaro and Pátzcuaro faults that form a semi-graben with a N–S extension regime (CitationOsorio-Ocampo et al., 2018; CitationPola et al., 2014b). Paleoseismological studies in the area suggest that severe earthquakes have hit the area during the Holocene (CitationIsradé-Alcántara et al., 2005).
3. Materials and methods
The geomorphological map at a 1:20,000 scale of the El Estribo Volcanic Complex was made using the following inputs: 2008 panchromatic SPOT 5 satellite images at a 5 m spatial resolution, a 1:20,000 scale topographic vector digital data (key E14A22D) of Instituto Nacional de Estadística y Geografía (INEGI) produced in 2011, aerial photographs at a 0.1 m spatial resolution obtained with drone flights made between 2015 and 2016 and field inspections in which the distribution of the landforms and the general morphodynamic processes were observed. The applied approach used two hierarchical levels: geomorphological landscapes and landforms (CitationBocco et al., 1999, Citation2001; Citationde Boer, 1992; CitationZinck, 2016).
First, a digital terrain model (DTM) was made from 10-m-equidistant contour lines (CitationINEGI, 2011), then the DTM was used as input in ArcMap to produce a hillshade model, an elevation map, and a slope map. Next, using ArcMap for calculations and measurements, the slope map was reclassified into seven new ranges representing the potential mass movement according to CitationAceves-Quesada et al. (2014), which was used to make a zonation of landforms relative to the process of vertical erosion, and a relief energy map based on 0.04 km2 quadrants – which expresses the maximum elevation change – use to describe the potential of the denudation and relief evolution processes, and the presence of geological structures and threats (CitationLugo-Hubp, 1988; CitationQuesada-Román & Barrantes-Castillo, 2017). These products supported the interpretation of geomorphological landscapes and landforms following the methodology of CitationFrancioni et al. (2019), CitationMiccadei et al. (2012), CitationMiccadei et al. (2013) and CitationVentura et al. (2005). Hummocks were recognized and identified visually using the hillshade model.
A Phantom 2 Vision Plus (P2V+) and a Phantom 3 Standard (P3S) used for mapping were flown at heights between 100–120 meters above take-off point. Ten flights were completed with P3S (2117 photos), and four with P2V+ (933 photos), acquiring totally 3050 images to map the scarp area. Flights were done at an average speed of 10 m/s (36 km/h), between August 2015 and November 2016. DJI Vision, Pix4DCapture (P2V+), and MapsMadeEasy (P3S) apps were used to achieve homogeneous overlap (80% front, 75% side). Manually flights were also conducted with DJI GO app (P3S). Agisoft PhotoScan Professional (Citation2016) was used to process the information, and a high-resolution DTM at a 0.1 m spatial resolution was generated from a classified dense cloud.
All this information was verified during geological and geomorphological field surveys and the piloting of UAVs. Two different working scales were used for the interpretation of units and hummocks delimitation. In the scarp area, a 1: 500 scale was used with a 4 m2 minimum mappable unit because of DTM high resolution (10 cm/pixel). Remaining areas were mapped at 1:5000 scale using a minimum mappable unit of 400 m2. The geological data (ages, lithology, volcanic stratigraphy, etc.) were taken from CitationOsorio-Ocampo et al. (2018) and CitationPola et al. (2014a, Citation2015). Finally, we designed the geomorphological map by correlating the geomorphological structures with the geology and by establishing categories and subcategories that were easy to identify and interpret in relatively small areas.
4. Results
The main geomorphologic features and characteristics of El Estribo Volcanic Complex are presented in the geomorphological map, such as the main morphometric information (elevation, relief energy, slope), potential mass movement processes and landform distribution. This information was incorporated into six main sections, which are described in the following paragraphs:
4.1. Elevation map
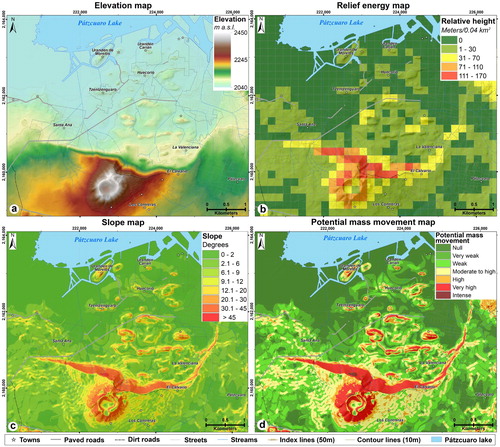
The altimetry analysis of the area identified patterns of the spatial distribution and characteristics of altitudinal contrasts (CitationQuesada-Román & Zamorano-Orozco, 2019b). The elevation map of (a) displays the changes in the elevation of the relief. In this map, the highest point corresponds to the El Estribo cinder cone at 2451 m above sea level (hereafter all elevations are given in meters above sea level) and the lowest the Pátzcuaro Lake at 2040m. The largest area includes elevations between 2040 and 2080m, which represents 54.5% of the study area, and mostly corresponds to the lacustrine plain ((a)), followed by elevations between 2080 and 2280 m (42.6%), morphologically corresponding to gently hillslope, fault scarp, and upper piedmont, and the smaller area corresponds to elevations above 2280 m (2.9%) coinciding with the cinder cone and some high parts of the lava flows.
Figure 4. Thematic maps of the study area: (a) Elevation, represented by stretch values along a color ramp, four standard deviations types, (b) Relief energy, grid of 200 × 200 meters, (c) Slope and (d) Potential mass movement.
4.2. Relief energy map
The relief energy map was obtained by a spatial search of the maximal and minimal elevations every 40,000 m2 followed by the subtraction of the second from the first values, thus finding the maximal difference in elevation within a 200 × 200 m (0.04 km2) grid. A raster map was obtained from the continuous values of the relief energy expressed in m/0.04 km2. The map shows that the highest values (of nearly 170 m) are located along the fault scarp and the cinder cone, and the lowest, on the lacustrine plain ((b)).
4.3. Slope map
Terrain inclination is one of the most important factors of mass movement processes (CitationAceves Quesada et al., 2014; CitationAlcalá-Reygosa et al., 2016; CitationGuzzetti et al., 2012; CitationQuesada-Román & Zamorano-Orozco, 2019a; CitationShrestha & Poudel, 2018) because water erosion has a higher impact in abrupt slopes, which may lead to the acceleration of the process in such areas. The slope map was obtained in ArcMap by algebraic and trigonometric operations using the contour lines to obtain the terrain's inclination degree. The maps show that the predominant slope values on the lacustrine plain vary between 0° and 2°. In the very gentle hillsides surrounding the plains, a value between 2.1° and 6° is dominant. In the upper foothills and gentle slopes that value ranges between 6° and 20°, and in some mountainsides and the fault scarp inclinations are above 30°. Finally, in parts of the cinder cone, the slopes range between 20° and 45°, higher values being only present in the walls of formerly exploited sand and gravel pits ((c)).
4.4. Potential mass movement map
The potential mass movement map is aimed to zoning the landforms in relation with gravitational processes (CitationAceves Quesada et al., 2013, Citation2014; CitationShroder Jr. et al., 2011; Citationvan Beek et al., 2008). This map reclassifies the slope map into the following seven ranks according to CitationAceves Quesada et al. (2014): Null movement, from 0° to 1.5°; very weak movement, from 1.5° to 3°; weak movement, from 3° to 6°; moderate to high movement, from 6° to 12°; high movement, from 12° to 20°; very high movement from 20° to 45°; and intense movement in inclinations above 45°. Most of the lacustrine plain shows null to very weak potential mass movement values while in the fault scarp the potential mass movements are very high and, in some areas, intense ((d)).
4.5. Distribution and characteristics of hummocks
These two debris avalanches and hummocks were previously described (CitationPola et al. 2014a, Citation2014b, Citation2015), however, the authors did not provide detailed estimations of the volume. Thus, the volume (measured in relation to the nearest contour line), convex summit area, and length and orientation of major axes were estimated for the 66 hummocks identified in the debris-avalanche area. In both debris’ avalanches, the volume of hummocks is approximately 184 million cubic meters. Assuming that the original hillside was placed about 300 m to the north of its present location (CitationPola et al., 2014a) and reconstructing the scarp contour line, also called morphoisohypses (CitationLugo-Hubp, 1988; CitationSiebe et al., 1992), we estimated that the volume of the collapsed material was 228 million cubic meters. The purple dashed lines in indicate the limits of the basal and upper debris avalanches. Most of the hummocks of both avalanches have an elongated form and only a few are conical. also shows some trends in the distribution patterns, for example, the largest hummocks originated from the older (basal) and more extensive debris-avalanche deposit – mostly with ample and flattened summits product of their greater age and more prolonged erosion – tend to be distributed towards the outside of the deposit and have a predominantly NE-SW orientation. Instead, the medium and small-sized hummocks are distributed in the center of the deposit and their long axes are variably oriented from east to west. In the case of the younger (upper) debris-avalanche deposit, hummocks have, in general, sharper, more elongate, and narrow summits than in the older avalanche. These hummocks tend to be of low height and small volume in the proximity to the fault scarp, their height and volume increase with distance from the source of the debris up to hummock 43. The orientation of their major axis varies widely in an E–W direction. summarizes the values of each hummock's morphological characteristics.
Figure 5. Location, distribution, volume, and length of major axis of hummocks in the study area. The numbers next to the hummocks correspond to their identifiers (Id) in .
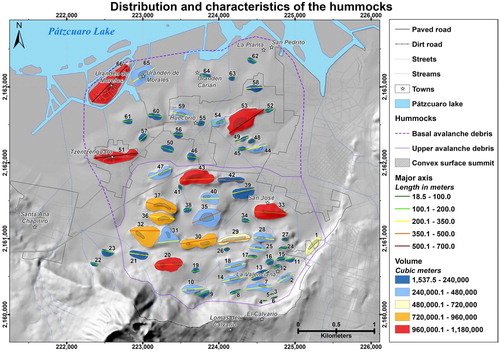
Table 1. Morphological characteristics of hummocks.
4.6. Geomorphological map
The primary landforms in the study area are the product of volcanic and tectonic activities. The erosion of hillsides and accumulation are the result of the runoff and mass movement exogenous processes. The map characterizes the morphogenic categories in a hierarchical classification (CitationBocco et al., 2001; CitationCisneros-Máximo, 2016; CitationZinck, 2016), from which the following major units shown in the map (Main Map) were defined: (I) Highlands; (II) Hills; (III) Piedmont, and (IV) Plains. These units were further subdivided into 18 relief subunits.
I . – Highlands. It includes seven subunits distributed in lava flows and the fault scarp (beige and brown colors). The subunits are 1 – Very gently slopes (Lvg), 2 – Gently slopes (Lgs), 3 – Anthropogenic rubble dumps (Lrd), 4. – Steep slopes (Lss), 5 – Lava front (Llf), 6 – Hillslope shoulders (Lhs), and 7 – Lava flow top (Lft). Subunits 1–3 are located near the fault scarp and are mainly made up of andesitic lavas from the shield volcano (CitationPola et al., 2014a). Subunits 4–6 are morphologically compound of the three portions of a lava flow in the eastern area.
II . – Hills. Includes four subunits of the El Estribo cinder cone (peach color). The first subunit (Hcb) represents the plain in the bottom of the crater composed of alluvial deposits (material remobilized from the crater walls), pyroclastic surges, ash and lapilli falls, and impacts of basaltic andesite blocks. The second subunit (Hvg) corresponds to the very gentle slopes surrounding the crater forming nearly flat surfaces originated by phreatomagmatic explosions that partially collapsed the main crater (CitationPola et al., 2014a, Citation2015). These areas are currently planted with maize. The third subunit (His) is the inner slope of the volcanic cone characterized by a slope opposite to the external part of the cone and the same geological composition of the first and second subunits. The fourth subunit (Hos) is the external hillslope of the volcanic cone compound of the pyroclastic fall deposits of ash and dark-gray blocks. The latter deposits are overlaid by remobilized volcaniclastic deposits with sedimentary structures.
III. Piedmont: Made up of four subunits distributed in the area of the upper debris avalanche and some areas close to slope changes (pink color). The first subunit (Phu) is the hummocks product of the two debris avalanches deposits geologically integrated of light-gray andesitic angular blocks with jigsaw puzzle structure supported by a fine to coarse ash matrix (CitationPola et al., 2014a). The second subunit (Pif) is the inter-hummocky plain that geologically belongs to the upper debris-avalanche deposit made up of a layer of alluvium and little consolidated lava blocks within a fine to coarse sand matrix (CitationPola et al., 2014a). The third subunit (Plp) is the lower piedmont located in the lateral gently slopes of the fault scarp. Its geology is diverse and depends on the location. The fourth subunit (Pup) is the upper piedmont to the south of the fault scarp with variable rock compositions.
IV. Plains: It is divided into three subunits distributed near the lake and in the southern area of the cinder cone. The first subunit (Plf) is the flood plain adjacent to the water surface. It is composed of fine lacustrine sediments, has very low inclinations. Although it is susceptible to flooding, it has remained dry since 1977, in fact, the lake's level has tended to become lower over time (CitationO’Hara, 1993). The second subunit (Plh) is the currently not flooded lacustrine plain, but that has been intermittently flooded during the nineteenth century (CitationO’Hara, 1993). It is also predominantly composed of lacustrine sediments and, in the basal debris-avalanche area, is composed of poorly consolidated gray to reddish massive lava blocks. The third subunit (Pll) corresponds to the inter-lavic plain located to the south between the cinder cone and the lava flows. Geologically, it is made up of three types of rocks, from west to east, the basaltic lavas, the little inclined lava flows from the shield volcano, and the volcaniclastic sediments over which the city of Pátzcuaro is settled.
Besides the above-mentioned subunits, categories were established for a gully (G) and the formerly operating sand and gravel pits (Op). The geological column for the ages has been taken from CitationCohen et al. (2013).
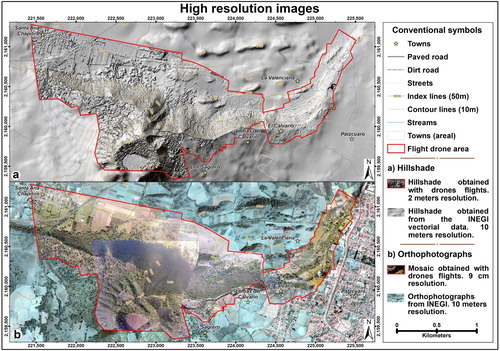
The use of UAVs allowed identifying other smaller previously unrecognized structures ((a)). The use of these tools can be of great help if high-resolution DTMs are unavailable (CitationCook, 2017; CitationTanteri et al., 2017) but it requires software and hardware to quickly analyze the aerial photographs, as well as mixed methods to classify the photogrammetrically generated dense cloud. Utilization of UAVs can become a multitemporal analytic tool if it is intended to monitor an area (CitationHackney & Clayton, 2015; CitationYu et al., 2017). Its use also eased the identification of human activities and land uses, and the comparison of satellite images from previous years ((b)).
Figure 6. Mosaics of high-resolution images obtained from drone flights. The areas outside of the red polygon are references of the contrast in resolution of the information previously available for the study area. (a) Hillshade model; and (b) Rectified orthomosaic.
5. Summary and conclusions
Hierarchical geomorphological mapping has been applied to ecological regionalization (CitationAvers et al., 1993; CitationBailey, 1987; CitationBailey et al., 1985, Citation1994; CitationBocco et al., 1999; CitationCleland et al., 1997; CitationForman, 2014; CitationFu et al., 2004; CitationKlijn et al., 1994), land-use planning (CitationBathrellos et al., 2012; CitationBocco et al., 2001; CitationLópez-Blanco & Villers-Ruiz, 1995), ecological restoration (CitationKondolf, 1995; CitationPalik et al., 2000), river and hydrological basin management (CitationFrissell et al., 1986; CitationGurnell et al., 2016; CitationHawkins et al., 1993; CitationLehotský, 2004; CitationNewson & Newson, 2000; CitationParsons et al., 2003; CitationThomson et al., 2001), and risk analysis (CitationKayastha et al., 2013; CitationPiacentini et al., 2015; CitationSinha et al., 2008; CitationYu et al., 2017), to mention only some of its applications. In our case, the geomorphological map of the El Estribo Volcanic Complex allowed to analyze a volcanic zone with a very complex tectonic and seismic activity that have triggered two landslides during the last 28,000 ybp (Pola et al., Citation2014a).
Our methodology and resulting map (Mai Map) are useful to analyze with new lights the morphological characteristics of hummocks of both debris-avalanche deposits, to differentiate useful features, and to understand their distribution and link them to their origin. In fact, the orientation of the major axis of hummocks indicates the transversal direction of the moving avalanche during the collapse of the rock mass (CitationGlicken, 1991; CitationSiebert, 1984; CitationUi, 1983). Our map did not detect a unique pattern in the orientation of the major axis of hummocks for neither of the two debris avalanches, because the superposition of the two deposits made this task difficult. Authors like CitationDufresne and Davies (2009), CitationSiebe et al. (1992) and CitationSiebert (1996) have explained this phenomenon as a rotation in the horizontal plane taking place as the material is being emplaced. The concentration of bigger hummocks in the far side of the source of the avalanches (Urandén de Morelos Island, Id 66) could be explained by the lack of physical barriers along the path of the avalanche, to the lubricating action of the water body allowing to the avalanche to move a longer distance (CitationDe Blasio et al., 2004; CitationMazzanti & De Blasio, 2010; CitationMohrig et al., 1998) and, to the ‘bulking’ process that incorporates material at the front of the avalanche as it displaces forward (CitationScott et al., 2001; CitationSiebe et al., 1992; CitationSiebert, 1996).
Elaborating a detailed geomorphological map eases the understanding of the endogenous and exogenous processes taking place within a specific area; therefore, it is a valuable tool to aid the identification and quantification of the risks from mass movement processes (CitationBentivenga & Piccarreta, 2016). In addition, the quality of geomorphological maps can be increased by the use of UAVs to obtain orthophotomosaics and high-resolution DTMs allowing supplementing the information and verifying it in the field (CitationCook, 2017; CitationFrancioni et al., 2018). The methodology applied in this work provides a quick and effective way to identify the main morphostructural features, which might facilitate its use for land planning and for managing and mitigating risks, minimizing the time and cost needed for that. Our review of the literature showed that our geomorphological map (Main Map) is one of the few to be published on a volcanic structure at such high resolution (10 cm/pixel) of inputs and analysis, and therefore, we consider it an excellent tool to analyze the geomorphological risk.
Finally, the combination of geomorphology and geology offers a broader perspective of the behavior and functioning of a volcanic area and its associated tectonic processes. Also, the hierarchical approach used for the geomorphological mapping can be applied at different scales having the advantage of being replicable in similar areas, even those having a larger surface.
Software
Esri ArcMap 10.4 software was used for georeferencing, digitizing, visualizing orthorectified aerial photographs or remote sensing images, for spatial and statistical analysis, and for Layout map design.
Main_Map_21mayo20_600dpi.pdf
Download PDF (5.9 MB)Main_Map_21mayo20_300dpi.pdf
Download PDF (2.9 MB)Acknowledgements
Thanks are due to CONACyT for the granted PhD scholarship and to the ‘Evaluación de la importancia relativa de bosque húmedo de niebla bajo un enfoque de paisaje’ project. We thank Antonio Pola, Susana Osorio, Laura García, Jaime Paneque, Luis Miguel Morales and Paz Coba for their participation in the field work. Manuel Mendoza acknowledges the sabbatical stay scholarship provided by the PASPA-UNAM and to Dr. Rick Giardino from Texas A&M University for commenting a previous version of this article. This peace of research is part of the Interinstitutional Lab of Hazard and Risk Evaluation of UNAM.
Disclosure statement
No potential conflict of interest was reported by the author(s).
Additional information
Funding
Related Research Data
References
- Aceves Quesada, F., Legorreta Paulín, G., & Álvarez Ruíz, Y. (2014). Cartografía geomorfológica para el inventario de procesos gravitacionales en la cuenca endorreica del arroyo La Ciénega, flanco oriental del volcán Nevado de Toluca [Geomorphological mapping for the inventory of gravitational processes in the endorheic basin of the La Ciénega stream, eastern flank of the Nevado de Toluca volcano]. Boletín de la Sociedad Geológica Mexicana, 66(2), 329–342. https://doi.org/10.18268/BSGM2014v66n2a8
- Aceves Quesada, F., Martínez Luna, V. M., & Legorreta Paulín, G. (2013). Gravitational processes in the eastern flank of the Nevado de Toluca México. In C. Margottini, P. Canuti, & K. Sassa (Eds.), Landslide science and practice, volume 1: Landslide inventory and susceptibility and hazard zoning (pp. 211–219).
- AgiSoft PhotoScan Professional (Version 1.2.6) (Software). (2016). http://www.agisoft.com/downloads/installer/
- Alcalá-Reygosa, J., Palacios, D., & Zamorano Orozco, J. J. (2016). Geomorphology of the Ampato volcanic complex (Southern Peru). Journal of Maps, 12(5), 1160–1169. https://doi.org/10.1080/17445647.2016.1142479
- Autodesk, I. (2016). Agisoft PhotoScan Professional 1.2.6. [Computer software].
- Avers, P. E., Cleland, D. T., & McNab, H. (1993). National hierarchical framework of ecological units. In L. H. Foley (Ed.), Silviculture: From the crane of forestry to ecosystem management. Proceedings of the National Silviculture Workshop (pp. 48–61). USDA Forest Service.
- Bailey, R. G. (1987). Suggested hierarchy of criteria for multi-scale ecosystem mapping. Landscape and Urban Planning, 14, 313–319. https://doi.org/10.1016/0169-2046(87)90042-9
- Bailey, R. G., Jensen, M. E., Cleland, D. T., & Bourgeron, P. S. (1994). Design and use of ecological mapping units. In M. E. Jensen & P. S. Bourgeron (Eds.), Ecosystem management: Principles and applications (pp. 95–106). U.S. Department of Agriculture, Forest Service. US. Department of Agriculture, Northern Region. The Nature Conservancy.
- Bailey, R. G., Zoltai, S. C., & Wiken, E. B. (1985). Ecological regionalization in Canada and the United States. Geoforum; Journal of Physical, Human, and Regional Geosciences, 16, 265–275. https://doi.org/10.1016/0016-7185(85)90034-X
- Bathrellos, G. D., Gaki-Papanastassiou, K., Skilodimou, H. D., Papanastassiou, D., & Chousianitis, K. G. (2012). Potential suitability for urban planning and industry development using natural hazard maps and geological–geomorphological parameters. Environmental Earth Sciences, 66(2), 537–548. https://doi.org/10.1007/s12665-011-1263-x
- Bentivenga, M., & Piccarreta, M. (2016). Geomorphology of Pisticci area (Basilicata, southern Italy). Journal of Maps, 12(suppl 1), 220–226. https://doi.org/10.1080/17445647.2016.1193776
- Bocco, G., Mendoza, M. E., & Velázquez, A. (2001). Remote sensing and GIS-based regional geomorphological mapping – a tool for land use planning in developing countries. Geomorphology, 39(3–4), 211–219. https://doi.org/10.1016/S0169-555X(01)00027-7
- Bocco, G., Mendoza, M. E., Velázquez, A., & Torres, A. (1999). La regionalización geomorfológica como una alternativa de regionalización ecológica en méxico. El caso de Michoacán de Ocampo [Geomorphological regionalization as an alternative to ecological regionalization in Mexico. The case of Michoacán de Ocampo]. Investigaciones Geográficas, 40, 7–22. ISSN 2448-7279. https://doi.org/10.14350/rig.59091
- Capra, L., Macías, J. L., Scott, K. M., Abrams, M., & Garduño Monroy, V. H. (2002). Debris avalanches and debris flows transformed from collapses in the Trans-Mexican Volcanic Belt, Mexico – behavior, and implications for hazard assessment. Journal of Volcanology and Geothermal Research, 113(1–2), 81–110. https://doi.org/10.1016/S0377-0273(01)00252-9
- Cisneros-Máximo, G. (2016). Estudio geológico-geomorfológico de los volcanes Tetillas-Quinceo, Morelia, Michoacán. Propuesta de cartografía jerárquica. Master in Science, Universidad Nacional Autónoma de México.
- Cleland, D. T., Avers, P. E., McNab, W. H., Jensen, M. E., Bailey, R. G., King, T., & Russell, W. E. (1997). National hierarchical framework of ecological units. In M. S. Boyce, & A. Haney (Eds.), Ecosystem management applications for sustainable forest and wildlife resources (pp. 181–200). Yale University.
- Cohen, K. M., Finney, S. C., Gibbard, P. L., & Fan, J.-X. (2013). The ICS international chronostratigraphic chart. Episodes, 36(3), 199–204. http://www.stratigraphy.org/ICSchart/ChronostratChart2020-01.pdf https://doi.org/10.18814/epiiugs/2013/v36i3/002
- CONAGUA. (2017). Información Estadística Climatológica de la estación 16087 ‘Pátzcuaro’, serie de datos de 1969 a 2016. Estación localizada en Pátzcuaro, Michoacán, México, en las coordenadas 19.516389° de latitud y -101.609722° de longitud. Comisión Nacional del Agua, México.
- Connor, C. B. (1987). Structure of the Michoacan-Guanajuato volcanic field, Mexico. Journal of Volcanology and Geothermal Research, 33(1-3), 191–200. https://doi.org/10.1016/0377-0273(87)90061-8
- Cook, K. L. (2017). An evaluation of the effectiveness of low-cost UAVs and structure from motion for geomorphic change detection. Geomorphology, 278, 195–208. https://doi.org/10.1016/j.geomorph.2016.11.009
- De Blasio, F. V., Engvik, L., Harbitz, C. B., & Elverhøi, A. (2004). Hydroplaning and submarine debris flows. Journal of Geophysical Research, 109(C1), 15. https://doi.org/10.1029/2002JC001714
- De Boer, D. H. (1992). Hierarchies and spatial scale in process geomorphology: A review. Geomorphology, 4(5), 303–318. https://doi.org/10.1016/0169-555X(92)90026-K
- Demant, A. (1979). Vulcanología y petrografía del sector occidental del Eje Neovolcánico. Revista del Instituto de Geología, Universidad Nacional Autónoma de México, 3, 39–57. ISSN-e 2007-2902.
- Devoto, S., Biolchi, S., Bruschi, V. M., Furlani, S., Mantovani, M., Piacentini, D., Pasuto, A., & Soldati, M. (2012). Geomorphological map of the NW coast of the Island of Malta (Mediterranean Sea). Journal of Maps, 8(1), 33–40. https://doi.org/10.1080/17445647.2012.668425
- Dufresne, A., & Davies, T. R. (2009). Longitudinal ridges in mass movement deposits. Geomorphology, 105(3–4), 171–181. https://doi.org/10.1016/j.geomorph.2008.09.009
- Echeverría Arnedo, M. T. (1997). Cartografía geomorfológica temática y aplicada. In J. L. Peña Moné (Ed.), Cartografía Geomorfológica básica y Aplicada (pp. 147–182). Geoforma Ediciones.
- Ferrari, L., Orozco-Esquivel, T., Manea, V., & Manea, M. (2012). The dynamic history of the Trans-Mexican Volcanic Belt and the Mexico subduction zone. Tectonophysics, 522-523, 122–149. https://doi.org/10.1016/j.tecto.2011.09.018
- Forman, R. T. T. (2014). Land mosaics: The ecology of landscapes and regions. In F. O. Ndubisi (Ed.), The ecological design and planning reader (pp. 217–234). Island Press.
- Francioni, M., Calamita, F., Coggan, J., De Nardis, A., Eyre, M., Miccadei, E., Piacentini, T., Stead, D., & Sciarra, N. (2019). A multi-disciplinary approach to the study of large rock avalanches combining remote sensing, GIS and field surveys: The case of the Scanno landslide, Italy. Remote Sensing, 11(13), 1570. https://doi.org/10.3390/rs11131570
- Francioni, M., Salvini, R., Stead, D., & Coggan, J. (2018). Improvements in the integration of remote sensing and rock slope modelling. Natural Hazards, 90(2), 975–1004. https://doi.org/10.1007/s11069-017-3116-8
- Frissell, C. A., Liss, W. J., Warren, C. E., & Hurley, M. D. (1986). A hierarchical framework for stream habitat classification: Viewing streams in a watershed context. Environmental Management, 10(2), 199–214. https://doi.org/10.1007/BF01867358
- Fu, B.-J., Liu, G.-H., Lü, Y.-H., Chen, L.-D., & Ma, K.-M. (2004). Ecoregions and ecosystem management in China. International Journal of Sustainable Development & World Ecology, 11(4), 397–409. https://doi.org/10.1080/13504500409469842
- Garduño-Monroy, V. H., Chávez-Hernández, J., Aguirre-González, J., Vázquez-Rosas, R., Mijares Arellano, H., Israde-Alcántara, I., Hernández-Madrigal, V. M., Rodríguez-Pascua, M. A., & Pérez López, R. (2009a). Zonificación de los periodos naturales de oscilación superficial en la ciudad de pátzcuaro, Mich., méxico, con base en microtremores y estudios de paleosismología (zoning of natural periods of surface oscillation in the city of pátzcuaro, Mich., Mexico, based on microtremores and paleosismology studies). Revista Mexicana de Ciencias Geológicas, 26, 623–637. ISSN 2007-2902.
- Garduño-Monroy, V. H., Pérez-Lopez, R., Israde-Alcantara, I., Rodríguez-Pascua, M. A., Szynkaruk, E., Hernández-Madrigal, V. M., García-Zepeda, M. L., Corona-Chávez, P., Ostroumov, M., Medina-Vega, V. H., García-Estrada, G., Carranza, O., López-Granados, E., & Mora Chaparro, J. C. (2009b). Paleoseismology of the southwestern Morelia-Acambay fault system, Central Mexico. Geofísica Internacional, 48, 319–335. ISSN: 0016-7169.
- Garduño-Monroy, V. H., Soria-Caballero, D. C., Israde-Alcántara, I., Hernández-Madrigal, V. M., Rodríguez-Ramírez, A., Ostroumov, M., Rodríguez-Pascua, M. A., Chacon-Torres, A., & Mora-Chaparro, J. C. (2011). Evidence of tsunami events in the paleolimnological record of Lake Pátzcuaro, Michoacán. México. Geofísica Internacional, 50, 147–161. https://doi.org/10.22201/igeof.00167169p.2011.50.2.135
- Glicken, H. (1991). Sedimentary architecture of large volcanic debris avalanches. In R. V. Fisher, & G. A. Smith (Eds.), Sedimentation in volcanic settings. Society of economic paleontologists and mineralogists. (pp. 99–109) https://doi.org/10.2110/pec.91.45.0099
- Gurnell, A. M., Rinaldi, M., Belletti, B., Bizzi, S., Blamauer, B., Braca, G., Buijse, A. D., Bussettini, M., Camenen, B., Comiti, F., Demarchi, L., García De Jalón, D., González Del Tánago, M., Grabowski, R. C., Gunn, I. D. M., Habersack, H., Hendriks, D., Henshaw, A. J., Klösch, M., … Ziliani, L. (2016). A multi-scale hierarchical framework for developing understanding of river behaviour to support river management. Aquatic Sciences, 78(1), 1–16. https://doi.org/10.1007/s00027-015-0424-5
- Guzzetti, F., Mondini, A. C., Cardinali, M., Fiorucci, F., Santangelo, M., & Chang, K.-T. (2012). Landslide inventory maps: New tools for an old problem. Earth-Science Reviews, 112(1–2), 42–66. https://doi.org/10.1016/j.earscirev.2012.02.001
- Hackney, C., & Clayton, A. I. (2015). Unmanned aerial vehicles (UAVs) and their application in geomorphic mapping. In S. J. Cook, L. E. Clarke, & J. M. Nield (Eds.), Geomorphological techniques (pp. 1–12). London: British Society for Geomorphology. ISSN 2047-0371.
- Hasenaka, T. (1994). Size, distribution, and magma output rate for shield volcanoes of the Michoacán-Guanajuato volcanic field, Central Mexico. Journal of Volcanology and Geothermal Research, 63(1–2), 13–31. https://doi.org/10.1016/0377-0273(94)90016-7
- Hasenaka, T., Ban, M., & Delgado Granados, H. (1994). Contrasting volcanism in the Michoacán-Guanajuato volcanic field, Central Mexico: Shield volcanoes vs. cinder cones. Geofísica Internacional, 33, 125–138. ISSN: 0016-7169.
- Hasenaka, T., & Carmichael, I. S. E. (1985). The cinder cones of Michoacán-Guanajuato, Central Mexico: Their age, volume and distribution, and magma discharge rate. Journal of Volcanology and Geothermal Research, 25(1–2), 105–124. https://doi.org/10.1016/0377-0273(85)90007-1
- Hawkins, C. P., Kershner, J. L., Bisson, P. A., Bryant, M. D., Decker, L. M., Gregory, S. V., Mccullough, D. A., Overton, C. K., Reeves, G. H., Steedman, R. J., & Young, M. K. (1993). A hierarchical approach to classifying stream habitat features. Fisheries, 18(6), 3–12. https://doi.org/10.1577/1548-8446(1993)018
- INEGI. (2011). Censo de Población y Vivienda 2010. Resultados definitivos. Instituto Nacional de Estadística y Geografía, México.
- Isradé-Alcántara, I., Garduño-Monroy, V. H., Fisher, C. T., Pollard, H. P., & Rodríguez-Pascua, M. A. (2005). Lake level change, climate, and the impact of natural events: The role of seismic and volcanic events in the formation of the Lake Patzcuaro Basin, Michoacan, Mexico. Quaternary International, 135(1), 35–46. https://doi.org/10.1016/j.quaint.2004.10.022
- Kayastha, P., Dhital, M. R., & De Smedt, F. (2013). Application of the analytical hierarchy process (AHP) for landslide susceptibility mapping: A case study from the Tinau watershed, West Nepal. Computers & Geosciences, 52, 398–408. https://doi.org/10.1016/j.cageo.2012.11.003
- Klijn, F., De Haes, U., & A, H. (1994). A hierarchical approach to ecosystems and its implications for ecological land classification. Landscape Ecology, 9(2), 89–104. https://doi.org/10.1007/BF00124376
- Kondolf, G. M. (1995). Geomorphological stream channel classification in aquatic habitat restoration: Uses and limitations. Aquatic Conservation: Marine and Freshwater Ecosystems, 5(2), 127–141. https://doi.org/10.1002/aqc.3270050205
- Lehotský, M. (2004). River morphology hierarchical classification (RMHC). Acta Universitatis Carolinae, 1, 33–45.
- Loibl, D., & Lehmkuhl, F. (2013). High-resolution geomorphological map of a low mountain range near Aachen, Germany. Journal of Maps, 9(2), 245–253. https://doi.org/10.1080/17445647.2013.771291
- López-Blanco, J., & Villers-Ruiz, L. (1995). Delineating boundaries of environmental units for land management using a geomorphological approach and GIS: A study in Baja California, Mexico. Remote Sensing of Environment, 53(2), 109–117. https://doi.org/10.1016/0034-4257(95)00044-2
- Lugo-Hubp, J. I. (1988). Elementos de Geomorfología Aplicada (métodos cartográficos). Universidad Nacional Autónoma de México.
- Macías, J. L. (2005). Geología e historia eruptiva de algunos de los grandes volcanes activos de México. Boletín de la Sociedad Geológica Mexicana, Volumen conmemorativo del centenario, Temas Selectos de la Geología Mexicana, tomo LVII, 379-424.
- Mazzanti, P., & De Blasio, F. V. (2010). Peculiar morphologies of subaqueous landslide deposits and their relationship to flow dynamics. In D. C. Mosher, C. Shipp, L. Moscardelli, J. Chaytor, C. Baxter, H. Lee, & R. Urgeles (Eds.), Submarine mass movements and their consequences (pp. 141–151).
- Mazzarini, F., Ferrari, L., & Isola, I. (2010). Self-similar clustering of cinder cones and crust thickness in the Michoacan-Guanajuato and Sierra de Chichinautzin volcanic fields, Trans-Mexican Volcanic Belt. Tectonophysics, 486(1–4), 55–64. https://doi.org/10.1016/j.tecto.2010.02.009
- Miccadei, E., Piacentini, T., Dal Pozzo, A., La Corte, M., & Sciarra, M. (2013). Morphotectonic map of the Aventino-lower Sangro Valley (Abruzzo, Italy), scale 1:50,000. Journal of Maps, 9(3), 390–409. https://doi.org/10.1080/17445647.2013.799050
- Miccadei, E., Piacentini, T., Gerbasi, F., & Daverio, F. (2012). Morphotectonic map of the Osento River Basin (Abruzzo, Italy), scale 1:30,000. Journal of Maps, 8(1), 62–73. https://doi.org/10.1080/17445647.2012.668764
- Mohrig, D., Whipple, K. X., Hondzo, M., Ellis, C., & Parker, G. (1998). Hydroplaning of subaqueous debris flows. Geological Society of America Bulletin, 110(3), 387–394. https://doi.org/10.1130/0016-7606(1998)110<0387:HOSDF>2.3.CO;2
- Newson, M. D., & Newson, C. L. (2000). Geomorphology, ecology and river channel habitat: Mesoscale approaches to basin-scale challenges. Progress in Physical Geography: Earth and Environment, 24(2), 195–217. https://doi.org/10.1177/030913330002400203
- O’hara, S. L. (1993). Historical evidence of fluctuations in the level of Lake pátzcuaro, Michoacán, México over the last 600 years. The Geographical Journal, 159(1), 51–62. https://doi.org/10.2307/3451489
- Osorio-Ocampo, S., Macías, J. L., Pola, A., Cardona-Melchor, S., Sosa-Ceballos, G., Garduño-Monroy, V. H., Layer, P. W., García-Sánchez, L., Perton, M., & Benowitz, J. (2018). The eruptive history of the Pátzcuaro Lake area in the Michoacán Guanajuato volcanic field, Central México: Field mapping, C-14 and 40Ar/39Ar geochronology. Journal of Volcanology and Geothermal Research, 358, 307–328. https://doi.org/10.1016/j.jvolgeores.2018.06.003
- Palik, B. J., Goebel, P. C., Kirkman, L. K., & West, L. (2000). Using landscape hierarchies to guide restoration of disturbed ecosystems. Ecological Applications, 10(1), 189–202. https://doi.org/10.1890/1051-0761(2000)010[0189:ULHTGR]2.0.CO;2
- Parsons, M., Thoms, M. C., & Norris, R. H. (2003). Scales of macroinvertebrate distribution in relation to the hierarchical organization of river systems. Journal of the North American Benthological Society, 22(1), 105–122. https://doi.org/10.2307/1467981
- Pasquarè, G., Ferrari, L., Garduño Monroy, V. H., Tibaldi, A., & Vezzoli, L. (1991). Geologic map of the central sector of the Mexican Volcanic Belt, states of Guanajuato and Michoacán, Mexico, Geological Society of America. Geological Society of America, Map and Chart Series, MCH072, 22 (pp. 1–21). https://doi.org/10.18268/BSGM2000v53n1a5
- Piacentini, D., Devoto, S., Mantovani, M., Pasuto, A., Prampolini, M., & Soldati, M. (2015). Landslide susceptibility modeling assisted by Persistent Scatterers Interferometry (PSI): An example from the northwestern coast of Malta. Natural Hazards, 78(1), 681–697. https://doi.org/10.1007/s11069-015-1740-8
- Pola, A., Macías, J. L., Garduño-Monroy, V. H., Osorio-Ocampo, S., & Cardona-Melchor, S. (2014a). Successive collapses of the El Estribo volcanic complex in the Pátzcuaro Lake, Michoacán, México. Journal of Volcanology and Geothermal Research, 289, 41–50. https://doi.org/10.1016/j.jvolgeores.2014.10.011
- Pola, A., Macías, J. L., Osorio-Ocampo, S., Garduño-Monroy, V. H., Melchor, S., & Martínez-Martínez, J. (2014b). Geological setting, volcanic stratigraphy, and flank failure of the El Estribo volcano, Pátzcuaro (Michoacán, Mexico). In R. Rocha, J. Pais, J. Kullberg, & S. Finney (Eds.), STRATI 2013 (pp. 1251–1256). Springer Geology.
- Pola, A., Macías, J. L., Osorio-Ocampo, S., Sosa-Ceballos, G., Garduño-Monroy, V. H., & Martínez-Martínez, J. (2015). El Estribo volcanic complex: Evolution from a shield volcano to a cinder cone, Pátzcuaro Lake, Michoacán, México. Journal of Volcanology and Geothermal Research, 303, 130–145. https://doi.org/10.1016/j.jvolgeores.2015.07.032
- Quesada-Román, A., & Barrantes-Castillo, G. (2017). Modelo morfométrico para determinar áreas susceptibles a procesos de ladera [Morphometric model to determine areas susceptible to slope processes]. Investigaciones Geográficas, 94, 1–12. https://doi.org/10.14350/rig.57318
- Quesada-Román, A., & Zamorano-Orozco, J. J. (2019a). Geomorphology of the Upper General River Basin, Costa Rica. Journal of Maps, 15(2), 94–100. https://doi.org/10.1080/17445647.2018.1548384
- Quesada-Román, A., & Zamorano-Orozco, J. J. (2019b). Zonificación de procesos de ladera e inundaciones a partir de un análisis morfométrico en la cuenca alta del río general, Costa Rica. Investigaciones Geográficas, 99, 1–19. https://doi.org/10.14350/rig.59843
- Robles-Camacho, J., Corona-Chávez, P., Guzmán, A. F., Polaco, ÓJ, Domínguez-Vázquez, G., Israde-Alcántara, I., & Oliveros-Morales, A. (2010). Estratigrafía y paleoambiente asociados a un Gomphoteriidae (Cuvieronius hyodon) en Tzintzuntzan, Michoacán, México. Revista Mexicana de Ciencias Geológicas, 27, 530–544. ISSN 2007-2902.
- Scott, K. M., Macias, J. L., Naranjo, J. A., Rodriguez, S., & Mcgeehin, J. P. (2001). Catastrophic debris flows transformed from landslides in volcanic terrains: Mobility, hazard assessment and mitigation strategies. Professional Paper United States Department of Interior. United States Geological Survey. https://doi.org/10.3133/pp1630
- Shrestha, H. L., & Poudel, M. (2019). Landslide susceptibility zonation mapping in post-earthquake scenario in Gorkha District. Forestry: Journal of Institute of Forestry, Nepal, 15, 45–56. https://doi.org/10.3126/forestry.v15i0.24920
- Shroder Jr, J. F., Owen, L. A., Bae Seong, Y., Bishop, M. P., Bush, A., Caffee, M. W., Copland, L., Finkel, R. C., & Kamp, U. (2011). The role of mass movements on landscape evolution in the central Karakoram: Discussion and speculation. Quaternary International, 236(1–2), 34–47. https://doi.org/10.1016/j.quaint.2010.05.024
- Siebe, C., Komorowski, J.-C., & Sheridan, M. F. (1992). Morphology and emplacement of an unusual debris-avalanche deposit at Jocotitlán volcano, Central Mexico. Bulletin of Volcanology, 54(7), 573–589. https://doi.org/10.1007/BF00569941
- Siebert, L. (1984). Large volcanic debris avalanches: Characteristics of source areas, deposits, and associated eruptions. Journal of Volcanology and Geothermal Research, 22(3-4), 163–197. https://doi.org/10.1016/0377-0273(84)90002-7
- Siebert, L. (1996). Hazards of large volcanic debris avalanches and associated eruptive phenomena. In R. Carpa & R. Tilling (Eds.), Monitoring and mitigation of volcano hazards (pp. 541–572). Springer.
- Sinha, R., Bapalu, G. V., Singh, L. K., & Rath, B. (2008). Flood risk analysis in the Kosi River Basin, North Bihar using multi-parametric approach of Analytical Hierarchy Process (AHP). Journal of the Indian Society of Remote Sensing, 36(4), 335–349. https://doi.org/10.1007/s12524-008-0034-y
- Suter, M., Quintero, O., & Johnson, C. A. (1992). Active faults and state of stress in the central part of the Trans-Mexican Volcanic Belt, Mexico 1. The Venta de Bravo Fault. Journal of Geophysical Research, 97(B8), 11983–11994. https://doi.org/10.1029/91JB00428
- Tanteri, L., Rossi, G., Tofani, V., Vannocci, P., Moretti, S., & Casagli, N. (2017). Multitemporal UAV survey for mass movement detection and monitoring. In M. Mikos, B. Tiwari, Y. Yin, & K. Sassa (Eds.), Advancing culture of living with landslides. WLF 2017 (pp. 153–161). Springer, Cham.
- Thomson, J. R., Taylor, M. P., Fryirs, K. A., & Brierley, G. J. (2001). A geomorphological framework for river characterization and habitat assessment. Aquatic Conservation: Marine and Freshwater Ecosystems, 11(5), 373–389. https://doi.org/10.1002/aqc.467
- Tripodo, A., Casella, A., Pino, P., Mandarano, M., & Rasa, R. (2012). Geomorphological map of the Lipari Volcanic Island (Aeolian Archipelago – Italy). Journal of Maps, 8(1), 107–112. https://doi.org/10.1080/17445647.2012.668770
- Ui, T. (1983). Volcanic dry avalanche deposits — identification and comparison with nonvolcanic debris stream deposits. Journal of Volcanology and Geothermal Research, 18(1–4), 135–150. https://doi.org/10.1016/0377-0273(83)90006-9
- Van Beek, R., Cammeraat, E., Andreu, V., Mickovski, S. B., & Dorren, L. (2008). Hillslope processes: Mass wasting, slope stability and erosion. In J. E. Norris, A. Stokes, S. B. Mickovski, E. Cammeraat, R. Van Beek, B. C. Nicoll, & A. Achim (Eds.), Slope stability and erosion control: Ecotechnological solutions (pp. 17–64). Springer Science.
- Ventura, G., Vilardo, G., Bronzino, G., Gabriele, G., Nappi, R., & Terranova, C. (2005). Geomorphological map of the Somma-Vesuvius volcanic complex (Italy). Journal of Maps, 1(1), 30–37. https://doi.org/10.4113/jom.2005.8
- Yu, M., Huang, Y., Zhou, J., & Mao, L. (2017). Modeling of landslide topography based on micro-unmanned aerial vehicle photography and structure-from-motion. Environmental Earth Sciences, 76(1), 1–9. https://doi.org/10.1007017-6860-x
- Zinck, J. A. (2016). The geomorphic landscape: Criteria for classifying geoforms. In J. A. Zinck, G. Metternicht, G. Bocco, & H. F. Del Valle (Eds.), Geopedology: An integration of geomorphology and pedology for soil and landscape studies (pp. 77–99). Springer.