
ABSTRACT
The Devon Ice Cap (DIC) is one of the largest ice masses in the Canadian Arctic. Each summer, extensive supraglacial river networks develop on the DIC surface and route large volumes of meltwater from ice caps to the ocean. Mapping their extent and understanding their temporal evolution are important for validating runoff routing and melt volumes predicted by regional climate models (RCMs). We use 10 m Sentinel-2 images captured on 28 July and 10/11 August 2016 to map supraglacial rivers across the entire DIC (12,100 km2). Both dendritic and parallel supraglacial drainage patterns are found, with a total length of 44,941 km and a mean drainage density (Dd) of 3.71 km−1. As the melt season progresses, Dd increases and supraglacial rivers form at progressively higher elevations. There is a positive correlation between RCM-derived surface runoff and satellite-mapped Dd, suggesting that supraglacial drainage density is primarily controlled by surface runoff.
1. Introduction
The Arctic contains numerous large ice masses including the Greenland Ice Sheet, Devon Ice Cap (DIC) and Agassiz Ice Cap, with a total collective area of approximately two million square kilometers (CitationAbdalati et al., 2004; CitationCook et al., 2019; CitationGardner et al., 2011). The Arctic is also highly sensitive to global climate change (CitationScreen & Simmonds, 2010), and is currently warming at roughly twice the global average rate, with annual air temperatures for October 2015 to September 2016 averaging +2.0°C warmer than the 1981–2010 average (CitationRichter-Menge et al., 2016). Associated mass loss from Arctic ice masses contributed ∼31% of observed global sea level rise between 1992 and 2017 (CitationBox et al., 2018), with annual ice mass losses averaging 50.2 Gt a−1 in the Canadian Arctic, over twice the pre-1996 average (CitationNoël et al., 2018). It is therefore essential to understand factors that affect the prevalence, spatial pattern, and transport of surface meltwater from Arctic ice masses to oceans.
During 2016, the warmest year in the Arctic since 1900 (CitationRichter-Menge et al., 2016), Arctic ice masses experienced significant surface melt, which formed large and complex supraglacial river networks at their lower elevations in summer (CitationPitcher & Smith, 2019). Where supraglacial rivers terminate in moulins, large volumes of surface meltwater are transferred to the ice bed, influencing the evolution of subglacial hydrological systems and ice flow dynamics (CitationChu, 2014; CitationIken & Bindschadler, 1986; CitationPitcher & Smith, 2019; CitationRöthlisberger & Iken, 1981; CitationSchoof, 2010; CitationSundal et al., 2011). Although the spatial structure of these supraglacial river networks is thought to be controlled by the surface topography (CitationYang et al., 2015a) through the transfer of bed variability to the ice surface at the large scale (CitationCrozier et al., 2018; CitationIgnéczi et al., 2018), their temporal evolution is affected by the rate and magnitude of meltwater production and the permeability of glacier surface throughout the melt season (CitationIrvine-Fynn et al., 2011; CitationLampkin & Vanderberg, 2014).
In general, large supraglacial river networks have only recently begun attracting scientific attention with most studies focused on the Greenland Ice Sheet (CitationColgan et al., 2011; CitationCrozier et al., 2018; CitationGleason et al., 2016; CitationIgnéczi et al., 2018; CitationKing et al., 2016; CitationLampkin & Vanderberg, 2014; CitationLegleiter et al., 2014; CitationPitcher & Smith, 2019; CitationPoinar et al., 2015; CitationSmith et al., 2015; CitationSmith et al., 2017; Yang & Smith, Citation2016). Yang et al. (Citation2019a) mapped small areas of the Devon and Barnes Ice Caps (as well as the northwest Greenland Ice Sheet) using 10 m Sentinel-2 visible/near-infrared satellite images and found that the drainage patterns and densities of supraglacial river networks may differ significantly within and between different ice masses.
Previous studies have documented supraglacial river formation on the DIC (CitationFernandes et al., 2018; CitationWyatt, 2013; CitationWyatt & Sharp, 2015; CitationYang et al., 2019a). CitationWyatt (Citation2013) manually digitized supraglacial rivers across the DIC from Landsat 7 ETM+ imagery acquired during the 1999 summer, revealing that both surface topography and ice dynamics affect supraglacial drainage patterns. CitationYang et al. (Citation2019a) mapped a snapshot of supraglacial rivers on the western and southern DIC, demonstrating the strong potential of 10 m Sentinel-2 imagery to investigate supraglacial drainage patterns. However, the spatial distribution, drainage patterns and seasonal evolution of supraglacial rivers across the entire DIC and how their formation is affected by surface runoff remain poorly understood.
Here, we build upon the preliminary study of CitationYang et al. (Citation2019a) using Sentinel-2 satellite images to map supraglacial river networks and drainage across the entire DIC, their mid- to late-season evolution, and response to surface runoff. First, we extract the supraglacial rivers from satellite images by integrating cross-sectional and longitudinal open-channel morphometry. Then, we calculate the supraglacial drainage density within different elevation bands and drainage basins to investigate the evolution of supraglacial rivers across western, eastern and southern DIC. Finally, we compare the satellite-mapped supraglacial drainage density (Dd) with ice surface runoff modeled from Modèle Atmosphérique Régional (MAR), a regional climate model (RCM), which reveals how surface runoff affects the growth of the supraglacial rivers. We conclude by discussing the implications of the observed supraglacial drainage patterns and the relationship between satellite-mapped Dd and RCM-derived surface runoff estimates.
2. Study area
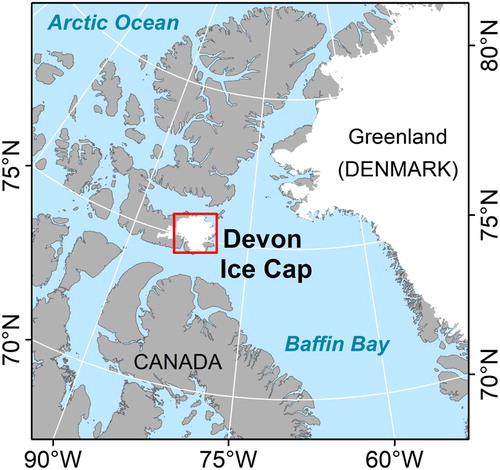
The DIC is located between 74.5°N and 75.8°N and 80.0°W and 86.0°W in the Canadian Arctic (). Its total area is 12,100 km2, with an estimated ice volume of 3,980 km3 and maximum ice thickness of 880 m (CitationDowdeswell et al., 2004). Climate warming has greatly impacted the DIC in recent decades. Increases in summertime temperature and lengthening melt seasons have intensified surface ablation and overall mass loss (CitationBoon et al., 2010; CitationBurgess et al., 2005; CitationBurgess & Sharp, 2004; Burgess & Sharp, Citation2008; CitationDe Jong et al., 2018; CitationGascon et al., 2013a; CitationShepherd et al., 2007). Both the total volume and area of the DIC are declining (∼−1.7 km3 a−1; ∼−8.3 km2 a−1, respectively) (CitationBoon et al., 2010; CitationBurgess & Sharp, 2004; CitationMortimer et al., 2016), and its annual mass loss was six times higher from 2005–2009 than from 1963–2005 (CitationSharp et al., 2011).
Figure 1. Location of the Devon Ice Cap in the Canadian Arctic.
The main ice cap has a dome-like shape with a maximum elevation of 1921m (CitationDowdeswell et al., 2004). Eight major drainage basins (471–2,623 km2), obtained from the Randolph Glacier Inventory 6.0 (CitationRGI Consortium, 2017), cover 78% of the total area of DIC () (). There are strong spatial gradients in mass balance, glacial geometry and ice flow across the ice cap (CitationBurgess & Sharp, 2004; CitationMair et al., 2005), causing different DIC drainage basins to exhibit distinct melt characteristics and hydrologic conditions (CitationBurgess & Sharp, 2004).
Figure 2. Sentinel-2 images (acquired on 28 July 2016, RGB: bands 4 (Red), 3 (Green), 2 (Blue)) of the entire Devon Ice Cap (excluding the southwest arm). (a–f) show typical areas in different DIC basins (red rectangles in center panel (g)). Black lines mark the boundaries of the major drainage basins (numbered as in ).
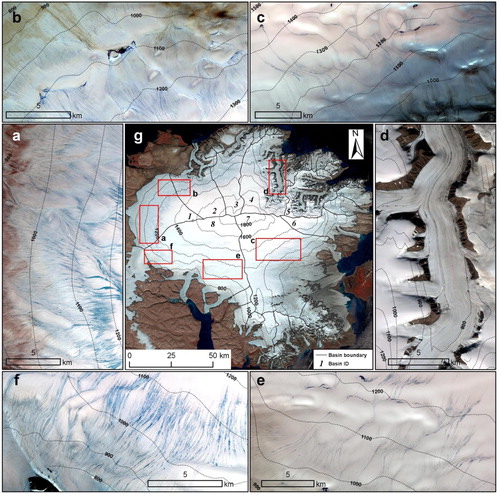
Because of the lack of cloud-free image coverage, we only investigated the mid- to late-season evolution of supraglacial rivers on the western, southern and eastern DIC. Only the low-elevation area (below 800 m) on the eastern DIC (covering 5% of eastern DIC and 2% of these three areas) contains crevasses observed by the Sentinel-2 imagery used herein.
3. Data and methods
3.1. Sentinel-2 Multi-Spectral Instrument images
Landsat images have been used for extracting supraglacial rivers on both the Greenland and Antarctic ice sheets (CitationBell et al., 2017; CitationKingslake et al., 2017; CitationLampkin & Vanderberg, 2014; CitationPoinar et al., 2015; Yang & Smith, Citation2016). However, because supraglacial rivers are normally less than 30 m wide (the spatial resolution of multi-spectral Landsat images) these data can delineate large main stems but miss narrow tributaries. To extract more representative supraglacial river networks, higher spatial resolution images are required (CitationColgan et al., 2011; CitationKarlstrom & Yang, 2016; CitationSmith et al., 2015; CitationSmith et al., 2017; CitationYang & Smith, 2013). Ultra high resolution images (meter-scale), such as GeoEye and WorldView-1/2/3/4, can allow accurate delineation of supraglacial rivers, but their high cost and limited spatial coverage reduce their usability in large-scale applications (CitationYang & Smith, 2013).
As demonstrated by CitationYang et al. (Citation2019a), the Sentinel-2A/B satellites (hereafter ‘Sentinel-2’) launched by the European Space Agency (ESA) in 2015 and 2017 provide an exciting new opportunity to map supraglacial rivers over large geographic areas with a spatial resolution intermediate between Landsat and WorldView. Sentinel-2 has four spectral bands (blue, green, red and near-infrared) at 10 m spatial resolution. This multi-spectral capability enables calculation of the normalized difference water index (NDWI), which can differentiate surface water bodies from surrounding glacial ice and snow. We use the Sentinel-2 Level-1C product, (orthorectified top-of-atmosphere reflectance) with sub-pixel multispectral registration (CitationBaillarin et al., 2012), provided freely by ESA’s Scientific Data Hub (https://scihub.copernicus.eu/dhus/#/home).
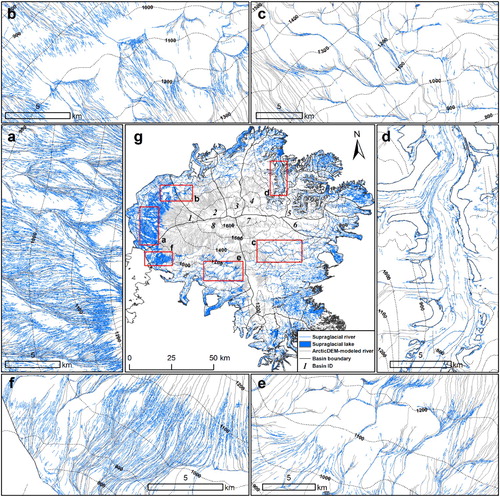
Nine Sentinel-2 images were acquired to extract supraglacial rivers across the DIC from late July through early August, the mid- to late- melt season for Arctic ice masses in this area. These images include six from 28 July 2016 (), two from 10 August 2016, and one from 11 August 2016 (). Elevation contours were generated from the 30 Arc-Second Elevation (GTOPO30) digital elevation model, provided by the USGS EarthExplorer (https://earthexplorer.usgs.gov/). The 2 m ArcticDEM, obtained from Polar Geospatial Center (https://www.pgc.umn.edu/data/arcticdem/), was used to simulate supraglacial drainage patterns and compare with Sentinel-2 mapped supraglacial rivers by using the ArcGIS hydrologic analysis tools.
Table 1. Images used in this study.
Table 2. Supraglacial hydrological features of the major drainage basins across the DIC on 28 July 2016.
3.2. Supraglacial river extraction
The complex physical and spectral characteristics of bare ice make automated extraction of supraglacial rivers from multi-spectral satellite images challenging (CitationYang & Smith, 2013). Here, we used the method of CitationYang et al. (Citation2015b) to extract rivers on the basis of their Gaussian-like brightness cross-section and longitudinal open-channel morphometry as follows: First, water features were enhanced by applying NDWI (CitationMcfeeters, 1996), which differentiates meltwater from the background ice or snow (b). Second, low-frequency image background and high-frequency image noise were removed using a band-pass filter ramped between 1/200 m−1 and 1/40 m−1 (c). Then, a Gabor filter was applied and the thickness of the Gabor filter was set to 2 to enhance small rivers (river widths smaller than two pixels) (CitationYang et al., 2015b). The Gabor filter can enhance linear features in different directions and at different scales, which effectively amplifies the river cross-sections (d). To improve river connectivity (e) by accounting for brightness variations along the river courses and issues with disconnected river segments, a path opening operator was then applied (CitationHeijmans et al., 2005). Path opening is a flexible mathematical morphology operator, which homogenizes the brightness of pixels along linear features in the image by designing a slender, directional path operator with a fixed distance (Lmin = 20 pixels) (e).
Figure 3. Supraglacial river extraction in Sentinel-2 image acquired on 28 July 2016, following the method of (CitationYang et al., 2015b). (a) Original Sentinel-2 true color image, (b) NDWI image, (c) NDWI image after band-pass filtering, (d) image after Gabor filtering, (e) image after path opening and (f) final supraglacial river extraction results and manual digitization of the same image.
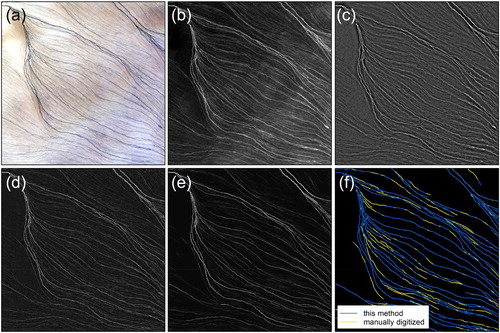
After Gabor filtering and path opening, the supraglacial rivers become far easier to differentiate from the surrounding ice background. Using a global threshold (T = 5) based on the pixel brightness histogram of the grayscale image, supraglacial rivers are effectively discerned and used to create a binary water mask (CitationYang et al., 2015b). Finally, ArcScan for ArcGIS was used to generate river vectors from this binary water mask (f). To quantify the ability of the automated mapping technique to capture supraglacial rivers, we also manually digitized the supraglacial rivers shown in a. The overall spatial pattern was very similar, but the sum length of the automated extraction results is 13.6% shorter than the manual digitization results, due to several gaps in automatically-mapped tributary rivers.
At high elevations, surface meltwater initially percolates into snowpack pore spaces and then forms slush flows when saturation is reached (CitationIrvine-Fynn et al., 2011; CitationPitcher & Smith, 2019). These slush flows can transform into open meltwater channels once the bare ice surface is exposed (CitationChu, 2014; CitationCuffey & Paterson, 2010; CitationPitcher & Smith, 2019). It is challenging to distinguish slush flows from well-channelized supraglacial rivers in satellite imagery since they are both represented as bright, linear features in NDWI images. Therefore, in this study, we consider these slush flows as initial supraglacial rivers and do not distinguish between slush flows and open meltwater channels.
While we acknowledge that our optical satellite-based study may be missing some key physical processes (e.g. firn stratigraphy) not visible from space, our study does offer an efficient method for mapping temporal and spatial variations in supraglacial river networks from space.
3.3. RCM-derived surface runoff
The Modèle Atmosphérique Régional (MAR) is among the best RCM over the Greenland Ice Sheet (CitationFettweis et al., 2017; CitationFettweis et al., 2020). MAR was used to model surface runoff across the DIC by simulating temperature, precipitation, and refreezing variables in 7.5 × 7.5 km grid cells. MAR version 3.8 was used in this study and forced at the lateral boundaries by 6-hourly ERA-Interim reanalysis outputs (CitationDelhasse et al., 2018). MAR integrates a runoff delay function to represent the time lag between surface meltwater production and transportation to nearby supraglacial rivers (CitationLefebre et al., 2003; CitationZuo & Oerlemans, 1996). However, the MAR delay function temporally-smooths the MAR runoff signal resulting in less realistic results than the runoff calculated directly from the raw model data (Runoff = Melt + Rain - Refreezing) (CitationYang et al., 2019b). The uncertainty is about 30% of runoff value (CitationFettweis et al., 2017). In this study, we therefore calculated ice surface (runoff) directly from MAR on 28 July 2016 and 10/11 August 2016, to yield the total amount of daily runoff generated within each grid cell (mm day−1) based on surface mass balance variables alone with no routing delay imposed. MAR grid cells were intersected with different vector polygon boundaries (elevation bands, drainage basins) and the total runoff computed by summing the intersected runoff values.
Drainage density (Dd) was calculated by dividing the total river length by the area of the corresponding basin/elevation band (CitationYang et al., 2016). In section 4.3, we compare satellite-mapped Dd with RCM-derived surface runoff above 600 m, because the areas of elevation bands near the ice cap margin (below 600 m) are small and supraglacial Dd below 600 m is influenced by multiple factors (e.g. crevasses and dust zone) rather than only surface runoff (CitationLea & Brough, 2019).
4. Results
4.1. Mapping of supraglacial rivers across the Devon Ice Cap
Supraglacial rivers were successfully mapped across the entire DIC using nine Sentinel-2 L1C images acquired on 28 July 2016 (Main Map, ). Diverse supraglacial drainage patterns and densities were found in different DIC basins. In total, 5.5% of the DIC was covered by supraglacial rivers and only 0.1% of the DIC was covered by supraglacial lakes at this time. The total mapped river length was 4.5×10⁴ km and the average Dd was 3.71 km−1. The highest elevation at which supraglacial rivers were mapped was ∼1500 m.
Figure 4. Supraglacial river networks across the entire Devon Ice Cap mapped from 2 m ArcticDEM and six 10 m Sentinel-2 images (acquired on 28 July 2016), for everywhere except the bottom right (southeastern DIC) due to the lack of Sentinel-2 images coverage. (a–f) show examples of supraglacial river networks in different DIC basins (red rectangles in center panel (g)).
The flat western basin of the DIC (Basin 1) was found to have the highest Dd (5.71 km−1), with well-developed supraglacial river networks (a). At elevations between 1100 and 1300 m, meltwater is not clearly channelized and represents braided and broadly dendritic supraglacial rivers. As the meltwater flows to lower elevations, the supraglacial rivers become entrenched and comprise of many small rivers parallel to each other (a). At elevations below 1000 m, supraglacial drainage becomes organized into fewer large rivers and Dd decreases (g, Figure S1).
On the northwest DIC (Basin 2), with the lowest Dd (1.63 km−1), most supraglacial rivers converge into several large supraglacial rivers at the elevation between 1100 and 1400 m, then continue to flow down the ice surface to lower elevation (rather than terminate in supraglacial lakes or moulins) (b). Meanwhile, some small sub-parallel rivers, which initiate at ∼1000 m, are distributed from ∼1000 m to ∼600 m near the ice cap margin (b, g).
On the northeastern DIC (Basin 3–6), Dd values range from 2.06–3.06 km−1. Supraglacial rivers initiate at ∼1400 m and form dendritic drainage patterns on the main cap, transforming into subparallel arrangements on outlet glaciers at lower elevations, with meltwater routed parallel to the outlet glacier trunk (d).
Basins 7 and 8, on the southern DIC, are the two largest drainage basins (2,171 km2 and 2,623 km2, respectively), and exhibit relatively low Dd (1.94 and 2.19 km−1, respectively). Most supraglacial rivers are dendritic (c, e), apart from the western portion of Basin 8, where supraglacial rivers are sub-parallel and have low sinuosity (f). Two small supraglacial lakes (area 0.03 and 0.08 km2) were located at ∼1400 m and ∼1250 m in Basin 7 (c) and one supraglacial lake (area 0.06 km2) was located at ∼1200 m in Basin 8 (e). Supraglacial rivers at the highest elevation were located in Basin 8 at 1500 m, matching previous observations from the 2015 melt season (CitationFernandes et al., 2018).
Comparing satellite-mapped supraglacial rivers with ArcticDEM-modeled supraglacial rivers, we find that the satellite-mapped supraglacial drainage patterns are similar to ArcticDEM-modeled drainage patterns, which implies that the supraglacial drainage patterns are strongly controlled by surface topography (). However, ArcticDEM-modeled drainage networks do not reflect the true distribution of supraglacial rivers. Instead, they tend to overestimate high-elevation rivers (which may be channelized but dry at the time of image capture) and underestimate low-elevation rivers (due to the choice of the accumulation area threshold) ().
4.2. Mid- to late-season evolution of supraglacial rivers
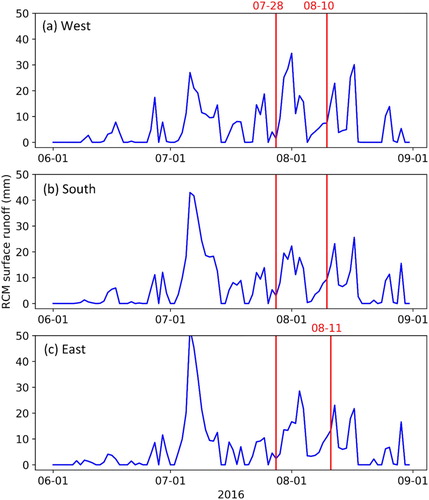
Mid- to late-season evolution of supraglacial rivers on the western, eastern, and southern DIC (parts of Basins 1, 7 and 8) was analyzed by comparing the supraglacial drainage densities on 28 July and 10/11 August 2016. Between these dates, Dd of these three areas increased: western DIC increasing from 4.92 km−1–5.99 km−1; southern DIC from 0.98 km−1–3.18 km−1; and eastern DIC from 0.80 km−1–9.59 km−1 (). As melting continued, Dd varied markedly with elevation and supraglacial rivers gradually extended toward higher elevations. The snow line increased from ∼1200 m to ∼1500 m during 28 July and 10/11 August 2016 (), and the daily runoff was clearly higher on 10/11 August than that on 28 July at 1300–1400 m (), which coincided with the largest increase in supraglacial Dd occurred.
Figure 5. Supraglacial rivers evolution. (a–c) show the supraglacial river networks extraction results, and (d–f) are corresponding supraglacial drainage density in different elevation bands.
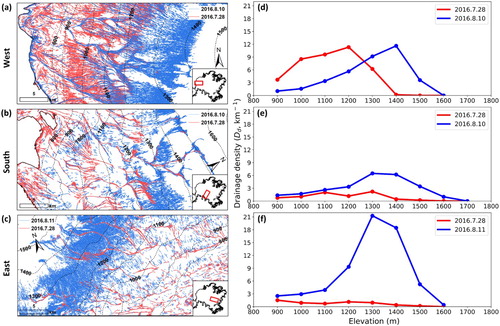
Figure 6. Snow cover on the western, southern and eastern DIC delineated by thresholding the Sentinel-2 NIR bands (CitationRyan et al., 2019). The red lines show the boundaries of the snow and bare ice on 28 July and 10/11 August 2016.
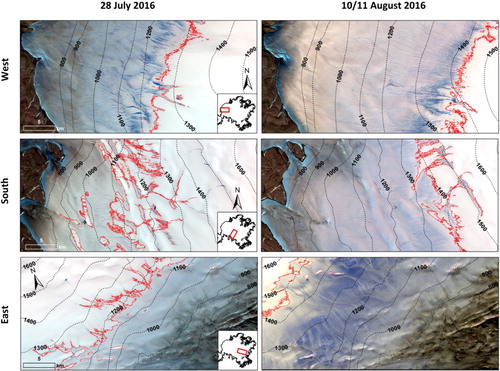
Figure 7. Daily RCM-derived surface runoff for 1300–1400 m elevation band of western, southern and eastern DIC during the 2016 melt season.
From 28 July to 10 August 2016, the total Dd of supraglacial rivers on the western DIC (a part of Basin 1) increased slightly from 4.92–5.99 km−1 and the snow covered fraction decreased from 0.39–0.14 (a, d, ). Supraglacial rivers expanded to higher elevations with the peak value of Dd moving from 1200 m to 1400 m (d). By the 10 August, snow-covered areas had become slush fields at 1200–1500 m (CitationPitcher & Smith, 2019), with many poor-channelized supraglacial rivers with low sinuosity forming (a, ), with a maximum Dd of 11.62 km−1 at this elevation band. At 1100–1200 m, the slush field transitioned into relatively impermeable bare ice surface from 28 July to 10 August (CitationIrvine-Fynn et al., 2011), the supraglacial rivers were better channelized and the Dd decreased from 11.32–5.66 km−1. Below 1100 m, the Dd decreased by more than 50% (from 8.23–2.27 km−1). Although the main rivers remained relatively stable across this period, many small supraglacial rivers had either dried up or became narrow, and thus could not be distinguished by Sentinel-2 images (a, d).
On the southern and eastern DIC, the evolution of supraglacial rivers differed from that on the western DIC. On the southern DIC (a part of Basin 8), Dd was generally lower, and peak Dd was located at 1300 m. As the snow surface diminished at 1100-1400 m between 28 July and 10 August, a large number of initial supraglacial rivers formed and the Dd increased by a factor of three (from 0.98–3.18 km−1) (b, e, ). This trend was also clearly observed on the eastern DIC (a part of Basin 7), where Dd on 11 August was 12 times higher than that on 28 July (from 1.14–21.29 km−1) (c, f) and the snow cover fraction decreased from 0.40–0.05 (). The location of the peak Dd extended from 1200 m to 1300 m (c, f). Overall, on the southern and eastern DIC, a large number of newly formed supraglacial rivers were observed at both high and low elevations in contrast to the decrease in Dd at low elevations (<1200 m) observed on the western DIC.
4.3. Comparing satellite-mapped Dd with RCM-derived surface runoff
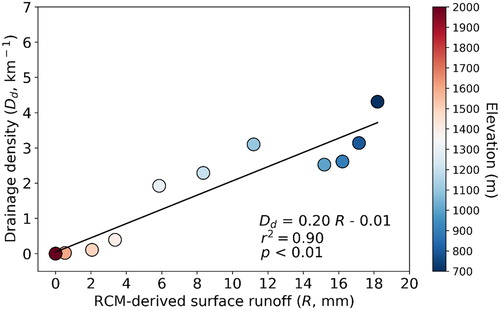
There is a significantly positive linear relationship between the RCM-derived surface runoff (R) and the satellite-mapped Dd, calculated at a range of elevations on 28 July 2016 (). Across the entire DIC, the relationship between R and Dd can be expressed by the linear function Dd = 0.20 R + 0.05 (r2 = 0.90, p < 0.01). In other words, Dd increases by 0.2 km−1 with each 1 mm increase in R. Both R and Dd gradually increase when moving from the high elevation interior (> 1700m) to lower elevation areas (∼700 m) near the margin of the DIC ().
Figure 8. Relationship between daily RCM-derived surface runoff (R) and satellite-mapped drainage density (Dd) on 28 July 2016. All R and Dd were calculated at each 100 m of elevation (from 700 m to 2000m).
Different drainage basins demonstrate variations in the relationship between R and Dd (). In Basins 2–8, significantly positive linear relationships (R2 > 0.68, p < 0.01) exist between R and Dd (b–h). With each 1 mm increase in R, the Dd increases by 0.13–0.37 km−1 in Basin 2–8. However, in Basin 1, where Dd is highest, no direct relationship is apparent between R and Dd (a), due to the significant decrease in Dd from ∼1000 m to the ice cap margin.
Figure 9. Relationship between daily RCM-derived surface runoff (R) and satellite-mapped drainage density (Dd) in eight major basins on 28 July 2016. All R and Dd were calculated at each 100 m of elevation (from 700 m to 2000m).
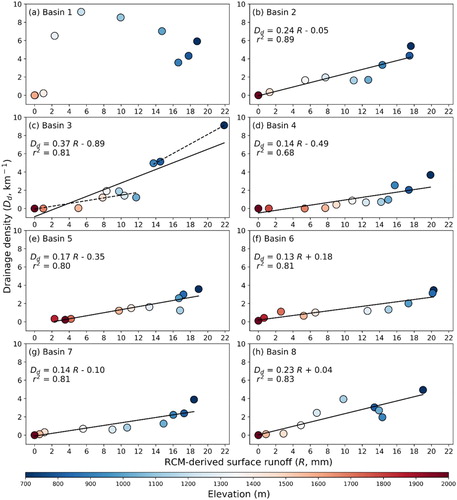
In Basin 3, as R increases, Dd at elevations above 900 m rise faster than at elevations below 900 m (0.52 km−1 mm−1 vs. 0.15 km−1 mm−1) (c). Compared to Basin 2 and Basins 4–8, each 1 mm increase in R of Basin 3 causes a greater increase in Dd (0.37 km−1 vs. 0.13–0.24 km−1) (c). In Basin 3, the area below 900 m comprises a topographically-constrained outlet glacier approximately 25 km in length, where surface water may be concentrated. Nearly all supraglacial rivers drain into this outlet glacier rather than terminating on land or in supraglacial lakes and moulins. This is in contrast to outlet glaciers in other basins, which only exist below 600 m (CitationBoon et al., 2010) and are therefore not included in the statistics (g).
5. Discussion
The overall DIC supraglacial drainage pattern is characterized by high density, dendritic and parallel drainage networks. On both the eastern and southern DIC, dendritic drainage patterns dominate, which is in agreement with patterns observed by previous studies (CitationDowdeswell et al., 2004; CitationFernandes et al., 2018; CitationWyatt, 2013; CitationWyatt & Sharp, 2015). However, only a few studies have focused on the western DIC (Basin 1) (CitationWyatt, 2013; CitationYang et al., 2019a), where we find parallel and dendritic drainage patterns and the highest Dd. Meanwhile, there are significant decreases in Dd at low elevations on western DIC (Basin 1). CitationIgnéczi et al. (Citation2018) suggested that river networks on western Greenland close to the ice margin become fragmented due to crevasses and moulins, and Dd would reduce, resulting in a corresponding reduction in Dd. However, due to the few crevasses that we observed on the western DIC, we attribute the low drainage density mainly to the difficulty in detecting supraglacial rivers in the low albedo zone (CitationYang et al., 2019a). During the melt season, supraglacial rivers extend toward higher elevations on the DIC as the surface runoff increases at high elevation, similar to the evolution of supraglacial rivers on the southwest Greenland Ice Sheet (CitationLampkin & Vanderberg, 2014).
We have compared supraglacial rivers delineated in this study with supraglacial rivers delineated in CitationWyatt (Citation2013). In general, our 10 m Sentinel-2 river map matches well. Notably, however, our Sentinel-2 map delineates numerous small supraglacial rivers that are not captured by Wyatt’s map and yields higher Dd (maximum: 12.5 km−1 vs. 8.7 km−1). This agrees with CitationYang et al. (Citation2019a) who show that Sentinel-2 images are superior to Landsat images for delineating small supraglacial rivers. In addition, the highest supraglacial Dd is found on the western DIC (Basin 1), but was reported on the eastern DIC by CitationWyatt (Citation2013). The highest-elevation of satellite-mapped supraglacial rivers is located at 1500 m in Basin 7, which is 80 m higher than that reported by CitationWyatt (Citation2013) during the 1999 summer. It is probably that with climate change, the occurrence of the further inland melting and the change of the underlying surface (ice/snow/firn) leads to the supraglacial rivers’ expansion (CitationBezeau et al., 2013; CitationFisher et al., 2012; CitationGascon et al., 2013b; CitationRutishauser et al., 2016; CitationSharp et al., 2011; CitationWolken et al., 2009).
We present a positive linear relationship between ice surface runoff and supraglacial Dd, which has not been quantified previously. The slope of the linear function between satellite-mapped Dd and RCM-derived surface runoff in Basin 3 is higher than in other basins, indicating that RCM may underestimate the surface runoff on outlet glaciers. Low-albedo exposed rocks that radiate longwave radiation may increase local melt rates (CitationKingslake et al., 2017). Further improving parameters of RCM is important for better illustrating the response of supraglacial rivers to surface runoff. Moreover, the positive linear relationship between surface runoff and supraglacial Dd indicate that supraglacial Dd is primarily controlled by surface runoff. We suggest that this finding is important for better quantifying surface runoff. More specifically, runoff is the most difficult variable to qualify in RCMs and is usually calculated as residuals of other climatic variables (CitationSmith et al., 2017); our study provides a potential approach to validate RCM-derived surface runoff using satellite-observed Dd.
6. Conclusion
This paper presents a first complete time-slice map of > 10 m wide supraglacial river networks across the entire Devon Ice Cap using high spatial resolution (10 m) Sentinel-2 L1C satellite images. On 28 July 2016, supraglacial drainage density on the DIC was 3.71 km−1, with both dendritic and parallel drainage patterns evident in different drainage basins of the ice cap, which will improve our understanding of the intensity and efficiency at which meltwater is being transported from the ice cap. The basin with the highest drainage density was located on the western DIC, where peak drainage density was found at elevations between 1200–1400 m. By August 10/11, a large number of new supraglacial rivers had formed at higher elevations, and the region of peak drainage density had moved toward higher elevations. At low elevations (< 1200 m), drainage density decreased on the western DIC but increased in both the southern and eastern DIC. Moreover, we found a positive relationship between satellite-mapped supraglacial drainage density and RCM-derived surface runoff. This indicates that the supraglacial drainage density is primarily controlled by ice surface runoff, which will improve our understanding of supraglacial hydrological processes and mass balance across the Arctic cryosphere. In the future, integrating remotely sensed observations, RCM outputs and high spatial resolution DEMs (e.g. 2 m ArcticDEM) more closely will enable a better understanding of the supraglacial drainage patterns and their response to ice surface runoff.
Software
ESRI ArcGIS 10.6.1 and Adobe Illustrator CC 2018 were used in the production of the main map.
Map_of_supraglacial_rivers_on_DIC.pdf
Download PDF (12.7 MB)Acknowledgements
Kang Yang acknowledges the support of the National Key R&D Program (2018YFC1406101), the National Natural Science Foundation of China (41871327), and the Fundamental Research Funds for the Central Universities. Laurence Smith acknowledges the NASA Cryospheric Science Program (80NSSC19K0942). Stephen Livingstone and Andrew Sole acknowledge the support of a White Rose University Consortium Collaboration Fund grant. We acknowledge Faye Wyatt for providing a supraglacial river map of the DIC delineated from Landsat 7 ETM+ imagery acquired during 1999 summer. We thank the Associate Editor and four reviewers (Martin Sharp, Caroline Clason, David Burgess and Daniele Cannatella) for their detailed and constructive comments.
Disclosure statement
No potential conflict of interest was reported by the author(s).
Additional information
Funding
Reference
- Abdalati, W., Krabill, W., Frederick, E., Manizade, S., Martin, C., Sonntag, J., Swift, R., Thomas, R., Yungel, J., & Koerner, R. (2004). Elevation changes of ice caps in the Canadian Arctic Archipelago. Journal of Geophysical Research: Earth Surface, 109(F4), F04007. https://doi.org/10.1029/2003JF000045
- Baillarin, S., Meygret, A., Dechoz, C., Petrucci, B., Lacherade, S., Trémas, T., Isola, C., Martimort, P., & Spoto, F.. (2012, July 22-27). Sentinel-2 level 1 products and image processing performances. 2012 IEEE International Geoscience and Remote Sensing Symposium, Munich, Germany.
- Bell, R. E., Chu, W., Kingslake, J., Das, I., Tedesco, M., Tinto, K. J., Zappa, C. J., Frezzotti, M., Boghosian, A., & Lee, W. S. (2017). Antarctic ice shelf potentially stabilized by export of meltwater in surface river. Nature, 544(7650), 344–348. https://doi.org/10.1038/nature22048
- Bezeau, P., Sharp, M., Burgess, D., & Gascon, G. (2013). Firn profile changes in response to extreme 21st-century melting at Devon Ice Cap, Nunavut, Canada. Journal of Glaciology, 59(217), 981–991. https://doi.org/10.3189/2013JoG12J208
- Boon, S., Burgess, D. O., Koerner, R. M., & Sharp, M. J. (2010). Forty-seven years of research on the Devon Island ice cap, Arctic Canada. Arctic, 63(1), 13–29. https://doi.org/10.14430/arctic643
- Box, J. E., Colgan, W. T., Wouters, B., Burgess, D. O., O’neel, S., Thomson, L. I., & Mernild, S. H. (2018). Global sea-level contribution from Arctic land ice: 1971–2017. Environmental Research Letters, 13(12), 125012. https://doi.org/10.1088/1748-9326/aaf2ed
- Burgess, D. O., & Sharp, M. J. (2004). Recent changes in areal extent of the Devon ice cap, Nunavut, Canada. Arctic, Antarctic, and Alpine Research, 36(2), 261–271. https://doi.org/10.1657/1523-0430(2004)036[0261:RCIAEO]2.0.CO;2
- Burgess, D. O., & Sharp, M. J. (2008). Recent changes in thickness of the Devon Island ice cap. Canada. Journal of Geophysical Research: Solid Earth, 113(B7), B07204. https://doi.org/10.1029/2007JB005238
- Burgess, D. O., Sharp, M. J., Mair, D. W., Dowdeswell, J. A., & Benham, T. J. (2005). Flow dynamics and iceberg calving rates of Devon Ice Cap, Nunavut, Canada. Journal of Glaciology, 51(173), 219–230. https://doi.org/10.3189/172756505781829430
- Chu, V. W. (2014). Greenland ice sheet hydrology: A review. Progress in Physical Geography, 38(1), 19–54. https://doi.org/10.1177/0309133313507075
- Colgan, W., Steffen, K., Mclamb, W. S., Abdalati, W., Rajaram, H., Motyka, R., Phillips, T., & Anderson, R. (2011). An increase in crevasse extent, West Greenland: Hydrologic implications. Geophysical Research Letters, 38(18), L18502. https://doi.org/10.1029/2011GL048491
- Cook, A. J., Copland, L., Noël, B. P. Y., Stokes, C. R., Bentley, M. J., Sharp, M. J., Bingham, R. G., & Van Den Broeke, M. R. (2019). Atmospheric forcing of rapid marine-terminating glacier retreat in the Canadian Arctic Archipelago. Science Advances, 5(3), eaau8507. https://doi.org/10.1126/sciadv.aau8507
- Crozier, J., Karlstrom, L., & Yang, K. (2018). Basal control of supraglacial meltwater catchments on the Greenland Ice Sheet. The Cryosphere, 12(10), 3383–3407. https://doi.org/10.5194/tc-12-3383-2018
- Cuffey, K. M., & Paterson, W. S. B. (2010). The physics of glaciers. Academic Press.
- De Jong, T., Copland, L., & Burgess, D. (2018). Changes in glacier facies zonation on Devon Ice Cap, Nunavut, detected from SAR imagery and field observations. The Cryosphere Discuss, 2018, 1–28. https://doi.org/10.5194/tc-2018-250
- Delhasse, A., Fettweis, X., Kittel, C., Amory, C., & Agosta, C. (2018). Brief communication: Impact of the recent atmospheric circulation change in summer on the future surface mass balance of the Greenland Ice Sheet. The Cryosphere, 12(11), 3409–3418. https://doi.org/10.5194/tc-12-3409-2018
- Dowdeswell, J., Benham, T., Gorman, M., Burgess, D., & Sharp, M. (2004). Form and flow of the Devon Island ice cap, Canadian Arctic. Journal of Geophysical Research: Earth Surface, 109(F2), F02002. https://doi.org/10.1029/2003JF000095
- Fernandes, L., Schmitt, A., Wendleder, A., Sharp, M., & Roth, A.. (2018, June 4-7). Detecting Supraglacial Meltwater Drainage on the Devon Ice Cap using Kennaugh Decomposition of TerraSAR-X imagery. EUSAR 2018 - 12th European Conference on Synthetic Aperture Radar, Aachen, Germany.
- Fettweis, X., Box, J. E., Agosta, C., Amory, C., Kittel, C., Lang, C., Van As, D., Machguth, H., & Gallée, H. (2017). Reconstructions of the 1900–2015 Greenland ice sheet surface mass balance using the regional climate MAR model. The Cryosphere, 11(2), 1015–1033. https://doi.org/10.5194/tc-11-1015-2017
- Fettweis, X., Hofer, S., Krebs-Kanzow, U., Amory, C., Aoki, T., Berends, C. J., Born, A., Box, J. E., Delhasse, A., Fujita, K., Gierz, P., Goelzer, H., Hanna, E., Hashimoto, A., Huybrechts, P., Kapsch, M. L., King, M. D., Kittel, C., Lang, C., … Zolles, T. (2020). GrSMBMIP: Intercomparison of the modelled 1980-2012 surface mass balance over the Greenland Ice sheet. The Cryosphere Discuss., 2020, 1–35. https://doi.org/10.5194/tc-2019-321
- Fisher, D., Zheng, J., Burgess, D., Zdanowicz, C., Kinnard, C., Sharp, M., Bourgeois, J., & Bourgeois, M. (2012). Recent melt rates of Canadian Arctic ice caps are the highest in four millennia. Global and Planetary Change, 84-85, 3–7. https://doi.org/10.1016/j.gloplacha.2011.06.005
- Gardner, A. S., Moholdt, G., Wouters, B., Wolken, G. J., Burgess, D. O., Sharp, M. J., Cogley, J. G., Braun, C., & Labine, C. (2011). Sharply increased mass loss from glaciers and ice caps in the Canadian Arctic Archipelago. Nature, 473(7347), 357–360. https://doi.org/10.1038/nature10089
- Gascon, G., Sharp, M., Burgess, D., Bezeau, P., & Bush, A. B. G. (2013b). Changes in accumulation-area firn stratigraphy and meltwater flow during a period of climate warming: Devon Ice Cap, Nunavut, Canada. Journal of Geophysical Research: Earth Surface, 118(4), 2380–2391. https://doi.org/10.1002/2013JF002838
- Gascon, G., Sharp, M., & Bush, A. (2013a). Changes in melt season characteristics on Devon Ice Cap, Canada, and their association with the Arctic atmospheric circulation. Annals of Glaciology, 54(63), 101–110. https://doi.org/10.3189/2013AoG63A601
- Gleason, C. J., Smith, L. C., Chu, V. W., Legleiter, C. J., Pitcher, L. H., Overstreet, B. T., Rennermalm, A. K., Forster, R. R., & Yang, K. (2016). Characterizing supraglacial meltwater channel hydraulics on the Greenland Ice Sheet from in situ observations. Earth Surface Processes and Landforms, 41(14), 2111–2122. https://doi.org/10.1002/esp.3977
- Heijmans, H., Buckley, M., & Talbot, H. (2005). Path Openings and Closings. Journal of Mathematical Imaging and Vision, 22(2), 107–119. https://doi.org/10.1007/s10851-005-4885-3
- Ignéczi, Á, Sole, A., Livingstone, S., Ng, F., & Yang, K. (2018). Greenland Ice Sheet surface topography and drainage structure controlled by the transfer of basal variability. Frontiers in Earth Science, 6, https://doi.org/10.3389/feart.2018.00101
- Iken, A., & Bindschadler, R. A. (1986). Combined measurements of subglacial water pressure and surface velocity of Findelengletscher, Switzerland: Conclusions about drainage system and sliding mechanism. Journal of Glaciology, 32(110), 101–119. https://doi.org/10.1017/S0022143000006936
- Irvine-Fynn, T. D. L., Hodson, A. J., Moorman, B. J., Vatne, G., & Hubbard, A. L. (2011). Polythermal glacier hydrology: A review. Reviews of Geophysics, 49(4), RG4002. https://doi.org/10.1029/2010RG000350
- Karlstrom, L., & Yang, K. (2016). Fluvial supraglacial landscape evolution on the Greenland Ice Sheet. Geophysical Research Letters, 43(6), 2683–2692. https://doi.org/10.1002/2016GL067697
- King, L., Hassan, M. A., Yang, K., & Flowers, G. (2016). Flow routing for delineating supraglacial meltwater channel networks. Remote Sensing, 8(12), 988. https://doi.org/10.3390/rs8120988
- Kingslake, J., Ely, J. C., Das, I., & Bell, R. E. (2017). Widespread movement of meltwater onto and across Antarctic ice shelves. Nature, 544(7650), 349–352. https://doi.org/10.1038/nature22049
- Lampkin, D., & Vanderberg, J. (2014). Supraglacial melt channel networks in the Jakobshavn Isbræ region during the 2007 melt season. Hydrological Processes, 28(25), 6038–6053. https://doi.org/10.1002/hyp.10085
- Lea, J., & Brough, S.. (2019, December 9-13). Supraglacial lake mapping of the entire Greenland Ice Sheet using Google Earth Engine. AGU Fall Meeting 2019, San Francisco, USA.
- Lefebre, F., Gallée, H., Van Ypersele, J.-P., & Greuell, W. (2003). Modeling of snow and ice melt at ETH Camp (West Greenland): A study of surface albedo. Journal of Geophysical Research: Atmospheres, 108(D8), 4231. https://doi.org/10.1029/2001JD001160
- Legleiter, C. J., Tedesco, M., Smith, L. C., Behar, A. E., & Overstreet, B. T. (2014). Mapping the bathymetry of supraglacial lakes and streams on the Greenland ice sheet using field measurements and high-resolution satellite images. The Cryosphere, 8(1), 215–228. https://doi.org/10.5194/tc-8-215-2014
- Mair, D., Burgess, D., & Sharp, M. (2005). Thirty-seven year mass balance of Devon Ice Cap, Nunavut, Canada, determined by shallow ice coring and melt modeling. Journal of Geophysical Research: Earth Surface, 110(F1), F01011. https://doi.org/10.1029/2003JF000099
- Mcfeeters, S. K. (1996). The use of the normalized difference water index (NDWI) in the delineation of open water features. International Journal of Remote Sensing, 17(7), 1425–1432. https://doi.org/10.1080/01431169608948714
- Mortimer, C. A., Sharp, M., & Wouters, B. (2016). Glacier surface temperatures in the Canadian high Arctic, 2000–15. Journal of Glaciology, 62(235), 963–975. https://doi.org/10.1017/jog.2016.80
- Noël, B., Van De Berg, W. J., Lhermitte, S., Wouters, B., Schaffer, N., & Van Den Broeke, M. R. (2018). Six decades of glacial mass loss in the Canadian Arctic Archipelago. Journal of Geophysical Research: Earth Surface, 123(6), 1430–1449. https://doi.org/10.1029/2017JF004304
- Pitcher, L. H., & Smith, L. C. (2019). Supraglacial streams and rivers. Annual Review of Earth and Planetary Sciences, 47(1), 421–452. https://doi.org/10.1146/annurev-earth-053018-060212
- Poinar, K., Joughin, I., Das, S. B., Behn, M. D., Lenaerts, J., & Broeke, M. R. (2015). Limits to future expansion of surface-melt-enhanced ice flow into the interior of western Greenland. Geophysical Research Letters, 42(6), 1800–1807. https://doi.org/10.1002/2015GL063192
- RGI Consortium, R. (2017). Randolph Glacier Inventory–A Dataset of Global Glacier Outlines: Version 6.0: Technical Report, Global Land Ice Measurements from Space, Colorado, USA. Digital Media.
- Richter-Menge, J., Osborne, E., & Jeffries, M. (2016). Arctic Report Card 2016.
- Röthlisberger, H., & Iken, A. (1981). Plucking as an effect of water-Pressure variations at the glacier bed. Annals of Glaciology, 2, 57–62. https://doi.org/10.3189/172756481794352144
- Rutishauser, A., Grima, C., Sharp, M., Blankenship, D. D., Young, D. A., Cawkwell, F., & Dowdeswell, J. A. (2016). Characterizing near-surface firn using the scattered signal component of the glacier surface return from airborne radio-echo sounding. Geophysical Research Letters, 43(24), 12502–512510. https://doi.org/10.1002/2016GL071230
- Ryan, J. C., Smith, L. C., Van As, D., Cooley, S. W., Cooper, M. G., Pitcher, L. H., & Hubbard, A. (2019). Greenland Ice Sheet surface melt amplified by snowline migration and bare ice exposure. Science Advances, 5 (3), eaav3738. https://doi.org/10.1126/sciadv.aav3738
- Schoof, C. (2010). Ice-sheet acceleration driven by melt supply variability. Nature, 468(7325), 803–806. https://doi.org/10.1038/nature09618
- Screen, J. A., & Simmonds, I. (2010). The central role of diminishing sea ice in recent Arctic temperature amplification. Nature, 464(7293), 1334–1337. https://doi.org/10.1038/nature09051
- Sharp, M., Burgess, D. O., Cogley, J. G., Ecclestone, M., Labine, C., & Wolken, G. J. (2011). Extreme melt on Canada's Arctic ice caps in the 21st century. Geophysical Research Letters, 38(11), L11501. https://doi.org/10.1029/2011GL047381
- Shepherd, A., Du, Z., Benham, T. J., Dowdeswell, J. A., & Morris, E. M. (2007). Mass balance of Devon Ice Cap, Canadian Arctic. Annals of Glaciology, 46, 249–254. https://doi.org/10.3189/172756407782871279
- Smith, L. C., Chu, V. W., Yang, K., Gleason, C. J., Pitcher, L. H., Rennermalm, A. K., Legleiter, C. J., Behar, A. E., Overstreet, B. T., & Moustafa, S. E. (2015). Efficient meltwater drainage through supraglacial streams and rivers on the southwest Greenland ice sheet. Proceedings of the National Academy of Sciences, 112(4), 1001–1006. https://doi.org/10.1073/pnas.1413024112
- Smith, L. C., Yang, K., Pitcher, L. H., Overstreet, B. T., Chu, V. W., Rennermalm, ÅK, Ryan, J. C., Cooper, M. G., Gleason, C. J., & Tedesco, M. (2017). Direct measurements of meltwater runoff on the Greenland ice sheet surface. Proceedings of the National Academy of Sciences, 114(50), E10622–E10631. https://doi.org/10.1073/pnas.1707743114
- Sundal, A. V., Shepherd, A., Nienow, P., Hanna, E., Palmer, S., & Huybrechts, P. (2011). Melt-induced speed-up of Greenland ice sheet offset by efficient subglacial drainage. Nature, 469(7331), 521–524. https://doi.org/10.1038/nature09740
- Wolken, G. J., Sharp, M., & Wang, L. (2009). Snow and ice facies variability and ice layer formation on Canadian Arctic ice caps, 1999–2005. Journal of Geophysical Research: Earth Surface, 114(F3), F03011. https://doi.org/10.1029/2008JF001173
- Wyatt, F. R. (2013). The spatial structure and temporal development of supraglacial drainage systems, and their influence on the flow dynamics of high Arctic ice caps. University of Alberta (Canada).
- Wyatt, F. R., & Sharp, M. J. (2015). Linking surface hydrology to flow regimes and patterns of velocity variability on Devon Ice Cap, Nunavut. Journal of Glaciology, 61(226), 387–399. https://doi.org/10.3189/2015JoG14J109
- Yang, K., Li, M., Liu, Y., Cheng, L., Huang, Q., & Chen, Y. (2015b). River detection in remotely sensed imagery using Gabor filtering and path opening. Remote Sensing, 7(7), 8779–8802. https://doi.org/10.3390/rs70708779
- Yang, K., & Smith, L. C. (2013). Supraglacial streams on the Greenland Ice Sheet delineated from combined spectral-shape information in high-resolution satellite imagery. IEEE Geoscience and Remote Sensing Letters, 10(4), 801–805. https://doi.org/10.1109/LGRS.2012.2224316
- Yang, K., & Smith, L. C. (2016). Internally drained catchments dominate supraglacial hydrology of the southwest Greenland Ice Sheet. Journal of Geophysical Research: Earth Surface, 121(10), 1891–1910. https://doi.org/10.1002/2016JF003927
- Yang, K., Smith, L. C., Chu, V. W., Gleason, C. J., & Li, M. (2015a). A caution on the use of surface digital elevation models to simulate supraglacial hydrology of the greenland ice sheet. IEEE Journal of Selected Topics in Applied Earth Observations and Remote Sensing, 8(11), 5212–5224. https://doi.org/10.1109/JSTARS.2015.2483483
- Yang, K., Smith, L. C., Chu, V. W., Pitcher, L. H., Gleason, C. J., Rennermalm, A. K., & Li, M. (2016). Fluvial morphometry of supraglacial river networks on the southwest Greenland Ice Sheet. GIScience & Remote Sensing, 53(4), 459–482. https://doi.org/10.1080/15481603.2016.1162345
- Yang, K., Smith, L. C., Fettweis, X., Gleason, C. J., Lu, Y., & Li, M. (2019b). Surface meltwater runoff on the Greenland ice sheet estimated from remotely sensed supraglacial lake infilling rate. Remote Sensing of Environment, 234, 111459. https://doi.org/10.1016/j.rse.2019.111459
- Yang, K., Smith, L. C., Sole, A., Livingstone, S. J., Cheng, X., Chen, Z., & Li, M. (2019a). Supraglacial rivers on the northwest Greenland Ice Sheet, Devon Ice Cap, and Barnes Ice Cap mapped using Sentinel-2 imagery. International Journal of Applied Earth Observation Geoinformation, 78, 1–13. https://doi.org/10.1016/j.jag.2019.01.008
- Zuo, Z., & Oerlemans, J. (1996). Modelling albedo and specific balance of the Greenland ice sheet: Calculations for the søndre Strømfjord transect. Journal of Glaciology, 42(141), 305–317. https://doi.org/10.1017/S0022143000004160