
 ?Mathematical formulae have been encoded as MathML and are displayed in this HTML version using MathJax in order to improve their display. Uncheck the box to turn MathJax off. This feature requires Javascript. Click on a formula to zoom.
ABSTRACT
Rockfalls are a major hazard in mountain areas. They can endanger human settlements and infrastructures, and, every year, cause multiple damage and victims. An investigation of those areas more susceptible to rockfall represents a key approach to improve the analysis and management of rockfall impact and consequences. The proposed procedure involves the study of occurred rockfall databases and thematic maps to compute a susceptibility map, by the employment of Analytical Hierarchic Process. The computation is focused on the road network of Aosta Valley Region (northwestern Italy) and its proximity. The model results highlight the importance of morphometric factors on the investigated phenomena. The outcomes of the analysis were also validated by comparing rockfall databases with the receiver operating characteristic curve, in order to confirm their reliability. The results of the procedure are a starting point for a detailed planning action in order to manage the hazard related to these phenomena.
1. Introduction
In mountain territories, rockfall events are extremely common along the road networks, often causing casualties, damage to vehicles or to the roads (e.g. pavements, retaining walls), with consequent economic losses (Budetta, Citation2004; Guzzetti, Citation2000; Guzzetti et al., Citation2004; Palma et al., Citation2012). Rockfalls are unpredictable phenomena usually involving small volumes, the areas involved are very small and often punctual, with high energy and long runout distances (Frattini et al., Citation2012). The relating hazard characterization and forecast is still a challenge, depending on various factors for any single investigated area (Mineo, Citation2020; Mineo & Pappalardo, Citation2019). Great importance is given to the characterization of the rockfall spatial distribution, their frequency and intensity, which are often assessed by landslide inventories (Hungr et al., Citation1999; Volkwein et al., Citation2011).
The Alpine region is widely anthropized and characterized by diffuse environmental and cultural heritage and represents a territory highly susceptible to the rockfall occurrence. Therefore, the rockfall hazard assessment becomes essential in the Alpine areas, with the aim to implement countermeasures and to adopt an adequate land use planning.
Rockfall hazard has been defined by Jaboyedoff et al. (Citation2001) as the probability that a specific location is reached by a rockfall of given intensity. The definition of magnitude–frequency relationship can be obtained by estimating the annual frequency of rockfall events in specified volume classes (Hungr et al., Citation1999). Some limitations can occur because of the information availability for a specific area of interest, specifically in term of spatial and temporal heterogeneity. Without an accurate assessment of the annual frequency of the rockfall events of a given magnitude, the hazard computation is not possible. In these cases, the risk assessment should meaningfully be supported by the susceptibility computation. By this way, it is possible to provide a general overview of areas more affected by potentially collapses, based on specific environmental characteristics. This process plays a fundamental role for obtaining an overview of the potentially endangered areas, before proceeding to the risk assessment (Jaboyedoff et al., Citation2012).
Focusing on the Aosta Valley Region (AVR), a small alpine region in the northwestern Italy, widely affected by many different slope instabilities like Deep-seated Gravitational Slope Deformation (Cignetti et al., Citation2020; Martinotti et al., Citation2011), large rockslides (Crosta et al., Citation2015; Giardino et al., Citation2004), and rockfalls (Trigila et al., Citation2008), this study aims to assess the rockfall susceptibility across the regional road network, highly threated by this type of slope instability. This small mountainous Region (about 3200 km2) shows a dense road network that branches off along the main valley and the secondary ones. By applying a semi-quantitative index-based method, capable to organize and analyse multi-criteria decision, i.e. Analytic Hierarchy Process (AHP) (CitationSaaty, 1980) we drafted a prompt and rapid approach to define the areas more susceptible to rockfalls at regional scale. Starting from the available landslide inventories and catalogues (Centro Funzionale Regione Autonoma Valle d’Aosta, Citation2019; ISPRA Ambiente, Citation2007), we defined the main variables to consider in the susceptibility computation process. Finally, the obtained susceptibility map was validated by the receiver operating characteristic curve or ROC curve.
The definition of the more susceptible areas should represent a useful tool for the regional authorities and municipalities, and represents an initial step for subsequent in-depth analysis, in order to define effective risk and emergency management strategies. For instance, the aforementioned map will constitute one of the layers employed in the ARTEMIS (Advanced Regional Terrain Motion InSAR Screening system) procedure, an automated method elaborated by the Aosta Valley Regional Geological Survey. Concerning slope instabilities affecting this mountainous region (ISPRA Ambiente, Citation2007), this procedure will be used to identify the sites to be primarily investigated, by leveraging on a GIS-based filtering process for the operative field management of the Permanent Scatterers (PS) monitoring anomalies regime.
2. Material and methods
The developed methodology is structured into two main phases: (i) definition of the current knowledge framework on the occurred rockfall events and (ii) application of the Analytic Hierarchy Process (AHP).
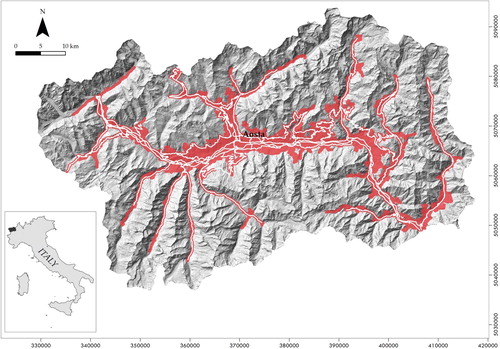
We focused on the area close to regional road network, which extends over 2600 km approximately, exploiting the ‘Catasto Strade’, i.e. regional roads inventory (CitationAosta Valley Region - Cartographic office, 2016), applying a buffer of 250 m along the network, which includes a portion of territory that is relevant for the scopes of the analysis. In addition, a 25-m buffer around the main settlements (SCT CitationGeo Portal, 2005), merging them with the road network area, was operated. The area of interest (AOI) obtained, with an area of 475 km2, corresponds to the 17% of the entire regional territory ().
Figure 1. Aosta Valley Region elevation map. The AOI corresponds to the red area, white lines correspond to the regional road network.
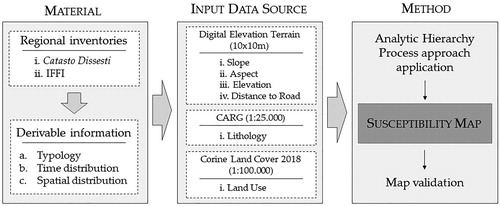
Taking advantage of the landslide inventories actually available for the AVR territory, i.e. Italian Landslide Inventory (IFFI) (ISPRA Ambiente, Citation2007), and of the ‘Catasto Dissesti’, an on-line landslide catalogue at regional scale (Centro Funzionale Regione Autonoma Valle d’Aosta, Citation2019), the spatial and temporal distribution of the occurred rockfalls was analysed. By this way, useful information, suitable to define the variables influencing rockfall events and to identify and assess the more susceptible areas, were obtained. Subsequently, operating in a GIS environment, the identified variables, commonly referred to the rockfalls occurrence, were derived. Successively these variables were combined to generate the Susceptibility Index (SI) of the area of interest (AOI) applying the AHP. The workflow of the implemented methodology is exposed in .
Figure 2. Scheme of the adopted methodology.
3. Rockfalls regional inventories analysis
The availability of landslide inventories is crucial to gather useful information, particularly in terms of morphological, geological and land use characterization, aimed at the rockfalls occurrence definition at regional scale. Thanks to the large amount of available data, referring to the ‘Catasto Dissesti’, the occurred landslides in terms of spatial and temporal distribution were analysed, with the goal to characterize the regional territory relatively to the rockfall events occurrence.
Operating with several tools in a GIS environment, the main morphometric parameters of each inventoried phenomenon were extracted. Taking advantage of the regional Digital Terrain Model (DTM) (10 × 10 m cell size), several derivative products were obtained: (i) slope; (ii) aspect; (iii) elevation. Jointly, land use and lithological data were derived respectively from the Corine Land Cover (Copernicus & Land Monitoring Service, Citation2018) updated to 2018, at 1:100,000 scale, and from the Geo-tectonic Map of the Aosta Valley Region (De Giusti et al., Citation2003). Both for land use and lithology, we operated a merging in homogeneous classes, in order to standardize the datasets, and a conversion to the raster format, with the aim of combining them with DTM related products.
shows the distribution of the inventoried rockfall events for each considered factor at regional scale. It should be noted that the majority of the inventoried phenomena occurred in correspondence of sectors with South–Southeast–Southwest exposure, and high relief, ranging from 25° to 45° (i.e. 27% for ‘25°−35°’, 26% for ‘35°−45’ and 23% for ‘>45°’).
Figure 3. Rockfall events distribution at regional scale, referring to the ‘Catasto Dissesti’ inventory, respect to the considered factors: (a) Slope; (b) Aspect; (c) Elevation; (d) Land Use (A = Forest; B = Zones characterized by shrub and/or herbaceous vegetation; C = Open space with little or no vegetation; D = Zones mainly occupied by agricultural areas; E = Urban areas); (e) Lithology (A = Calcschists and Serpentinites; B = Conglomerates; C = Quaternary deposits; D = Gypsum, Dolomite; E = Gneiss; G = Micaschists; H = Black Schists).
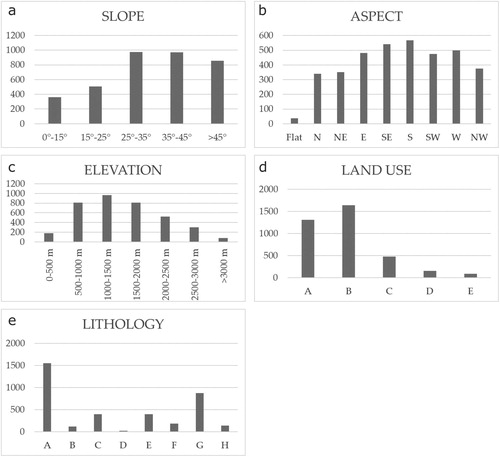
Referring to the elevation, the medium-high portions of the slopes reveal the highest frequency in rockfalls occurrence, with the 16% of cases in correspondence of the ‘1000–1500 m’ class, and the 22% for the ‘1500–2000m’ one. The distribution in correspondence of the highest portions (i.e. 8% in the ‘2500–3000 m’ class and 2% for the ‘>3000 m’ class) is poor.
Considering the land use factors, the 45% of rockfalls occurred in areas characterized by shrub and/or herbaceous vegetation, and the 36% in correspondence of woodlands. Considering the lithology, 42% of the rockfalls occurred in the lithological units belonging to the so-called ‘Piedmont Zone’. This domain includes rocks deriving from the Piemonte-Liguria Ocean crust, i.e. ‘green stones’ (serpentinites and various grade metabasites), and from the Mesozoic sediments of coverage, i.e. calcschists, mainly schistose rock.
By analysing the inventoried rockfalls in terms of temporal distribution, we evaluated a timeseries ranging from the 1180 A.D. and the 2020 A.D., for a total time span of 840 years. (a) shows the overall distribution of the available data, with an evident peak in correspondence of the October 2000 (b), during which one of the most catastrophic flood event hit the Aosta Valley Region (Giardino et al., Citation2013). In general, the most part of inventoried phenomena is recorded in the last 40 years (1980–2020). In fact, during the last decades, the need to characterize the territory for risk management and prevention purposes certainly led to a more complete and accurate data collection, as reflected by the available data abundancy.
Figure 4. Monthly distribution of the inventoried rockfalls at regional scale, referring to the ‘Catasto Dissesti’ inventory, (a) for the overall period, (b) for the period from the last decade of the twentieth century (1990–2000); (c) for the same period but excluding the October 2000 flood.
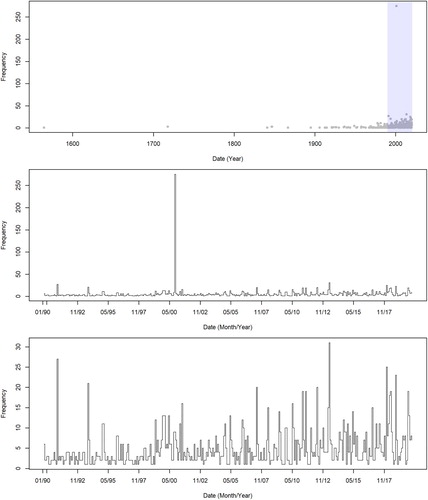
Observing the distribution in the last decades’ distribution, without considering the October 2000 event (c), we can notice that the highest peaks are recorded in spring seasons (e.g. 1991, 2013), while minor peaks occurred during the autumn seasons (e.g. 1993, 2007 and 2018). It is interesting to observe the peak of January 2018 in correspondence of a particularly warm winter season (Centro Funzionale Regione Autonoma Valle d’Aosta, Citation2018), which almost certainly influenced the rockfall occurrence due to the anomalous inflow of groundwater in the slopes due to the cyclical melting of the snow cover during January and February and freeze–thaw cycles.
Performing the analysis of the rockfall monthly distribution, it can be observed that, at regional scale, these phenomena are more frequent in the spring season (months from March to May, 37%), and in the autumn season (months from September to November, 25%), with peaks respectively in May (16%) and October (9%). It should be considered that 47% of the analysed phenomena do not report information relating to the month of occurrence.
4. Considered variables for rockfall susceptibility estimation
Usually, there are no general guidelines for the selection of the variables useful to generate susceptibility maps. Commonly, rockfalls triggering is due to the combination of several factors, including topographic features, earthquakes, vegetation conditions, rock mass conditions, pore pressure increases, mainly related to rainfall infiltration and/or freeze–thaw cycles, and other climatic variables (Lan et al., Citation2010).
By carrying out a regional analysis, decision was made to exploit previous open data available in order to provide a quick and ready-to-use methodology that supplies a preliminary zonation of the area of interest. For this reason, detailed characteristics about rock mass fracturing, local geological and tectonic setting, were not considered at this stage. We considered six variables: (i) slope; (ii) aspect; (iii) elevation, (iv) lithology; (v) land use; (vi) distance to road. From the previously mentioned DTM, we therefore extracted the morphometric parameters relative to the AOI across the regional road network. For the land use, we cropped the Corine Land Use at regional scale on the AOI, while for lithology, we considered the Geological Map of the CARG project (ISPRA Ambiente, Citation2012), made available by the Aosta valley regional administration. By these means, we obtained a more detailed information at the 1:25.000 scale.
4.1. Morphometric parameters
Topographic information are among the most common intrinsic factors adopted to create a susceptibility map (Ayalew et al., Citation2005; Frattini et al., Citation2008; Othman et al., Citation2018). The slope degree is directly related to landslides occurrence and rock falling trajectory. Therefore, this parameter is one of the most used in landslides susceptibility computation (Moreiras, Citation2005). This factor has been divided into five classes: (i) less than 15°; (ii) 15°−25°; (iii) 25°−35°; (iv) 35°−45°; (v) more than 45°.
The slope exposition is an another relevant aspect, mainly in relation to exposure to weather events, for instance rainfall events, solar radiation, and freeze–thaw cycles (Gruber et al., Citation2004; Hall, Citation2004). This factor is divided into four classes, by grouping the conventional aspect class in: (i) flat; (ii) South–Southwest–Southeast; (iii) East–West; (iv) North–Northwest–Northeast.
Finally, the topographic elevation, strictly related to the land cover typology (Demir et al., Citation2013), in general, a high elevation is associated with a land cover mainly represented by bare rock and/or poorly vegetated areas, whilst the lower altitudes are characterized by moderate slope, corresponding to areas with lower rockfall susceptibility. This factor, limited to the AOI elevations, is divided into seven classes: (i) less than 500 m; (ii) 500–1000 m; (iii) 1000–1500; (iv) 1500–2000; (v) 2000–2500; (vi) 2500–3000; (vii) more than 3000 m.
4.2. Lithology
Lithology plays a relevant role in slope instability. The AVR displays a complex geological setting showing a complete sequence of the Western Alps structural domains (Dal Piaz et al., Citation2003), with a wide range of lithologies as well as a great local variety of structural settings, due to the multiple deformative stages of the alpine orogenetic process. Starting from the Geological maps of the CARG project, available at the 1:10.000 on the 85% of the regional territory, various lithologies have been grouped on the basis of their litho-technical properties (Palomba et al., Citation2015). We operated merging in macro-typologies, first distinguishing between deposits and rocks type, and subsequently on the type of deposits or rocks, on the basis of their degree of mobilization. This arrangement reflects the original affiliation to the main alpine tectonic units; the classes have been grouped, depending on the litho-technical properties of the rock, in seven main classes: (i) shale rocks; (ii) massive igneous and metamorphic rocks; (iii) marbles, limestones and dolomites; (iv) tectonized and contact rocks; (v) gravitational deposits; (vi) colluvial and glacial deposits; (vii) alluvial deposits.
4.3. Land use
Land use and vegetation cover can variably condition the rockfall occurrence, playing a relevant role in slope stability. Starting from the detailed classification of land use done in Corine Land Cover project (ISPRA Ambiente, Citation2018), five different classes are generated: (i) urban areas; (ii) agricultural areas; (iii) forests; (iv) sparsely vegetated natural areas; (v) natural areas not or poorly vegetated. Urban areas include all the anthropic areas occupied by residential and industrial buildings, and/or other infrastructures (e.g. airports, quarries, landfills and dumping areas). Pastures, vineyard, fruit trees and other plantations, permanently irrigated arable lands, are gathered in the agricultural areas class. With regard to the forest class, according to the literature, the woodlands have been considered as a protective factor against rockfalls (Fuhr et al., Citation2015). Instead, natural areas sparsely vegetated and natural areas not or poorly vegetated could represent important source areas in rockfalls occurrence.
4.4. Distance to roads
The distance to roads is a key parameter in term of rockfall susceptibility computation. Changes in topography due to road construction, as well as the related local decrease in rock-mass load due to excavations, may influence the bedrock fracturing. Considering also the rockfall risk and the associated damage and casualties, the areas highly close to the road network have been considered the more susceptible. Five classes, obtained applying a dedicated tool in GIS environment, are created along the main regional road network: (i) 0–50 m; (ii) 50–100 m; (iii) 100–150 m; (vi) 150–200; (v) 200–250 m.
5. Analytic hierarchy process
The Analytic Hierarchy Process is a multi-criteria decision-making method, developed by Saaty (Citation1977). This approach is suitable for complex decisions, which involves a multi-object comparison, enabling the user to define a scale of preference from a set of alternatives. To apply the AHP, the initial complex problem needs to be disassembled into its component factors, organizing them in a hierarchic structure. Once the structure is defined, the user operates through the construction of a pair-wise comparison matrix; each factor, or class of factor, is classified against every other one of the matrix, by assigning a numerical value (see ). The numerical value assignment follows subjective, expert based, judgments on the relative importance of each factor (Saaty & Vargas, Citation2012). Finally, the pair-wise comparison matrix is normalized, and the weighted average rating for each decision alternative is computed.
Table 1. Scale of preference between two parameters i and j in the AHP approach (Saaty & Vargas, Citation2012).
In our study, operating with the above-mentioned causal factors, the AHP has been applied assigning weights to both causative factors and to the classes defined for each factor ().
Table 2. Pair-wise comparison matrix and relative weights for rockfall causative factors and relative classes. All the pair-wise comparison matrices are structured ranking the established items with respect to their impact on rockfall occurrence. The meaning of values displayed in the ‘Pair-wise comparison matrix’ is explained in .
The consistency of the judgments is verified through the Consistency Ratio (CR) computation (CitationSaaty, 2000), which is obtained by the ratio between the Consistency Index (CI) and the Random Consistency Index (RI):
(1)
(1) When the CR is larger than 10%, the subjective judgment is inconsistent and needs a revision.
The computation of the susceptibility is performed in a statistical open source environment (R Development Core Team, Citation2011), by reclassifying and rasterizing the thematic layers of the six considered causal factors. More in detail, we applied the procedure based the weighted linear sum (WLS) to define the landslide susceptibility index (LSI)
(2)
(2) The performance of the model was the evaluated by comparing it with occurred rockfall database and by computing ROC (Chung & Fabbri, Citation2003).
6. Rockfall susceptibility map and validation
By exploiting spatial and temporal information of the occurred rockfalls of previous inventories, together with the application of the AHP, we obtained the Rockfalls Susceptibility Map (Main map ref) of the study area, i.e. the road network of the AVR and the main settlements in its proximity. The pair-wise comparison matrix was based on six main variables, divided in subclasses, and ranked in term of their impact on slope instability. Through the comparison matrix application, we obtained the normalized principal eigenvector, both for the main variables and the classes of each one (). The slope factor provided the highest weight of 0.41, resulting the most relevant variable, followed by lithology with a weight of 0.24. Focusing on each factor classes, the most relevant variables correspond to the slope interval ‘35°−45°’, aspect ‘Southeast–South–Southwest’, lithology ‘Shale rocks’, land use featuring ‘Natural areas not or poorly vegetated’ and distance to road ‘50–1000 m’ interval. In order to verify the consistency of the obtained weights and rating of each considered causative factors, we computed the Consistency Ration (CR), based on the relative value of Consistency Index (CI) and Random Consistency Index (RI) ().
Table 3. Consistency values of the considered factors.
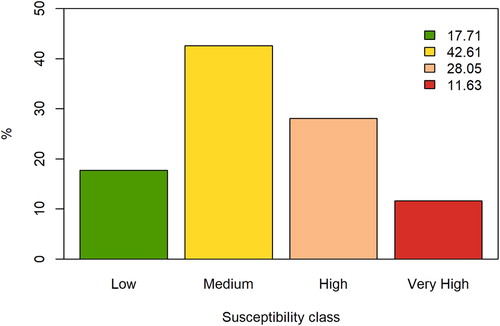
The obtained Rockfall Susceptibility Map (Main map) shows SI values ranging from 0.037 and 0.413. By applying the ‘Natural breaks’ classification of Jenks (Ayalew & Yamagishi, Citation2005), available in GIS environment, the SI values are classified into four classes: (i) low; (ii) medium; (iii) high; (iv) very high. Considering the AOI, close to the regional road network, on a total of 475 km2, the ‘very high’ and ‘high’ classes cover respectively 28.05% and 11.63% of the analysed area (). The computation of these values is carried out on a filtered AOI surface where flat (i.e. aspect value of −1) or gently sloping (i.e. slope lower than 5°) sectors are removed. This selection was performed to exclude the main valley bottom, which is negligible in terms of hazard characterization and whose inclusion in the analysis might lead to an underestimation of the susceptibility class’s distribution.
Figure 5. Surface distribution (% of the filtered AOI) of the susceptibility classes.
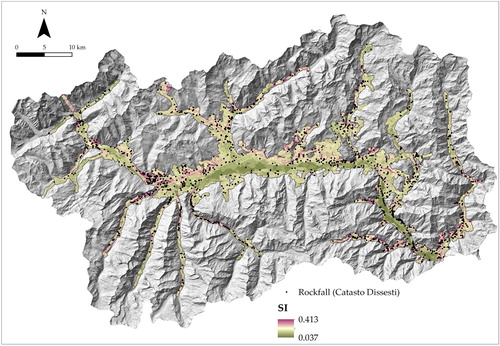
Analysing the distribution of the inventoried rockfalls of the regional catalogue within the AOI (), a first validation of the obtained result has been performed. This result shows that about 70% of the inventoried phenomena are located in areas with high or very high susceptibility. The obtained susceptibility map consistently matches the previous inventoried rockfalls, showing that, as predicted by the model, these events mainly fall in ‘high’ (35%) and in ‘very high’ (33%) classes.
Figure 6. Susceptibility map of the road network of the AVR; black dots correspond to the rockfall events collected in the ‘Catasto Dissesti’ regional inventory within the AOI.
The most part of phenomena occurred in sectors with high to very high relief (e.g. class ‘25°−35° 27%, class ‘35°−45°’ 24%), with a South–Southeast–Southwest exposition. Considering the elevation factor, about 70% of the occurred phenomena are located from 500 to 1500 m a.s.l., as also highlighted by the results obtained. Lithologically, the majority of the events involved ‘Shale rocks’ lithologies (18%), while considering quaternary deposits, the most part occurred in gravitative deposits or in colluvial/glacial deposits (respectively 35% and 27%). Considering land use factor, the rockfalls are mainly distributed in correspondence of ‘Natural areas not or poorly vegetated’ (47%). It should be noted that more than about 60% of rockfalls within the AOI, occurred at a distance of fewer than 50 m from the road network. Excluding the morphometric and lithology factors, the only modifiable factors to reduce rockfall susceptibility are the ‘Land use’ and ‘Distance to Roads’. However, even though increasing the distance of the road from the rock cliff should reduce the susceptibility, the implementation of this measure is hardly feasible in a very compartmentalized territory marked by narrow valleys. Analysing the available information about the recorded damage, although most of inventoried phenomena do not report information, we observed that about a hundred of the occurred phenomena indicate damage to roads, comprehensive of vehicles damage, and a few tens to buildings, mainly private, and other facilities. In the last years, the availability of web services led to a more accurate collection and management of the ancillary data related to each event, standardizing the format of the data gathering. Therefore, the recent reports include key information as rockfall volume, damage, occurrence date. Future improvements should be carried out, based on this increasingly collected and updated information, specifically, in term of relationship between rockfalls occurrence and their impact. Moreover, the role of forested areas should be investigated, in order to exploit their protective function (Moos et al., Citation2018).
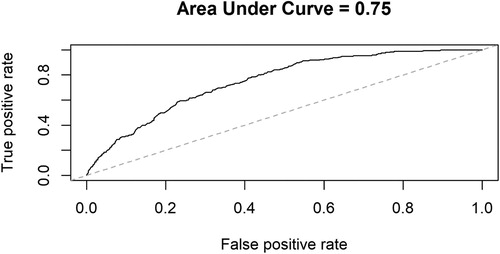
Additional validation of the obtained map has been done applying the Receiver Operating Characteristic (ROC) curve, obtaining a success rate of up to 75% () and confirming the reliability of the proposed modelling.
Figure 7. ROC curve computed on the basis of the comparison between rockfall grid cells and rockfall susceptibility grid.
7. Conclusion
Rockfall hazard is a threat for human settlements and infrastructures in mountain areas. Its characterization deserves a dedicated methodology in order to better manage its impact and consequences. The proposed procedure takes in account several morphometric and thematic parameters in order to map rockfall susceptibility focusing on road network of the AVR by the use of AHP. Additionally, with the aim of improving the analysis set up, a detailed investigation of the recorded events, in the last 40 years, was carried out pointing out seasonality and other relevant data. The outcome of the AHP was then validated by the comparison with a national database of rockfall events resulting in a satisfactory result thus confirming the validity of the proposed approach. The proposed methodology provides a quick procedure for a preliminary zonation of the areas more susceptible to rockfalls at regional scale, representing a first step in rockfall risks assessment. This preliminary step allowed to identify those areas to be targeted for an in-depth risk analysis, with the support of field observations and measurements collection for following local aspects characterization (e.g. local geological and tectonic setting, rock mass condition). Jointly, this procedure becomes functional to the definition of the actions for the risk management and the implementation of regulation infrastructural works for risk reduction, useful for regional authorities of mountainous territories.
Software
The rockfall susceptibility map was developed by the employment of several GIS tools, available in ArcGIS 10.5.1 (and following releases) and R 3.3 (and following releases).
TJOM_1850534_Main Map
Download PDF (34 MB)Disclosure statement
No potential conflict of interest was reported by the author(s).
References
- Aosta Valley Region – Cartographic office. (2016). Catasto strade. Retrieved March 20, 2020, from http://geoportale.regione.vda.it/applicazioni-sct/
- Ayalew, L., & Yamagishi, H. (2005). The application of GIS-based logistic regression for landslide susceptibility mapping in the Kakuda-Yahiko Mountains, Central Japan. Geomorphology, 65(1–2), 15–31. https://doi.org/10.1016/j.geomorph.2004.06.010
- Ayalew, L., Yamagishi, H., Marui, H., & Kanno, T. (2005). Landslides in Sado Island of Japan: Part II. GIS-based susceptibility mapping with comparisons of results from two methods and verifications. Engineering Geology, 81(4), 432–445. https://doi.org/10.1016/j.enggeo.2005.08.004
- Budetta, P. (2004). Assessment of rockfall risk along roads. European Geosciences Union (Vol. 4). https://hal.archives-ouvertes.fr/hal-00299069
- Centro Funzionale Regione Autonoma Valle d’Aosta. (2018). Clima: i record del 2018. Retrieved April 8, 2020, from https://cf.regione.vda.it/2018_piu_caldo_e_piu_bagnato.php
- Centro Funzionale Regione Autonoma Valle d’Aosta. (2019). Catasto Dissesti. Retrieved March 16, 2020, from http://catastodissesti.partout.it/informazioni
- Chung, C. J. F., & Fabbri, A. G. (2003). Validation of spatial prediction models for landslide hazard mapping. Natural Hazards, 30(3), 451–472. https://doi.org/10.1023/B:NHAZ.0000007172.62651.2b
- Cignetti, M., Godone, D., Zucca, F., Bertolo, D., & Giordan, D. (2020). Impact of deep-seated gravitational slope deformation on urban areas and large infrastructures in the Italian Western Alps. Science of the Total Environment, 740, Article 140360. https://doi.org/10.1016/j.scitotenv.2020.140360
- Copernicus, & Land Monitoring Service. (2018). Corine land cover. Retrieved May 5, 2020, from https://land.copernicus.eu/pan-european/corine-land-cover/clc2018
- Crosta, G. B., Lollino, G., Paolo, F., Giordan, D., Andrea, T., Carlo, R., & Davide, B. (2015). Rockslide monitoring through multi-temporal LiDAR DEM and TLS data analysis. In G. Lollino, D. Giordan, G. B. Crosta, J. Corominas, R. Azzam, J. Wasowski, & N. Sciarra (Eds.), Engineering geology for society and territory - volume 2 (pp. 613–617). Springer International Publishing. http://link.springer.com/10.1007/978-3-319-09057-3_102
- Dal Piaz, G. V., Bistacchi, A., & Massironi, M. (2003). Geological outline of the Alps. Episodes, 26(3), 175–180. https://doi.org/10.18814/epiiugs/2003/v26i3/004 http://episodes.org/index.php/epi/article/download/62456/48723
- De Giusti, F., Dal Piaz, G. V., Massironi, M., & Schiavo, A. (2003). Carta geotettonica della Valle d’Aosta. Memorie Di Scienze Geologiche, 55, 129–149.
- Demir, G., Aytekin, M., Akgün, A., İkizler, S. B., & Tatar, O. (2013). A comparison of landslide susceptibility mapping of the eastern part of the North Anatolian Fault Zone (Turkey) by likelihood-frequency ratio and analytic hierarchy process methods. Natural Hazards, 65(3), 1481–1506. https://doi.org/10.1007/s11069-012-0418-8
- Frattini, P., Crosta, G. B., & Agliardi, F. (2012). 22 rockfall characterization and modeling. Landslides: Types, Mechanisms and Modeling, 267–281.
- Frattini, P., Crosta, G., Carrara, A., & Agliardi, F. (2008). Assessment of rockfall susceptibility by integrating statistical and physically-based approaches. Geomorphology, 94(3–4), 419–437. https://doi.org/10.1016/j.geomorph.2006.10.037
- Fuhr, M., Bourrier, F., & Cordonnier, T. (2015). Protection against rockfall along a maturity gradient in mountain forests. Forest Ecology and Management, 354, 224–231. https://doi.org/10.1016/j.foreco.2015.06.012
- Giardino, M., Giordan, D., & Ambrogio, S. (2004). GIS technologies for data collection, management and visualization of large slope instabilities: Two applications in the Western Italian Alps. Natural Hazards and Earth System Sciences, 4(2), 197–211. https://doi.org/10.5194/nhess-4-197-2004 https://hal.archives-ouvertes.fr/hal-00301604/
- Giardino, M., Ratto, S., Palomba, M., Alberto, W., Armand, M., & Cignetti, M. (2013). The debris flows inventory of the Aosta Valley Region: An integrated natural hazards assessment. In Landslide Science and Practice (pp. 127–134). Springer. https://doi.org/0.1007/978-3-642-31325-7_16
- Gruber, S., Hoelzle, M., & Haeberli, W. (2004). Rock-wall temperatures in the Alps: Modelling their topographic distribution and regional differences. Permafrost and Periglacial Processes, 15(3), 299–307. https://doi.org/10.1002/ppp.501
- Guzzetti, F. (2000). Landslide fatalities and the evaluation of landslide risk in Italy. Engineering Geology, 58(2), 89–107. https://doi.org/10.1016/S0013-7952(00)00047-8
- Guzzetti, F., Reichenbach, P., & Ghigi, S. (2004). Rockfall hazard and risk assessment along a transportation corridor in the Nera Valley, Central Italy. Environmental Management, 34(2), 191–208. https://doi.org/10.1007/s00267-003-0021-6
- Hall, K. (2004). Evidence for freeze–thaw events and their implications for rock weathering in northern Canada. Earth Surface Processes and Landforms, 29(1), 43–57. https://doi.org/10.1002/esp.1012
- Hungr, O., Evans, S. G., & Hazzard, J. (1999). Magnitude and frequency of rock falls and rock slides along the main transportation corridors of southwestern British Columbia. Canadian Geotechnical Journal, 36(2), 224–238. https://doi.org/10.1139/t98-106
- ISPRA Ambiente. (2007). IFFI Catalogue. Retrieved April 3, 2020, from http://www.isprambiente.gov.it/it/progetti/suolo-e-territorio-1/iffi-inventario-dei-fenomeni-franosi-in-italia
- ISPRA Ambiente. (2012). CARG Project. Retrieved April 20, 2020, from http://www.isprambiente.gov.it/it/progetti/suolo-e-territorio-1/progetto-carg-cartografia-geologica-e-geotematica
- ISPRA Ambiente. (2018). Corine Land Cover. Retrieved April 9, 2020, from http://www.isprambiente.gov.it/it/temi/biodiversita/documenti/corine-land-cover-clc
- Jaboyedoff, M., Baillifard, F., Hantz, D., Heindenreich, B., & Mazzocolla, D. (2001). Terminologie = Terminologia. Prévention Des Mouvements de Versants et Des Instabilités de Falaises: Confrontation Des Méthodes d’étude Des Éboulements Dans l’arc Alpin, 48–57.
- Jaboyedoff, M., Choffet, M., Derron, M. H., Horton, P., Loye, A., Longchamp, C., Mazotti, B., Michoud, C., & Pedrazzini, A. (2012). Preliminary slope mass movement susceptibility mapping using DEM and LiDAR DEM. In B. Pradhan & M. Buchroithner (Eds.), Terrigenous mass movements (pp. 109–170). Springer. http://link.springer.com/chapter/10.1007/978-3-642-25495-6_5
- Lan, H., Martin, C. D., Zhou, C., & Lim, C. H. (2010). Rockfall hazard analysis using LiDAR and spatial modeling. Geomorphology, 118(1–2), 213–223. https://doi.org/10.1016/j.geomorph.2010.01.002
- Martinotti, G., Giordan, D., Giardino, M., & Ratto, S. (2011). Controlling factors for deep-seated gravitational slope deformation (DSGSD) in the Aosta Valley (NW Alps, Italy). Geological Society, London, Special Publications, 351(1), 113–131. https://doi.org/10.1144/SP351.6
- Mineo, S. (2020). Comparing rockfall hazard and risk assessment procedures along roads for different planning purposes. Journal of Mountain Science, 17(3), 653–669. https://doi.org/10.1007/s11629-019-5766-3
- Mineo, S., & Pappalardo, G. (2019). Sustainable fruition of cultural heritage in areas affected by rockfalls. Sustainability, 12(1), Article 296. https://doi.org/10.3390/su12010296
- Moos, C., Fehlmann, M., Trappmann, D., Stoffel, M., & Dorren, L. (2018). Integrating the mitigating effect of forests into quantitative rockfall risk analysis – two case studies in Switzerland. International Journal of Disaster Risk Reduction, 32, 55–74. https://doi.org/10.1016/j.ijdrr.2017.09.036
- Moreiras, S. M. (2005). Landslide susceptibility zonation in the Rio Mendoza Valley, Argentina. Geomorphology, 66(1–4), 345–357. https://doi.org/10.1016/j.geomorph.2004.09.019
- Othman, A. A., Gloaguen, R., Andreani, L., & Rahnama, M. (2018). Improving landslide susceptibility mapping using morphometric features in the Mawat area, Kurdistan Region, NE Iraq: Comparison of different statistical models. Geomorphology, 319, 147–160. https://doi.org/10.1016/j.geomorph.2018.07.018
- Palma, B., Parise, M., Reichenbach, P., & Guzzetti, F. (2012). Rockfall hazard assessment along a road in the Sorrento Peninsula, Campania, southern Italy. Natural Hazards, 61(1), 187–201. https://doi.org/10.1007/s11069-011-9899-0
- Palomba, M., Giardino, M., Ratto, S., & Pogliotti, P. (2015). Analysis of factors controlling landslide susceptibility in the Aosta Valley (NW Italy): Relationship to climatic and environmental changes. In Engineering geology for society and territory - volume 1: Climate change and engineering geology (pp. 435–438). Springer International Publishing. doi:10.1007/978-3-319-09300-0_83.
- R Development Core Team. (2011). R: A Language and environment for statistical computing. (R. D. C. Team, Ed.) (Vol. 1). R Foundation for Statistical Computing. https://doi.org/10.1007/978-3-540-74686-7
- Saaty, T. L. (1977). A scaling method for priorities in hierarchical structures. Journal of Mathematical Psychology, 15(3), 234–281. https://doi.org/10.1016/0022-2496(77)90033-5
- Saaty, T. L. (1980). Analytic hierarchy process. Wiley Online Library.
- Saaty, T. L. (2000). (2nd ed.), Fundamentals of decision making and priority theory with the analytic hierarchy process, Vol. VI. Universitas Pittsburgh. USA.
- Saaty, T. L., & Vargas, L. G. (2012). Models, Methods, Concepts & Applications of the Analytic Hierarchy Process. Springer Science & Business Media.
- SCT Geo Portal, A. V. R. (2005). Regional technical map. Retrieved March 20, 2020, from http://geoportale.regione.vda.it/download/ctr/
- Trigila, A., Iadanza, C., & Spizzichino, D. (2008). IFFI project (Italian landslide inventory) and risk assessment. In Proceedings of the first World landslide forum (pp. 603–606).
- Volkwein, A., Schellenberg, K., Labiouse, V., Agliardi, F., Berger, F., Bourrier, F., Dorren, L. K., Gerber, W., & Jaboyedoff, M. (2011). Rockfall characterisation and structural protection-a review.