
 ?Mathematical formulae have been encoded as MathML and are displayed in this HTML version using MathJax in order to improve their display. Uncheck the box to turn MathJax off. This feature requires Javascript. Click on a formula to zoom.
ABSTRACT
UAVs have become a useful tool for natural hazard monitoring. In volcanic areas, they allow wider observations of the eruptive behaviour, with no risk for the operator. The SfM technique enables obtaining orthoimages of lava flows and a DEM in a short time. These data are also useful to estimate lava flow volumes and the mass output rate characterizing an eruption. We present the results of ten UAV surveys made during and after the 30 May – 6 June 2019 eruption of Etna volcano, projecting the data in a time context back until 1999. Orthoimages taken on different days allowed monitoring the morpho-structural evolution of the fissures, capturing the lava flows propagation and the accumulation of pyroclastic deposits. From 1999 to 2018, there were nine flank-eruptions and dozens of summit-eruptions, which for graphic simplicity have been grouped by year in the map. The resulting map represents the most updated of the recent lava flows of Etna.
1. Introduction
In the last decade, Unmanned Aerial Vehicles (UAVs) have become useful tools for natural hazard observation, monitoring and studying. In volcanic areas, they allow a wider observation from above compared to traditional fieldwork, with no risk for the operator; in addition, a UAV survey is cheaper and faster with respect to using a helicopter (another widespread tool in the context of volcanic monitoring). From 2017, the Istituto Nazionale di Geofisica e Vulcanologia, Osservatorio Etneo (INGV-OE), Italy, began using UAVs as an essential tool both for lava flow monitoring and mapping and for visible and thermal observations of the summit craters (CitationDe Beni et al., 2019). The Structure from Motion (SfM) technique allows obtaining orthoimages to map lava flows in a short time, of key importance to provide the information needed for civil protection purposes in order to face the emergency quickly. On the other hand, it is also possible to obtain a georeferenced Digital Elevation Model (DEM), useful to obtain lava flow volumes, as DEMs difference between pre- and post-eruption surfaces, and as a consequence, the Mass Output Rate (MOR), one of the most important features of an eruption. The post-eruption topography, highlighted by the new DEM, has a significant influence on the propagation of new lava and pyroclastic flows, a fundamental aspect for hazard assessment and risk mitigation.
In this paper, we present the results of several UAV surveys made during and after the 30 May – 6 June 2019 eruption of Etna volcano, Italy, projecting the acquired data in a wider temporal context, which starts from 1999. This eruption was characterized by two different lava flows emplaced in different sectors of the Valle del Bove area, at a distance ranging from 1 up to 2 km from each other. The Valle del Bove is a horseshoe-shape depression W-E oriented, which opened about 9 ka ago (CitationBranca et al., 2016; CitationCalvari et al., 2013) in the east flank of Etna volcano. This depression is more than 7 km wide in the eastern area and 2 km in the upper zone, where the difference in altitude is more than 1000 m, with walls that slope between 20 - 45°. The Valle Del Bove, characterized by steep slopes and rugged terrain, is generally not readily accessible, which made mapping particularly difficult both from the field as well as from remote because it is frequently covered by clouds. The two eruptive fissures opened among the most dangerous areas to reach by foot, with several open fractures and the possibility of rock falls, landslides and pyroclastic flows (CitationAndronico et al., 2018; Citation2009). Taking this into account, a detailed, high-resolution and frequent survey of the eruptive scenario could be satisfactorily carried out with the help of UAVs.
Thanks to the images and videos taken on different days it was possible to monitor the evolution of the eruptive fissures, to map the lava flow field, to characterize the eruption from a geometrical point of view, defining area, volume and MOR and to evaluate the accumulation of proximal pyroclastic deposits. Furthermore, our high-resolution surveys allowed detailing the morpho-structural elements of the eruptive vents on the east of the New South-East Crater flank (Citation2019). With these surveys, it was also possible to complete and improve, in quality and precision, the lava flow map of the 24–27 December 2018 eruption (Citation2019; CitationCannavò et al., 2019) that was made with satellite and helicopter images during that eruption. In addition to the map of the May 2019 and December 2018 eruptions, we also present a lava flows map including the last 21 years of effusive activity on Etna, mapped both through the identical methodology represented here, and through more traditional detection techniques, based on data acquired on the ground with pocket GPS, orthoimages and satellite data (Citation2005). The authors have been contributing to the monitoring activity of the Cartography Laboratory of the Istituto Nazionale di Geofisica e Vulcanologia, Osservatorio Etneo (MAP-LAB hereafter) since 2009, including the volcanic products mapping and their divulgation through a Geoportal (http://geodb.ct.ingv.it/geoportale/; CitationDe Beni & Proietti, 2010; CitationMontalto et al., 2016). Considering that the Geological Map of Etna Volcano (Citation2011) shows the volcanics up to 2007, update the map could prove useful for the scientific community.
With this paper, we wish also to demonstrate that UAVs have become an undeniable tool for lava flow mapping even if the applied methodology during the UAV survey is perhaps not the best practice to obtain reliable photogrammetric results (CitationHuang et al., 2017), it is a good compromise, considering the extreme environmental conditions, as already shown in CitationDe Beni et al. (2019). Our approach could also be applied to tackle other environmental risks (for instance landslides, floods, and avalanches) in mountainous or inaccessible areas producing valuable, accurate, and timely information to support emergency responses.
2. Methods
Mapping active lava flows is a primary source of information to document an ongoing eruption, and is crucial for decision makers when facing an eruptive crisis. Various information derives from a detailed lava flow map, i.e. location and morpho-structural characteristics of the vent, flow direction, areal extent and secondary analysis the thickness, volume and the effusion rate. The quality and reliability of this information is the direct consequence of accurate and detailed mapping. In addition, during long-lasting eruptions, near-continuous monitoring and mapping allow documentation of the lava field growth and evolution and a better understanding of the lava transport and emplacement (CitationPedersen et al., 2017). The quality and timing of lava flow mapping have improved significantly thanks to UAVs and SfM techniques. Traditionally, it was necessary to use a helicopter and carry out a GPS field survey to draw a satisfactory map, which is both times consuming and requiring numerous staff.
Since 2015, a new team at INGV-OE has managed and operated a fleet of UAVs, comprising composed by 2 DJI Phantom 3 Pro, #1 DJI Phantom 4 Pro, #1 DJI Phantom 4 RTK, #1 DJI Mavic Pro and #1 DJI Mavic Enterprise Dual. These UAV models are comparable to very stable flying cameras, used to capture images and videos of eruptions following a manual or pre-calculated flight mission, the latter in a autonomous way, remotely piloted by an operator in the field.
Mapping of the lava flow of the Etna volcano eruption from 30 May to 6 June 2019 was performed with ten flights subdivided into four surveys ( and ), optimized by choosing different take-off points, in order to have a minimum horizontal and vertical distance, from the area to be surveyed, while maintaining appropriate safety distance. A series of pictures is taken during the flight on the basis of a ‘timed shot’ interval. Several factors affect the overall quality of the captured images, particularly the cruise speed and the flight height. The Structure-from-Motion (SfM) algorithm imposes an overlap between consecutive images to be no less than 65%–70%. For volcanological hazard monitoring a value of 25 cm/pixel may be enough, allowing to fly very high, even more than 200 m from the ground.
Figure 1. Lava flow map of 2017, 2018 and 2019 lava flows on a 2015 shaded relief (Citation2019), coordinates refer to the WGS84 ellipsoid, the map projection is UTM (Zone 33N), equidistance contour lines 50 m (brown lines). White plains indicate the 5 different take-off points, colored rectangle enclose the overflown area from each take-off point. Full color polygon = summit lava flow; hatching polygon = flank lava flow; doted polygon = pyroclastic deposits. SdA = Schiena dell’Asino, BlV = Belvedere; TdF = Torre del Filosofo, RdV = Rocca della Valle, SEC = South East Crater, NSEC = New South East Crater, BN = Bocca Nuova, VOR = Voragine; NEC = North East Crater.
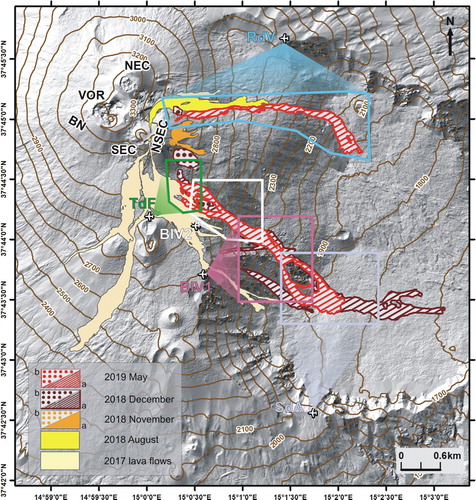
Table 1. Survey overview table: coordinates refer to the WGS84 ellipsoid, the projection is UTM (Zone 33N), and elevations are orthometric.
Mapping the 30 May – 6 June 2019 lava flow required the processing of XYZ aerial pictures, implying a very heavy photogrammetric workload. Agisoft PhotoScan was used to carry out the SfM technique, obtaining the results presented here (for more detail about SfM see appendix 1).
The surveys made to map the May 2019 lava flows were carried out with notable operational difficulties since the elevation difference between the emission point and the front was very high (about 1300 m) and the lava flow had emplaced on a particularly steep topography. Most of the lava had flowed within the Valle del Bove for this reason the take-off point could only be located close to the proximal area (). In addition, it was not possible to position the ground control points due to the extremely rough terrain and the related danger. This problem could invalidates the results from a georeferencing point of view and as a consequence the accuracy of the mapping process and of the volume calculation. To overcome the difficulty, we applied the point cloud alignment technique, successfully adopted in 2017 (CitationDe Beni et al., 2019) using 3D Reshaper software. We aligned the point cloud obtained with the UAV surveys to the point cloud of a pre-eruption surface used as reference. The pre-eruption surface chosen among existing ones was the 2015 DEM (Citation2019), the most recent and validated available. It is a high-resolution, high vertical accuracy digital elevation model (DEM) derived from Pleiades satellite data covering an area of about 400 km2 with a spatial resolution of 2 m. The accuracy of the DEM is calculated using RMSE (Root Mean Square Error) and following CitationMukherjee et al. (2015). RMSE exhibits on an average how far observed values deviate from the assumed true value, it is a single quantity characterizing the error surface.
Thanks to the Agisoft Photoscan software the orthoimages of the lava flow field have been realized. Importing the orthoimages into GIS software (ArcGIS) allowed for drawing the lava boundaries. Once the lava has been mapped, information can be extracted such as the covered area and volume. Lava flow volumes can be estimated by two different approaches, namely planimetric and topographic, on the basis of the available data (CitationDe Beni et al., 2019 and references within). The former consists of multiplying the mapped area by thickness, usually measured from the field. In this case, the accuracy depends on the uncertainties inherent in both flow mapping and thickness measurements (Albino et al., Citation2020). Thicknesses in the topographic method, considered more accurate than the planimetric one (Coltelli et al., Citation2007), are estimated by distinguishing between pre- and post-eruption surfaces derived from DEMs.
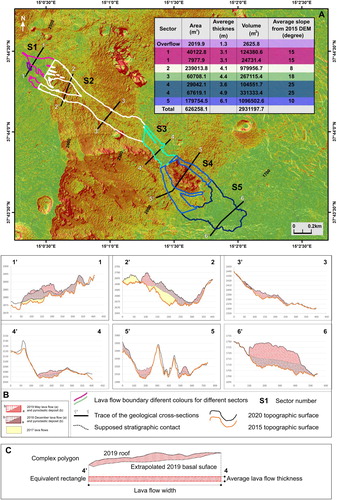
In this paper, it was necessary to apply both techniques due to the lack of an updated pre-eruption surface of the south side of the Valle del Bove. In this area, one lava flow field was emplaced in March-April 2017 and another in December 2018 (). Unfortunately, the May 2019 lava flows followed exactly the same path of the previous event. Against this background, all we could do was to apply the planimetric approach and find a way to evaluate the lava flows thickness by exploiting available data. The first step was an accurate control of the exact location of the previous lava flows (2017 and 2018). After accurately mapping the May 2019 lava flow, using the orthoimages and the DEM obtained by the photogrammetric elaboration, we performed 6 profiles to measure the lava flow thickness. The May 2019 lava flow lasted at least 6 days, enabling a simple lava flow field to form (sensu CitationWalker, 1971, Citation1973) whose emplacement and thickening is essentially governed by topography hence on changes in the slope. Assuming that the thickness of a simple lava field remains constant on a surface with a constant slope (CitationBehncke et al., 2014), we have identified 5 sectors with a homogeneous slope within the area covered by the lava flow itself ((A)). By comparing the thickness variation in each geological cross sections with the lava flow map, it was possible to identify the overlap area of different lava flows and distinguish the different contributions to lava thickness ((B)). In this way, it is possible to evaluate the average thickness in each sector with a constant slope. Moreover, we assume that the morphology of the lava flows, characterized by channels, could be approximated by a tabular morphology if we locate the lava flow roof at a thickness equivalent at the medium value previously evaluated. In brief, the negative ones (with respect to the average) balance the positive morphologies that rise up from the average thickness. To evaluate the average thickness, we have isolated a complex polygon, resulting from the geological cross-section where the roof of the polygon is the 2019 lava flow surface, and the basal surface was extrapolated from the outcrops along the section. Each complex polygon has subsequently been modified and reduced to an equivalent rectangle whose width is given by the lava flow width, where it is sectioned, and the height results dividing the complex polygon area by its width ((C)).
Figure 2. (A) slope map of the East wall of the Valle del Bove, obtained from 2015 DEM (Citation2019) equidistance contour lines 50 m (gray lines). There are 5 sectors, within the 2019 south lava flow, characterized by constant degree slope as a consequence each sector have constant thickness. (B) Geological cross sections. (C) The sketch explains the areal correspondence between the complex polygon and the equivalent rectangle corresponding at section 4.
The volume of the lava flow emplaced on the north side of the Valle del Bove was obtained by the topographic approach as differencing pre-eruption surface, the 2015 DEM (Citation2019), and post-eruption surface from UAVs measurements. The May 2019 lava flow was emplaced in an area affected by a lava flow emitted during August 2018, and fortunately there is a negligible overlap between the two lava flows of about 3%. The volume was calculated using the ArcGIS Cut and Fill tool from the following:
where
is the grid cell side and
is the height difference between the post- and pre-eruption surfaces, for each pixel within the lava flow (De Beni et al., Citation2019). Errors on the volume estimation have been calculated starting from the standard variance propagation law applied to the volume equation. The maximum error on the volume is linearly dependent on the standard deviation on the height variations (
) calculated inside regions where no change occurred, performing elevation differences between the involved DEMs (2015 as pre- and 2019 as post-eruption; for more detail on error calculation see CitationDe Beni et al., 2019 and references therein).
Sadly, the DTM 2015 (Citation2019) is affected by an error in the area covered by the lava front. For this reason, the volume of the lava front, almost 50% of the northern lava flow, has been calculated by interpolating a basal surface with the ArcGIS Natural Neighbor interpolation tool (CitationDe Beni et al., 2019). The basal surface was interpolated starting from a point shapefile, drawn 5 m outside the lava flow boundary, whose XYZ coordinates come from the DEM derived by UAV.
3. Results
Thanks to 10 UAVs surveys, it was possible to compile a detailed map of lava flows and pyroclastic deposits emitted during the May 2019 eruption (). Each survey enabled obtaining different products such as video or images that allow the observation of the eruptive activity from above; moreover, the images have been processed with SfM to obtain orthoimages and DEMs at different stages of the eruption ().
Table 2. summary table of the main products obtained from each survey and their characteristics, no data value in the DEM accuracy is due to the lack of a reference surface in the vent area.
The sharpness of the images taken during the eruption is low due to the amount of gas close to the vents making mapping difficult. To overcome this problem, we performed several surveys on different days, with different levels of resolution and accuracy, which we use both to give timely information during the first emergency phases, and for more precise descriptions of the phenomena, performed with greater accuracy. For example, the orthoimages can identify portions of lava flow that were clearly visible when still hot and hence similar to previous ones when they cooled (). Moreover, when the eruption is still ongoing vents are clearly visible. For a more reliable DEM processing and for an accurate volume calculation, it is necessary to carry out surveys in ‘calm conditions’ to obtain clear images. The almost 300 images taken during the survey from Rocca della Valle have been elaborated in a single run covering the entire extension of the northern lava flow with 1.622 m2. The orthoimages and DEM cell size are 0.05 and 1.07 m respectively. The eastern lava flow, slightly longer than the northern one, was covered with several surveys, undertaken on different days and with different light and weather conditions. The lava front has been captured from the Schiena dell’Asino location (); 69 images have been handled obtaining an orthoimage and a DEM with a cell size of 0.02 and 1.76 m respectively; the overflown area was 300,000 m2. The main lava flow portion located on the east wall of the Valle del Bove and the proximal area have been overflowing from different places but the 569 images have been run in a single process covering an area of 1,689,700 m2. The orthoimages and DEM cell size are 0.05 and 1.54 m respectively. Orthoimages and shaded relief are visible in the main map with a magnification of the eruptive fissures areas. The northern fissure is composed of two sub-parallel NE-SW fractures, ranging from 50 up to 120 m in length; the southern one is elongated NW-SE and is characterized by 25 eruptive vents, having a diameter ranging from 0.3 up to 20 m. All of the lava flow field was mapped, obtaining a total lava field area of 0.9 × 10⁵ m2, 6 and 3 ×10⁵ m2 in the east and in the north lava flows respectively. The volume of the south lava flow unit has been evaluated at 2.9 ×10⁶ m3 with the planimetric approach (). The volume of the north lava flow unit derives from the topographic approach at 1.5 ± 0.7 ×10⁶ m3 ().
Figure 3. Orthoimages of the vent obtained after the first two surveys; the steam makes it difficult to clearly identify some areas of the lava field but the vents are more visible thanks to the hot lava.
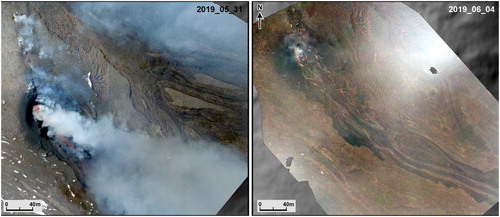
Table 3. Area and volume calculated for the northern lava flow and for its proximal pyroclastic deposit. σΔZ = standard deviation on the height variations MAX = Maximum MIN = Minimum, N = total number of cells within the area.
Dividing the total volume by the duration of the 28 h, a mass output rate (MOR) of 14.7 m3/s resulted for the northern lava flow, while the eastern lava flow is characterized by a lower MOR of 5.6 m3/s because it lasted 6 days.
4. Discussion and conclusions
Mt Etna is one of the most active volcanoes in the world – indeed, starting from 1999, we can count almost 70 eruptions with both summit and flank-producing lava flows (Cappello et al., Citation2019). Therefore, knowledge of the eruptions means knowing where, how and when a lava flow emplaced. One of the tasks of the Cartography Laboratory (MAP-LAB) of the INGV-OE is to update a geo-database of the effusive activities. This geo-database is available at http://geodb.ct.ingv.it/geoportale/ where lava flow maps can be downloaded as WMP (WEB Map Service).
Different approaches have commonly been used to map lava flows in the field and remotely (from the air) on Etna. Ground-based surveys have two disadvantages, namely potential danger to ground-based personnel and the often-limited accessibility to advancing lava flows and expanding flow fields (CitationCalvari et al., 2003; CitationHarris et al., 2007; CitationSpampinato et al., 2011). Radar satellite data, on the other hand, is safer and can provide a comprehensive assessment of the total lava flow field, essential when attempting to monitor flow fronts during volcanic eruptions. Nonetheless, it can be hampered by the presence of clouds and is generally less accurate than ground measurements (Citation2019; CitationGanci et al., 2016; Citation2015). UAVs offer a good compromise between reliable results and personnel safety and were successfully tested on Etna in 2017 (CitationDe Beni et al., 2019), but the first attempt to apply UAVs in an on-going lava flow mapping was made on the 2016 lava flow front.
The map represents the 2019 erupted products in the context of the effusive activity from 1999 to 2019. We have distinguished the summit lava flows emitted by the summit craters, and the flank (or lateral) lava flows, generated by eruptive fissures on the flanks of the volcano.
More information regarding the lava flows emplaced from 1999 up to 2019 are available in . The total covered area by lava flows in this time interval is about 80 × 106 m2 with a total volume of about 530 × 106 m3. Lava flows are grouped by eruption years and divided between summit and lateral or flank; it was possible to calculate that in the last 30 years, the amount of volcanics emitted by the summit craters and lateral eruptions is almost the same, but the summit eruptions covered an area almost three-times bigger than the lateral ones.
Table 4. Summary table of the lava flows emplaced from 1999 up to 2019 distinguished into summit and lateral or flank.
Ultimately, the map represents a useful upgrade to the cartography of volcanic products erupted by one of the most active volcanoes in the world, which continuously changes in shape and topographic heights, especially near its summit eruptive vents.
This near-continuous effusive activity is fortunately not always dangerous but offers an extraordinary spectacle for tourists, although the 2001 and 2002–2003 lava flows destroyed tourist facilities at high altitudes on the southern and northern flanks of the volcano, causing a blow to the local economy. The presence of thousands of tourists every year and associated facilities imply that continuous monitoring activity is necessary and a thorough knowledge of the past and recent activity of the volcano is essential for both stakeholders and researchers. A necessary undertaking for both scientific and civil protection purposes, focused on the constant monitoring of a UNESCO World Heritage Site.
Software
DjI GSP was employed to plan the UAV surveys.
Images were elaborated with Agisoft Photoscan® 1.2.3 to apply SfM tecnique.
Leica Geosystem-Exagon 3DReshaper® allowed the alignment of point clouds.
The vector/raster data and main map were managed using Esri ArcGIS ® 10.3.1, with final editing performed using Corel DRAW 2015 ®.
Autodesk Autocad 11® was used to transform the complex polygon into a rectangle to evaluate the average lava flow thickness.
Supplemental Material
Download (121.5 MB)Supplemental Material
Download PDF (15 MB)Acknowledgements
The authors would like to thanks D. Pellegrino and Leica Geosystem Exagon for the trial version of 3DReshaper software.
A special thanks to the reviewers: Mr. John Abraham, Professor Alessandro Tibaldi, Dr. Andrea Ciampalini, that helped us finalize and improve the paper and the map. to Dr. Mike J Smith Editor-in-Chief and to Alessandro Chelli for their support. Moreover, we are grateful to Dr. Fabio Bonali and Dr. Cristina Proietti for the fruitful discussions about reference systems.
Disclosure statement
No potential conflict of interest was reported by the author(s).
Additional information
Funding
Related Research Data
References
- Acocella, V., Neri, N., Behncke, B., Bonforte, A., Del Negro, C., & Ganci, G. (2016). Why does a mature volcano need new vents? The case of the New Southeast Crater at Etna. Frontiers in Earth Science, 4, 1–16. https://doi.org/10.3389/feart.2016.00067
- Albino, F., Biggs, J., Escobar-Wolf, R., Naismith, A., Watson, M., Phillips, J. C., & Chigna Marroquin, G. A. (2020). Using TanDEM-X to measure pyroclastic flow source location, thickness and volume: Application to the 3rd June 2018 eruption of Fuego volcano, Guatemala. Journal of Volcanology and Geothermal Research, 406, 107063. https://doi.org/10.1016/j.jvolgeores.2020.107063
- Allard, P., Behncke, B., D’Amico, S., Neri, M., & Gambino, S. (2006). Mount Etna 1993-2005: Anatomy of an Evolving eruptive Cycle. Earth-Science Reviews, 78(1–2), 85–114. https://doi.org/10.1016/j.earscirev.2006.04.002
- Andronico, D., Branca, S., Calvari, S., Burton, M., Caltabiano, T., Corsaro, R. A., Del Carlo, P., Garfì, G., Lodato, L., Miraglia, L., Murè, F., Neri, M., Pecora, E., Pompilio, M., Salerno, G., & Spampinato, L. (2005). A multi-disciplinary study of the 2002–03 Etna eruption: Insights into a complex plumbing system. Bulletin of Volcanology, 67(4), 314–330. https://doi.org/10.1007/s00445-004-0372-8
- Andronico, D., Di Roberto, A., De Beni, E., Behncke, B., Bertagnini, A., Del Carlo, P., & Pompilio, M. (2018). Pyroclastic density currents at Etna volcano, Italy: The 11 February 2014 case study. Journal of Volcanology and Geothermal Research, 357, 92–105. https://doi.org/10.1016/j.jvolgeores.2018.04.012
- Behncke, B., Branca, S., Corsaro, R. A., De Beni, E., Miraglia, L., & Proietti, C. (2014). The 2011–2012 summit activity of Mount Etna: Birth, growth and products of the new SE crater. Journal of Volcanology and Geothermal Research, 270, 10–21. https://doi.org/10.1016/j.jvolgeores.2013.11.012
- Behncke, B., Fornaciai, A., Neri, M., Favalli, M., Ganci, G., & Mazzarini, F. (2016). LiDAR surveys reveal eruptive volumes and rates at Etna, 2007–2010. Geophysical Research Letters, 43(9), 4270–4278. https://doi.org/10.1002/2016GL068495
- Behncke, B., Neri, M., Pecora, E., & Zanon, V. (2006). The exceptional activity and growth of the Southeast Crater, Mount Etna (Italy), between 1996 and 2001. Bulletin of Volcanology, 69(2), 149–173. https://doi.org/10.1007/s00445-006-0061-x
- Bonforte, A., Guglielmino, F., & Puglisi, G. (2019). Large dyke intrusion and small eruption: The December 24, 2018 Mt. Etna eruption imaged by Sentinel-1 data. Terra Nova 2019, 31, 405–412. https://doi.org/10.1111/ter.12403
- Branca, S., Coltelli, M., Groppelli, G., & Lentini, F. (2011). Geological map of Etna volcano, 1:50,000 scale. It J Geosci, 130(3), 265–291. https://doi.org/10.3301/IJG.2011.15
- Branca, S., Cotelli, M., & Del Carlo, P. (2016). C14 dating of the Milo debris deposit at Etna volcano (Italy): new age constraints for the Valle del Bove formation. Rend. Online Soc. Geol. It., Suppl. n. 1 al Vol. 40.
- Calvari, S., Neri, M., & Pinkerton, H. (2003). Effusion rate estimations during the 1999 summit eruption on Mount Etna, and growth of two distinct lava flow fields. Journal of Volcanology and Geothermal Research, 119(1-4), 107–123. https://doi.org/10.1016/S0377-0273(02)00308-6
- Calvari, S., Tanner, L. H., Groppelli, G., & Norini, G. (2013). Valle Del Bove, eastern flank of Etna volcano: A comprehensive Model for the Opening of the depression and Implications for Future Hazards, In: Mt. Etna: Volcano Laboratory. Geophysical Monograph Series, 143, 65–75. https://doi.org/10.1029/143GM05
- Cannavò, F., Sciotto, M., Cannata, A., & Di Grazia, G. (2019). An Integrated Geophysical approach to Track Magma Intrusion: The 2018 Christmas Eve eruption at Mount Etna. Geophysical Research Letters, 46(14), 8009–8017. https://doi.org/10.1029/2019GL083120
- Cappello, A., Ganci, G., Bilotta, G., Corradino, C., Herault, A., & Del Negro, C. (2019). Changing eruptive styles at the south-east Crater of Mount Etna: Implications for assessing lava flow hazards. Front. Earth Sci, 2019, 7. https://doi.org/10.3389/feart.2019.00213
- Coltelli, M., Proietti, C., Branca, S., Marsella, M., Andronico, D., & Lodato, L. (2007). Analysis of the 2001 lava flow eruption of Mt. Etna from threedimensional mapping. J. Geophys. Res, 112, F02029. https://doi.org/10.1029/2006JF000598
- Corradino, C., Ganci, G., Cappello, A., Bilotta, G., Hérault, A., & Del Negro, C. (2019). Mapping recent lava flows at Mount Etna using multispectral sentinel-2 images and machine learning techniques. Remote Sensing, 11(16), 1–17. https://doi.org/10.3390/rs11161916
- Corsaro, R. A., Andronico, D., Behncke, B., Branca, S., Caltabiano, T., Ciancitto, F., & Miraglia, L. (2017). Monitoring the December 2015 summit eruptions of Mt. Etna (Italy): Implications on eruptive dynamics. Journal of Volcanology and Geothermal Research, 341, 53–69. https://doi.org/10.1016/j.jvolgeores.2017.04.018
- De Beni, E., Behncke, B., Branca, S., Nicolosi, I., Carluccio, R., Caracciolo, F. D., & Chiappini, M. (2015). The Continuing Story of Etna’s New Southeast Crater (2012–2014): evolution and volume Calculations based on field surveys and Aerophotogrammetry. Journal of Volcanology and Geothermal Research, 303, 175–186. https://doi.org/10.1016/j.jvolgeores.2015.07.021
- De Beni, E., Cantarero, M., & Messina, A. (2019). UAVs for volcano monitoring: A new approach applied on an active lava flow on Mt. Etna (Italy), during the 27 February–02 March 2017 eruption. Journal of Volcanology and Geothermal Research, 369, 250–262. https://doi.org/10.1016/j.jvolgeores.2018.12.001
- De Beni, E., & Proietti, C. (2010). Un geodatabase a supporto della mappatura sineruttiva di colate laviche al monte Etna. INGV Rapporti Tecnici, 165, 1–11. (http://istituto.ingv.it/l-ingv/produzione-scientifica/rapporti-tecnici-ngv/archivio/rapporti-tecnici-2010/2010-10-25.5202754525)
- De Novellis, V., Atzori, S., De Luca, C., Manzo, M., Valerio, E., Bonano, M., Cardaci C., Castaldo R., Di Bucci D., Manunta M., Onorato G., Pepe S., Solaro G., Tizzani P., Zinno I., Neri M., Lanari R et al., (2019). DInSAR analysis andanalytical modeling of Mount Etna displacements: The December 2018 volcano-tectonic crisis. Geophysical Research Letters, 46(11), 5817–5827. https://doi.org/10.1029/2019GL082467
- Favalli, M., Fornaciai, A., Mazzarini, F., Harris, A., Neri, M., Behncke, B., Pareschi, M., Tarquini, S., & Boschi, E. (2010). Evolution of an active lava flow field using a multitemporal LIDAR acquisition. Journal of Geophysical Research, 115(B11), 1–17. https://doi.org/10.1029/2010JB007463
- Ganci, G., Bilotta, G., Cappello, A., Hérault, A., & Del Negro, C. (2016). HOTSAT: A multiplatform system for the satellite thermal monitoring of volcanic activity. Geological Society, London, Special Publications, 426(1), 207–221. https://doi.org/10.1144/SP426.21
- Harris, A. J. L., Dehn, J., & Calvari, S. (2007). Lava effusion rate definition and measurement: A review. Bulletin of Volcanology, 70(1), 1–22. https://doi.org/10.1007/s00445-007-0120-y
- Huang, H., Long, J., Yi, W., Yi, Q., Zhang, G., & Lei, B. (2017). A method for using unmanned aerial vehicles for emergency investigation of single geo-hazards and sample applications of this method. Natural Hazards and Earth System Sciences, 17(11), 1961–1979. https://doi.org/10.5194/nhess-17-1961-2017
- Kubanek, J., Richardson, J. A., & Charbonnier, S. J. (2015). Lava flow mapping and volume calculations for the 2012–2013 Tolbachik, Kamchatka, fissure eruption using bistatic TanDEM-X InSAR. Bulletin of Volcanology, 77(12), 1–13. https://doi.org/10.1007/s00445-015-0989-9
- Marchese, F., Neri, M., & Behncke, B. (2020, May 4–8). Main morpho-structural changes and eruptions of Etna in 2016-2019 captured by satellite observations. EGU General Assembly 2020, EGU2020-13909. https://doi.org/10.5194/egusphere-egu2020-13909
- Marchese, F., Neri, M., Falconieri, A., Lacava, T., Mazzeo, G., Pergola, N., & Tramutoli, V. (2018). The contribution of multi-sensor infrared satellite observations in studying well-monitored volcanoes: The case of May-August 2016 Mt. Etna activity. Remote Sensing, 10(12), 1–14. https://doi.org/10.3390/rs10121948
- Montalto, P., De Beni, E., Cassisi, C., Aliotta, M., D’Agostino, M., Mangiagli, S., Prestifilippo, M., & Torrisi, O. (2016). Il GeoDatabase dell'INGV della Sezione di Catania-Osservatorio Etneo: progettazione ed implementazione. INGV Rapporti Tecnici 351, http://istituto.ingv.it/it/le-collane-editoriali-ingv/rapporti-tecnici-ingv/rapporti-tecnici-2016.html)
- Mukherjee, S., Mukherjee, S., & Bhardwaj, A. (2015). Accuracy of Cartosat-1 DEM and its derived attribute at multiple scale representation. Journal of Earth System Science, 124(3), 487–495. https://doi.org/10.1007/s12040-015-0557-x
- Neri, M., Acocella, V., Behncke, B., Giammanco, S., Mazzarini, F., & Rust, D. (2011). Structural analysis of the eruptive fissures at Mount Etna (Italy). Annals of Geophysics, 54(5), 464–679. https://doi.org/10.4401/ag-5332
- Neri, M., De Maio, M., Crepaldi, S., Suozzi, E., Lavy, M., Marchionatti, F., Calvari, S., & Buongiorno, F. (2017). Topographic maps of Mount Etna’s Summit craters, updated to December 2015. Journal of Maps, 13(2), 674–683. https://doi.org/10.1080/17445647.2017.1352041
- Neri, M., Mazzarini, F., Tarquini, S., Bisson, M., Isola, I., Behncke, B., & Pareschi, M. T. (2008). The changing face of Mount Etna's summit area documented with Lidar technology. Geophysical Research Letters, 35(9), L09305. https://doi.org/10.1029/2008GL033740
- Norini, G., De Beni, E., Andronico, D., Polacci, M., Burton, M., & Zucca, F. (2009). The 16 November 2006 flank collapse of the south-east crater at Mount Etna, Italy: Study of the deposit and hazard assessment. Journal of Geophysical Research, 114, B02204. https://doi.org/10.1029/2008JB005779
- Palaseanu-Lovejoy, M., Bisson, M., Spinetti, C., Buongiorno, M. F., Alexandrov, O., & Cecere, T. (2019). High-resolution And accurate topography Reconstruction Of Mount Etna from Pleiades satellite data. Remote Sensing, 11(24), 1–17. https://doi.org/10.3390/rs11242983
- Pedersen, G. B. M., Höskuldsson, A., Dürig, T., Thordarson, T., Jónsdóttir, I., Riishuus, M. S., Óskarsson, B. V., Dumont, S., Magnusson, E., & Gudmundsson, M. T. (2017). Lava field evolution and emplacement dynamics of the 2014–2015 basaltic fissure eruption at Holuhraun, Iceland. Journal of Volcanology and Geothermal Research, 340, 155–169. https://doi.org/10.1016/j.jvolgeores.2017.02.027
- Spampinato, L., Calvari, S., Oppenheimer, C., & Boschi, E. (2011). Volcano surveillance using infrared cameras. Earth-Science Reviews, 106(1-2), 63–91. https://doi.org/10.1016/j.earscirev.2011.01.003
- Vicari, A., Ganci, G., Behncke, B., Cappello, A., Neri, M., & Del Negro, C. (2011). Near-real-time forecasting of lava flow hazards during the 12-13 January 2011 Etna eruption. Geophysical Research Letters, 38(13), 1–7. https://doi.org/10.1029/2011GL047545
- Walker, G. P. L. (1971). Compound and simple lava flows and flood basalts. Bulletin Volcanologique, 35(3), 579–590. https://doi.org/10.1007/BF02596829
- Walker, G. P. L. (1973). Lengths of lava flows. Philosophical Transactions of the Royal Society of London. Series A, Mathematical and Physical Sciences, 274(1238), 107–118. https://doi.org/10.1098/rsta.1973.0030
Appendices
Appendix 1
Sfm technique and GCP positioning
SfM is a computer vision algorithm which allows estimating three-dimensional structures starting from a series of ‘normal’ 2D pictures, typically taken by standard cameras. Briefly, the SfM algorithm identifies a series of key elements, or features, in multiple images. These objects, which could be corners or lines, are tracked through the list of images, allowing an estimation of camera positions and orientations as well as positions of features in 3D space. This process leads to a point cloud, where each element has x,y,z coordinates. This coordinate system is relative, considering that no real-world coordinate has been passed to the algorithm during this step. With the evolution of UAVs, this is no longer truer, considering that all the pictures taken by their cameras are usually labeled with the real GPS position. This information helps the SfM software considerably, which can obtain a more precise point cloud in a short time. Nevertheless, single GPS positions are not enough to obtain a well-georeferenced Digital Elevation Model (DEM, which is derived from the point cloud). This is due to (i) the positioning error affecting the UAV GPS coordinates and (ii) the final DEM error due to unavoidable deformations introduced during processing (CitationDe Beni et al., 2019). Considering that both DEMs and orthophotos are used to perform measurements and provide metric results, the accuracy is a critical issue. In an aerial mapping survey, a number of ground control points (GCPs) are placed on the ground and their coordinates are locally estimated using very high precision GPS devices. A GCP typically looks like a checkerboard and its size must be suitable to recognize it in the aerial images. Placing GCPs on the ground is time consuming and, especially on an active volcano, can be tricky and dangerous. However, a number of them, between 3 and 5 or even more in the case of particularly rough terrain, is necessary to obtain a well-georeferenced model, fundamental for volcanic monitoring.
Appendix 2
The 30 May – 6 June 2019 eruption of Mt. Etna
In recent decades, Etna has shown a progressive increase in eruptive activity that has mainly affected its summit area, which has been profoundly, transformed both morphologically and structurally (Citation2016). From 1971 to 2007, the subterminal Southeast Crater (SEC) developed between 3000 and 3200 meters (CitationBehncke et al., 2006, Citation2016; Citation2010). Since 2011, on the south-eastern flank of the SEC, a further imposing pyroclastic cone named New Southeast Crater has started to grow; its feed axis shifted about 300 m to the SE with respect to the SEC (CitationBehncke et al., 2014; CitationCorsaro et al., 2017; CitationDe Beni et al., 2015; Neri et al., Citation2008, Citation2017; Vicari et al., Citation2011).
The Central Crater and the Northeast Crater, have undergone striking morpho-structural transformations, alternating hundreds of meters subsidence, intra-crateric strombolian activity, lava fountaining and the growth of pyroclastic cones, sometimes active continuously for many months (CitationAllard et al., 2006; CitationCorsaro et al., 2017; Marchese et al., Citation2018; Neri et al., Citation2008, Citation2017).
In this extremely active panorama, the spring-summer of 2019 was marked by some brief but intense subterminal eruptions, which occurred from short fissures opened up along the flanks and at the base of the NSEC (Marchese et al., Citation2020). These eruptions formed some lava flows distributed on the east and south sides of the volcano, which lasted too little time (from a few hours to a few days) to reach urbanized areas. The peculiarity of these events is that the eruptions very often occurred almost from the same mouths, thus producing lava fields that overlapped each other. It is therefore crucial to quickly map the erupted products before a new eruption can obliterate them under new lava flows. In addition, some eruptions occur in areas that are difficult to reach on foot, so it is necessary to map the emitted products with remote systems.
Chronology of the eruption
At 01:20 UTC on May 30, 2019, a SW-NE eruptive fissure about 300 meters long opened at the northern base of the New Southeast Crater (NSEC), about 3150 meters above sea level. From the lower portion of the fissure, a mild Strombolian activity occurred and a lava flow began to flow and spread towards ESE.
At 03:35 UTC, at the base of the south-eastern flank of the NSEC itself, a new NNW-SSE eruptive fissure opened, slightly longer than the previous one (about 500 meters), consisting of two segments (respectively 3050–3000 m 2900–2850 m a.s.l.). On the whole, these fissures showed Strombolian activity in the apical and median portions, while the effusive activity was concentrated in two emission points located in the median portion and then in the lower one, forming two lava flows that combined to form a single flow.
Simultaneously with the formation of the eruptive fissure systems, a dense ash column erupted from a vent located on the top of the NSEC, which lasted until the afternoon of May 30th. The northern lava flow expanded towards the north wall of the Valle del Bove and then curved towards the east, reaching, on May 31, a maximum distance of almost 3 kilometres. In the first days of June, this lava flow was no longer fed.
The southern lava flow was more fueled than the northern one and emerged from a crack in the ground parallel to the apical portion of the December 2018 eruptive fissures (Citation2019). This flow expanded south-east along the western wall of the Valle del Bove, partially covering the flows of 2018. After having circumvented Serra Giannicola Piccola, in the early hours of May 31, the lava reached, the bottom of the valley, with advancing fronts at about 1700m a.s.l. On that day, its total length was about 3 km.
On 5 June 2019, the lava flow from the vent at an altitude of 2850 m a.s.l. was in sharp decline and remained active only near the vent itself. Overall, the lava field was now cooling, without any capacity to advance. Between June 5 and 6 the eruption ended.
The eruption was preceded a few weeks before by seismic events of a maximum magnitude of Ml = 3.2 (April 27, 2019, generated by the Pernicana Fault System, northeastern flank of the volcano). On May 29, a few hours before the onset of the eruption, an Ml = 2.8 earthquake occurred with an epicentre located in the Zafferana Etnea area on the eastern flank of Etna.