
ABSTRACT
Geologic maps are foundational products for natural hazard assessments but developing them for submarine areas is challenging due to a lack of physical access to the study area. In response, submarine geomorphologic maps are used to provide geologic context and spatial information on landforms and related geo-hazards for risk management. These maps are generated from remotely sensed data, e.g. digital elevation models (DEMs), which introduce unique hurdles to submarine mapping. To address this issue, we produced a workflow for applying planetary geologic mapping methods to submarine data. Using this, we created an onshore-offshore geomorphologic map of the Christiana-Santorini-Kolumbo Volcanic Group, Greece. This product can be used to enhance hazard assessments on Santorini, which is a tourist hot-spot at high risk for volcanically- and seismically-induced hazards. We present this workflow as a tool for generating uniform geomorphologic map products that will aid natural hazard assessments of submarine environments.
1. Introduction
Maps are foundational tools for presenting research, communicating science, directing policy, and educating the public. Geologic maps typically display the spatial distribution, lithology (i.e. composition, grain size, and bedding attributes), and age relationships of rock units and structural features (i.e. folds, faults, and joints). To address natural hazards, geologic maps can also identify past deposits, landforms, and events (e.g. earthquake locations, landslide headscarps) and areas at risk for future events (e.g. volcanic vents, fault zones). Hazard maps made from a geologic map display deposits and landforms distinctly associated with certain hazards and identify areas of low, moderate, and high risk to public safety. Ultimately, geologic maps place natural hazards in spatial and geologic context and are essential for hazard assessments.
Mapping of areas that were previously limited by size, accessibility, nature preserves, and water cover are now being actively surveyed and characterized through advancements in remote sensing (Smith & Pain, Citation2009). Specifically, seafloor mapping technologies facilitate the visualization and examination of submarine environments (Baggeroer, Citation2001), and technological growth in this area has enhanced assessment of submarine hazards and risks. However, the inability to physically traverse the seafloor to identify widespread lithologies limits the development of classic, lithology-based geologic maps, which are typically used to contextualize hazards and communicate risk.
In response, the submarine community typically prioritizes geomorphologic maps as a tool to aid characterization of submarine geology and natural hazards. Geomorphologic maps describe and classify landforms based on (1) landform morphometry, morphography, and hydrography, (2) lithology, structure, and sedimentology, and (3) geologic age and formation/alteration processes (e.g. Gustavsson et al., Citation2006). In a submarine environment, investigations use remotely sensed bathymetry data to spatially contextualize scientific results within the constraints of seafloor accessibility. Therefore, submarine geomorphologic maps use seafloor relief and local sampling methods to inform underlying lithology, sedimentology, dynamic surface processes, geologic history of the area, and related submarine hazards.
Submarine geomorphologic maps have inherent limitations in the information they convey due to the primary use of remotely sensed data and incorporation of spatially constrained geologic characteristics (i.e. lithology, sedimentology, structure). Submarine remote sensing products include multibeam swath bathymetry, side-scan sonar, seismic reflection surveys, and remotely operated vehicle (ROV) imagery (Micallef, Citation2011). Consequently, the following factors challenge submarine geomorphologic map production:
data types, coverages, and resolutions limit the characterization of landforms;
seafloor geologic data are often constrained to points, lines, and surface extrapolations from seafloor sampling methods such as drilling, geophysical surveys, and ROV surveys, respectively; and
field, submarine, and planetary geologists use conflicting vocabulary (‘Geologic’ versus ‘Geomorphologic’) to label these maps.
As a result, ‘the large majority of marine geomorphologic maps are thematic and interpretational rather than holistic, scientific maps’ (Micallef, Citation2011). As such, these maps often lack a standardized mapping, representation, and terminology of features and units, causing inadequate or inconsistent classification of submarine lithology, morphometry, and unit definitions (Micallef, Citation2011) This results in submarine products that are generally less detailed than continental (or onshore) maps of similar scale (Micallef, Citation2011). To address these challenges, we developed a uniform process for producing submarine geomorphologic maps that is informed by processes developed over the past 50 years by the planetary geologic mapping community.
Planetary geologists have been refining their techniques for geologic mapping using remotely sensed data since the era of the Apollo missions that sent humans to the Moon (Schmitt et al., Citation1967). This resulted in improved knowledge of multiple study sites beyond Earth, such as the Global Geologic Map of Mars (Tanaka et al., Citation2014), geologic quadrangle maps of Mercury (e.g. Wright et al., Citation2019), and refinement of the Apollo 11 landing site geology and lunar chronology (Iqbal et al., Citation2019). In support of the planetary geologic mapping community, the United States Geological Survey (USGS) Planetary Geologic Map Coordination Group has documented the previously unpublished methodology for producing geologic maps of planetary surfaces (Skinner et al., Citationin press). Here, we adapt this planetary mapping methodology for onshore and offshore data of the Christiana-Santorini-Kolumbo Volcanic Group (CSK VG), Greece, to demonstrate the use of standardized geomorphologic map generation in submarine environments for future hazard assessments ().
Figure 1. Colored shaded-relief image of the South Aegean Sea from mosaicked digital elevation models (DEMs) of onshore Advanced Spaceborne Thermal Emission and Reflection Radiometer (ASTER) data (30 m/pixel) and offshore European Marine Observation and Data network (EMODnet) data (107 meters/pixel); artificially illuminated from the northwest. Box represents map area; red triangles offset from centers of the Hellenic Volcanic Arc. Sawteeth on hanging wall of reverse fault; hachures point downslope.
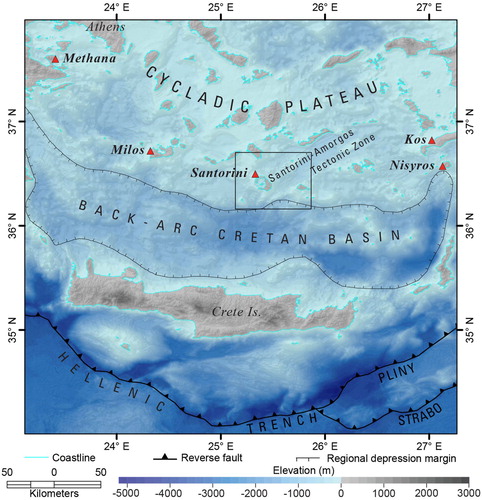
The CSK VG and surrounding Aegean islands are at high risk for volcanically- and seismically-induced hazards, including earthquakes, volcanic eruptions, tsunami, and landslides. In 1650, the submarine volcano Kolumbo exploded and breached the sea surface, sending tsunami and pyroclastic flows toward neighboring islands, including Santorini (CitationNomikou, Carey et al., 2014; Ulvrova et al., Citation2016). In 1956, Santorini was devastated by a 7.5 Mw earthquake sourced from a submarine fault near Amorgos Island (northeast of Santorini) (Brüstle et al., Citation2014; Nomikou et al., Citation2018; Okal et al., Citation2009). This earthquake was the largest of the century for Santorini, but every year the CSK VG experiences multiple low magnitude earthquakes sourced from nearby faults that crisscross the seafloor. In 2011-2012, Santorini experienced a 14-month period of volcanic unrest during which the seafloor rose in the northern part of the caldera from magmatic inflation (Papoutsis et al., Citation2013; Parks et al., Citation2012), submarine fumarole chemistry and sea temperatures changed dramatically (Tassi et al., Citation2013), and more than 50 low magnitude earthquakes per day were recorded (Feuillet, Citation2013; Papadimitriou et al., Citation2015). Volcanologists believed an eruption was imminent, though the activity ceased without any explosions or new lava flows (Parks et al., Citation2015). These events demonstrate some of the geo-hazards present at Santorini, which receives roughly 2 million visitors annually.
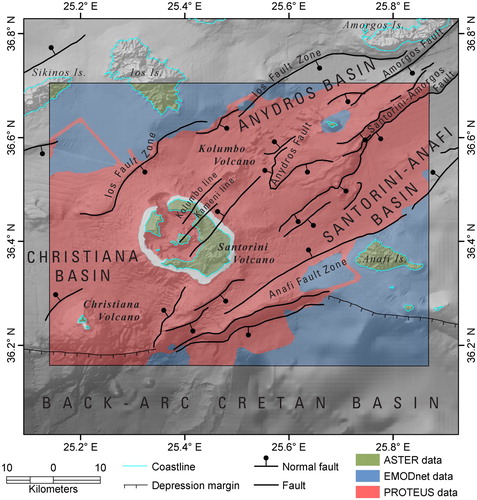
In response, submarine investigations and data collection campaigns have been conducted to understand the CSK VG seafloor which is characterized by numerous active faults and volcanic mounts (). These include numerous high-resolution multibeam bathymetric surveys (Hooft et al., Citation2017; Nomikou et al., Citation2012, Citation2013), explorations using ROVs (Camilli et al., Citation2015; Carey et al., Citation2013; Kilias et al., Citation2013), and multichannel seismic surveys (Hübscher et al., Citation2015; Johnston et al., Citation2015; Nomikou et al., Citation2016, Citation2018). The plethora of geo-hazards and submarine data motivated our compilation of the onshore-offshore geomorphologic map of the CSK VG to provide geologic context for volcanic, seismic, and mass-wasting activity and aid risk assessments for hazard mitigation.
Figure 2. Shaded-relief image of the Christiana-Santorini-Kolumbo Volcanic Group and surrounding geographic features from mosaicked ASTER and EMODnet DEMs; artificially illuminated from the northwest. Box represents map area; colors represent data coverage: onshore ASTER data (30 m/pixel), offshore EMODnet data (107 m/pixel), and offshore ‘Plumbing Reservoirs Of The Earth Under Santorini’ (PROTEUS) data (20 m/pixel) merged with swath data from previous surveys (Hooft et al., Citation2017; Nomikou et al., Citation2012, Citation2013; Nomikou et al., Citation2014); white areas undefined due to missing data which is typical in the foreshore (intertidal) region. Faults adapted from CitationHooft et al. (Citation2017); ball and bar on hanging wall.
2. Geographic setting
The CSK VG includes a southwest-northeast linear chain of three volcanic centers: Christiana Volcano and associated submarine cones, Santorini Volcano and its intracaldera Kameni Volcano, and submarine Kolumbo Volcano including the associated chain of 25 submarine cones (Main Map, ) (Nomikou et al., Citation2012, Citation2019). The CSK VG lies in a 100-km-long, 45-km-wide zone of en echelon NE-SW-trending rifts, including the Santorini-Amorgos Tectonic Zone () (Nomikou et al., Citation2018). Christiana Volcano and the Akrotiri peninsula volcanism of Santorini Volcano occur along a NE-SW-trending fault line (Kokkalas & Aydin, Citation2013). This fault is parallel to both the Kameni Line that hosts Kameni Volcano and the Kolumbo Line that hosts ancient Santorini volcanism and Kolumbo Volcano (Hübscher et al., Citation2015; Pyle & Elliott, Citation2006). The spatial coincidence of magmatism and NE-SW faulting suggests fault-controlled magma ascent for the CSK VG (Hübscher et al., Citation2015; Kokkalas & Aydin, Citation2013; Pyle & Elliott, Citation2006). The Geologic History of the CSK VG is presented on the Main Map; published geology is presented in the Correlated Geology column of the Description of Map Units (DOMU) (Main Map).
3. Methods and data
We used planetary geologic mapping methods in a submarine environment to map the seafloor surrounding the CSK VG and ESRI's ArcGIS software to visualize our selected data in a digital Geographic Information System (GIS). To create our map product, we used a single basemap for digital scale-based mapping, applied standardized symbology, and produced consistent map components following updated USGS guidelines (Skinner et al., Citationin press; U.S. Geological Survey National Cooperative Geologic Mapping Program (USGS NCGMP), Citation2020).
For full coverage of the terrestrial (onshore) and submarine (offshore) area of interest, we generated a 3940 km2 area basemap centered on the CSK VG (∼20–107 m/pix; ). We first mosaicked three different digital elevation models (DEMs) to achieve full coverage of the area, and then applied an artificial hillshading model in ArcGIS to facilitate geomorphic mapping.
We prioritized higher resolution data in areas of overlap, therefore, the scale of the hillshade basemap is spatially variable and locally matches the top-level DEM:
High-resolution swath bathymetry DEM from the NSF project ‘Plumbing Reservoirs Of The Earth Under Santorini’ (PROTEUS) data acquired by the research vessel (R/V) Marcus G. Langseth (20 m/pix; Hooft et al., Citation2017) merged with swath data from previous surveys (Nomikou et al., Citation2012, Citation2013; CitationNomikou, Parks, et al., 2014).
Community-sourced DEM from European Marine Observation and Data network (EMODnet) data (107 meters/pixel; EMODnet Bathymetry Consortium, Citation2018).
Satellite-based DEM from Advanced Spaceborne Thermal Emission and Reflection Radiometer (ASTER) data (30 meters/pixel; NASA/METI/AIST/Japan Spacesystems, and U.S./Japan ASTER Science Team, Citation2019).
We conducted scale-based mapping at a set fraction of the publication scale to produce consistent and accurate representations of the geology of the study area. We defined the map publication scale at 1:100,000 based on the desired print document size (A0, 841×1189 mm), available data coverage (extent of the PROTEUS dataset), and scientific goals of the project (characterize the seafloor of the CSK VG). Scale-based mapping was performed at a digitization scale of 1:25,000, which is ¼ of the publication scale. All map features and units were identified, delineated, and described at this digitization scale using the single hillshade basemap to maintain consistency and fidelity of mapping across the study area while staying true to the level of geologic detail that can be gleaned from the data.
We assembled the onshore-offshore geomorphologic map by first delineating linear features and classifying them in the Explanation of Map Symbols (EOMS). We then identified map units based on qualitative morphologic and topographic landforms and hand-traced contacts (i.e. boundaries) between them; onshore contacts for Santorini were adapted from CitationDruitt et al. (Citation1999). The ‘Unit Definition’ category of the DOMU differentiates our map units by their morphology and defining characteristics such as general landform descriptions, onshore and offshore distinctions, unique morphometry and linear features, contact nature, and general location. These were listed in the same order for each unit, as applicable, and allowed us to define map units solely on what is directly observable in the basemap data. For each unit, we then incorporated ‘Correlated Geology’ from published studies: onshore (terrestrial) geology from published maps (Bornovas, Citation1983; Druitt et al., Citation1999), offshore (submarine) units from morphologic mapping (Hooft et al., Citation2017; CitationNomikou, Parks, et al., 2014), and interpretation of several geophysical surveys detailed in the following section. The final DOMU category, ‘Interpretation’, states geologic and geomorphic formation and modification processes that directly follow from the Unit Definition observations and Correlated Geology information. Using cross-cutting relationships and published absolute age-dating, we oriented the map units in time for the Correlation of Map Units (COMU). We applied minimum map thresholds at 0.04 km2 (or 4 mm2 print) for unit polygons and 0.3 km (or 3 mm print) for linear features.
To maximize the scientific use and cross-comparability of our map with other investigations, we applied the standard color, size, and symbology to all lines and text on the Main Map per the Federal Geographic Data Committee (FGDC) ‘Digital Cartographic Standard for Geologic Map Symbolization’ (Federal Geographic Data Committee, Citation2006). We also compiled map components (Map Sheet, EOMS, DOMU, COMU, Methods/Data, GIS metadata) following USGS guidelines (Skinner et al., Citationin press; USGS NCGMP, Citation2020).
4. Results
We produced Main Map which contains the geomorphologic map, EOMS, DOMU, COMU, and a brief Geologic History. The geomorphologic map presents linear features, contacts, units, unit labels, elevation contours, and nomenclature (geographic locations). Linear features in the EOMS encompass faults, normal and regional faults, scarp crests and bases, terraces, caldera margins, ridge and ripple crests, channels, grooves, troughs, lineaments, and depression margins. The EOMS also documents the type of contacts used to separate map units based on the degree of confidence in boundary existence and location accuracy: certain, approximate, and queried. Geomorphologic map units were generally colored following similar published units within the Geological Map of Santorini Islands (Druitt et al., Citation1999) and Geological Map of Greece (Bornovas, Citation1983; Papanikolaou, Citation2015). We mapped 11 geomorphologic units that are grouped based on the region in which they occur:
Christiana Volcano Units: Christiana volcanic unit (Cv)
Santorini Volcano Units: Santorini volcanic-undivided unit (Svu), Late-Bronze-Age pyroclastic unit (Slp), and Kameni volcanic unit (Skv)
Kolumbo Volcano Units: Kolumbo cone unit (Kc) and Kolumbo volcanic unit (Kv)
Widely Occurring Units: Basement promontory-undivided unit (bpu), Basin infill unit (bi), Terra 1 unit (t1), Terra 2 unit (t2), and Surface deposit unit (sd)
We visually verified our contacts with the boundaries between units exposed at the surface of 30 seismic profiles from 7 geophysical studies (Bell et al., Citation2013; Hübscher et al., Citation2015; Johnston et al., Citation2015; Nomikou et al., Citation2013; Nomikou, Carey, et al., Citation2014; Nomikou, Hübscher, et al., Citation2016; Nomikou, Druitt, et al., Citation2016). Our contacts frequently matched those from the geophysical studies. Variances occurred where morphology was ambiguous, such as the subtle slope change from unit Svu to unit sd along the submarine caldera wall of Santorini; contact locations were updated accordingly. The seismic interpretations also allowed us to refine unit assignments for outcrops with overlapping morphologies, such as unit bpu versus unit Kv along the Kolumbo Line. There was a discrepancy with unit bi as no difference was interpreted in the seismic profiles for the unit t2 and unit bi areas we mapped in Santorini-Anafi and Anydros Basins. We acknowledge in the DOMU that lithology is uniform across both units and maintain our mapping in order to distinguish the stratigraphic relation of unit t2 channelization being older than or transgressive with unit bi deposition.
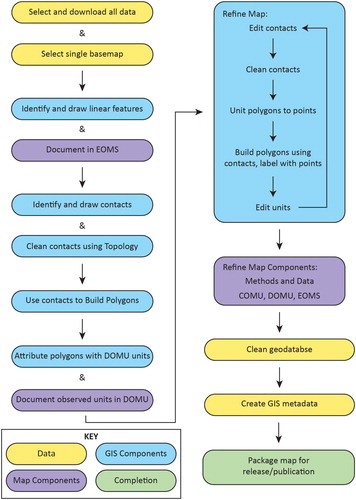
We present steps for producing a submarine geomorphologic map in , which is a result of our iterative investigation to standardize a workflow for mapping submarine remotely sensed data. Terms used within the workflow align with ESRI ArcGIS but can be extrapolated to other GIS platforms as well. A file geodatabase houses feature classes, which include points for location features, lines for linear features and contacts, polygons for units, and annotations for unit labels and geographic feature labels. Topology uses different rules to identify the spatial relationships of adjacent features and must be used to clean contact lines for polygon generation. Common topology rules include ‘must not overlap’, ‘must not intersect’, ‘must not self-overlap’, ‘must not self-intersect’, and ‘must not have dangles’. For details on individual steps or compiling map components, we direct readers to the Planetary Geologic Mapping Protocol (Skinner et al., Citationin press) and GeMS (USGS NCGMP, Citation2020). For more information on GIS metadata, we direct readers to the USGS's website on formal, FGDC-compliant metadata (https://geology.usgs.gov/tools/metadata/).
Figure 3. Workflow for creating a geomorphologic map. ESRI ArcGIS terms used for GIS components; map components adapted from USGS guidelines (Skinner et al., Citationin press; USGS NCGMP, Citation2020).
5. Discussion
In this study, we use planetary geologic mapping methods to interpret remotely sensed submarine data and create a geomorphologic map of the seafloor in the CSK VG region. This methodology is presented as a tool that can be used to address three known challenges in submarine geomorphologic mapping, namely data limitations, spatially constrained geology, and conflicting terminology, as outlined below.
5.1. Data limitations: use a hillshade basemap that prioritizes data resolution and coverage suitable for science
We used a single hillshade basemap with resolution and coverage suitable for the scientific scope of our project. Though there are multiple types of submarine remotely sensed data available (e.g. multibeam bathymetry, side-scan sonar, seismic reflection surveys, ROV imaging), DEMs derived from these datasets are currently the predominant data product for spatially visualizing and interpreting the seafloor using GIS (Micallef, Citation2011). In contrast, a variety of spatial data sets exist for terrestrial mapping investigations (e.g. visual, multispectral, and hyperspectral imagery, radar, and light detection and ranging (LiDAR)) (Smith & Pain, Citation2009). Therefore, selecting DEM datasets for both onshore and offshore environments ensures consistent mapping across the study area.
High-resolution seafloor DEM data are not widely available and, as such, geomorphologic mapping of the seafloor can still be limited by data coverage and quality issues. In our study, PROTEUS data (20 m/pix) had an irregular footprint over EMODnet data (107 m/pix) and lacked the onshore island coverage that ASTER data provided (30 m/pix) (); the PROTEUS and EMODnet data resolutions were ideal for offshore and onshore geomorphology characterization, respectively. Therefore, we mosaicked the three DEMs together and prioritized higher resolution data in areas of overlap. This resulted in a DEM-derived hillshade basemap with a non-uniform resolution and areas that show some digital artifacts. However, the basemap has full coverage of the study area and local resolution sufficient for characterization of the CSK VG.
5.2. Spatially constrained geology: enhance DOMU with Correlated geologic data
Geomorphologic mapping should leverage available geologic data when constructing offshore maps. For instance, the submarine community has a long history of using the interpretation of seismic profiles, ROV surveys, and drill campaigns to classify seafloor geology; all of which provide useful lithologic, sedimentary, and structural information to inform broader geomorphic mapping of an area. However, a challenge emerges with respect to resolving datasets of disparate scales (e.g. subsurface geology along a 15 km line versus surface morphology of 1000+ km2 area) in a single, two-dimensional map product. We solved this by using three categories to describe each unit in the DOMU: ‘Unit Definition’ to encompass observable morphology in the hillshade basemap, ‘Correlated Geology’ to document published geology, and ‘Interpretation’ to describe the possible formation and modification processes. The intersection of broad geomorphology with localized geology per unit allows geologic information to be systematically documented and used to inform broader geomorphic mapping and interpretations. This DOMU presentation allows for the preservation of detailed geologic knowledge for an area, while simultaneously presenting a product that is spatially consistent and uniform to maximize natural hazard assessments.
5.3. Terminology: a geomorphologic map with geologic data to broaden scientific return
Production of this map bridges practices that field, submarine, and planetary geologists and geomorphologists apply to terrestrial, submarine, and extraterrestrial settings. We note that use of the terms ‘Geologic’ and ‘Geomorphologic’ map differs depending on the discipline (e.g. bedrock geology vs. tectonic geomorphology vs. submarine/coastal geomorphology). Here, we consider discipline-specific arguments and use an Earth-based case to explain our mapping approach as broadly geomorphologic, yet informed by critical geologic data to enhance map utility.
Geologic maps represent the distribution, nature, and age relationships of rock units as defined by lithology and stratigraphic position (Jackson, Citation1997). Several of these aspects can be obscured in submarine environments, either by limited capabilities and resolution of remotely sensed data, or by presence of overlying sediment deposits and/or marine macroalgae and protist communities. Seafloor lithology can be identified at points of drill core locations, along lines of seismic profiles, or in areas of ROV exploration, but it cannot usually be established for an entire map area. Thus, geologic mapping in the traditional sense is logistically limited by these constraints. However, our map product presents ‘Correlated Geology’ in the DOMU, which provides geologic information for each map unit, where possible. This, combined with the COMU, provides distribution, nature, and age relationships of the map units and corresponds to what is expected for a ‘Geologic Map’.
In contrast, traditional geomorphologic maps convey surface forms, a description of materials, and related interpretations or evidence of formative processes (Lee, Citation2001). Our map was created by identifying different landforms on the seafloor as unit polygons or linear features in the GIS. In the DOMU, the Unit Definitions list morphologic attributes and the Interpretations list the possible evidence-based processes that formed and modified each unit. Descriptions of materials are covered in both the Unit Definition and Correlated Geology columns. As such, our methods of drafting and producing our map are consistent with a ‘Geomorphologic Map’.
Both planetary and submarine exploration are predominantly limited to remotely sensed data. Planetary maps are generally termed ‘Geologic’, despite planetary geologists’ common inability to confirm areal lithology or stratigraphy. In some instances, local information can be known from in situ observations by planetary landers and rovers, although it can be a challenge to extrapolate that information over a map area. As we compiled our map and accompanying information following planetary geologic mapping protocols, it can also be argued that our method is consistent with what is required to produce a ‘Geologic Map’.
Given we documented observable submarine landforms and provided interpretations of their formational and modificationional processes (as possible), we prefer to present our map as a ‘Geomorphologic Map’. We integrated important geologic information to refine those units and interpretations, which magnifies the map's scientific relevance to geo-hazards, but our product is rooted in the geomorphologic nature of the study area. This term does not affect the efficacy of our map product for future scientific investigation. Rather, by including interpretations of broader, and in some cases more contemporary, geologic and geomorphologic processes, we cultivated a product that provides greater utility than a traditional geologic map.
6. Conclusion and future work
The methods and philosophies discussed above, which were used to produce our 1:100,000-scale map of the CSK VG region, satisfy the need for a uniform process to alleviate challenges in submarine geomorphologic mapping. Community adoption of the process and solutions described herein would allow for a suite of maps that have an equal set of map components, a common GIS drafting methodology, and a standard presentation of submarine geomorphology. This consistency will ensure data integrity of submarine geomorphologic maps, enhance future scientific research, and improve geo-hazards identification and interpretation. This methodology can be used as a tool to develop a suite of map products that are intuitive, standard, and comparable regardless of personnel, themes, locations, or scales.
Geomorphologic maps produced from our workflow will increase the viability of hazard identification and assessment for submarine areas that have little to no seismic surveys and/or drill cores. These products will balance interpretation of landforms with established geology to best present holistic science of an area. Preliminary geomorphologic mapping using this standardized approach can also potentially reduce the cost of proposed research campaigns by spatially organizing priorities for seismic lines and drill location. Additionally, submarine geomorphologic maps are invaluable tools for educating the public and management agencies on submarine risks that are not readily visible to the naked eye.
The geomorphologic map of the CSK VG will provide context for future geophysical campaign proposals and will be an outreach tool for educating the public on the unseen activity of the volcanoes and faults below the ocean surface. We plan to apply this map to natural hazard assessments for Santorini, including classifying risks based upon distance from volcanic vents and earthquake epicenters, combining submarine event probabilities with distal onshore risk zones, and intersecting potential onshore impact zones with prepared disaster responses.
Software
ESRI's ArcGIS software was used to display the data sets referenced herein and to create and edit the GIS map data. Within ArcMap, linear features and contacts were hand-drawn first using a Microsoft Surface Pro 3 and then a Wacom Cintiq Pro drawing screen. All figures and the main map were drafted in Adobe Illustrator 2020. Text documents were drafted in Microsoft 365 Word.
Supplemental Material
Download PDF (31.9 MB)Acknowledgements
Multi-beam data collection on the R/V Marcus Langseth was supported by the National Science Foundation (OCE-1459794). This study was supported by a Fulbright U.S. Student Program Research Award and was primarily conducted through affiliation with the Fulbright Greece and the National and Kapodistrian University of Athens, Department of Geology and Geoenvironment; United States institution affiliation was with Northern Arizona University.
Disclosure statement
No potential competing interest was reported by the authors.
Data availability
The authors confirm that the GIS data generated by this study are available within the article [and/or] its supplementary materials.
The digital elevation model (DEM) data that support the findings of this study are openly available. The EMODnet and PROTEUS data that support the findings of this study are openly available in the EMODnet Bathymetry portal at https://portal.emodnet-bathymetry.eu. Data are hosted by the CitationEMODnet Bathymetry Consortium (Citation2018), at http://doi.org/10.12770/18ff0d48-b203-4a65-94a9-5fd8b0ec35f6.
The ASTER data that support the findings of this study are openly available in the NASA Earth Data Search at https://search.earthdata.nasa.gov/search. Data are hosted by the NASA EOSDIS Land Processes DAAC, at https://doi.org/10.5067/ASTER/ASTGTM.003.
Additional information
Funding
References
- Baggeroer, A. B. (2001). Encyclopedia of ocean Sciences. Encyclopedia of Ocean Sciences, 504–512. https://doi.org/10.1016/B978-012374473-9.00317-9
- Bell, K. L. C., Carey, S. N., Nomikou, P., Sigurdsson, H., & Sakellariou, D. (2013). Submarine evidence of a debris avalanche deposit on the eastern slope of Santorini volcano, Greece. Tectonophysics, 597–598, 147–160. https://doi.org/10.1016/j.tecto.2012.05.006
- Bornovas, J. (1983). Geological Map of Greece. Institute of Geology and Mineral Exploration: Division of General Geology and Economic Geology, scale 1:500,000.
- Brüstle, A., Friederich, W., Meier, T., & Gross, C. (2014). Focal mechanism and depth of the 1956 Amorgos twin earthquakes from waveform matching of analogue seismograms. Solid Earth, 5(2), 1027–1044. https://doi.org/10.5194/se-5-1027-2014
- Camilli, R., Nomikou, P., Escartín, J., Ridao, P., Mallios, A., Kilias, S. P., & Argyraki, A. (2015). The Kallisti Limnes, carbon dioxide-accumulating subsea pools. Scientific Reports, 5(1), 12152. https://doi.org/10.1038/srep12152
- Carey, S., Nomikou, P., Croff-Bell, K., Lilley, M., Lupton, J., Roman, C., Stathopoulou, E., Bejelou, K., & Ballard, R. (2013). CO2 degassing from hydrothermal vents at Kolumbo submarine volcano, Greece, and the accumulation of acidic crater water. Geology, 41(9), 1035–1038. https://doi.org/10.1130/G34286.1
- Druitt, T. H. (2014). New insights into the initiation and venting of the Bronze-Age eruption of Santorini (Greece), from component analysis. Bulletin of Volcanology, 76(2), 794. https://doi.org/10.1007/s00445-014-0794-x
- Druitt, T. H., Edwards, L., Mellors, R. M., Pyle, D. M., Sparks, R. S. J., Lanphere, M., Davies, M., & Barreirio, B. (1999). Santorini Volcano. Geological Society, Memoir 19, 165 p.
- EMODnet Bathymetry Consortium. (2018). EMODnet digital bathymetry (DTM). https://doi.org/10.12770/18ff0d48-b203-4a65-94a9-5fd8b0ec35f6
- Federal Geographic Data Committee. (2006). Digital cartographic standard for geologic map symbolization. U.S. Geological Survey: FGDC Document Number FGDC-STD-013-2006.
- Feuillet, N. (2013). The 2011-2012 unrest at Santorini rift: Stress interaction between active faulting and volcanism. Geophysical Research Letters, 40(14), 3532–3537. https://doi.org/10.1002/grl.50516
- Flaherty, T., Druitt, T. H., Tuffen, H., Higgins, M. D., Costa, F., & Cadoux, A. (2018). Multiple timescale constraints for high-flux magma chamber assembly prior to the Late Bronze Age eruption of Santorini (Greece). Contributions to Mineralogy and Petrology, 173(9), 75. p. https://doi.org/10.1007/s00410-018-1490-1
- Fouqué, F. (1879). Santorin et ses eruptions. Masson, Paris. Santorini and its eruptions. [Translated and annotated by A.R. McBirney]. Johns Hopkins University, Press . (Original work published 1998)
- Gustavsson, M., Kolstrup, E., & Seijmonsbergen, A. C. (2006). A new symbol-and-GIS based detailed morphological mapping system: Renewal of a scientific discipline for understanding landscape development. Geomorphology, 77(1-2), 90–111. https://doi.org/10.1016/j.geomorph.2006.01.026
- Heiken, G., & McCoy, F. (1984). Caldera development during the Minoan eruption, Thira, Cyclades, Greece. Journal of Geophysical Research, 89(B10), 8441. https://doi.org/10.1029/JB089iB10p08441
- Hooft, E. E. E., Nomikou, P., Toomey, D. R., Lampridou, D., Getz, C., Christopoulou, M., O’Hara, D., Arnoux, G. M., Bodmer, M., Gray, M., Heath, B. A., & VanderBeek, B. P. (2017). Backarc tectonism, volcanism, and mass wasting shape seafloor morphology in the Santorini-Christiana-Amorgos region of the Hellenic Volcanic Arc. Tectonophysics, 712-713, 396–414. https://doi.org/10.1016/j.tecto.2017.06.005
- Hübscher, C., Ruhnau, M., & Nomikou, P. (2015). Volcano-tectonic evolution of the polygenetic Kolumbo submarine volcano/Santorini (Aegean Sea). Journal of Volcanology and Geothermal Research, 291, 101–111. https://doi.org/10.1016/j.jvolgeores.2014.12.020
- Iqbal, W., Hiesinger, H., & van der Bogert, C. H. (2019). Geological mapping and chronology of lunar landing sites: Apollo 11. Icarus, 333, 528–547. https://doi.org/10.1016/j.icarus.2019.06.020
- Jackson, J. A. (1997). Glossary of geology. 4th ed. American Geological Institute, Alexandria. 769 p.
- Johnston, E. N., Sparks, R. S. J., Nomikou, P., Livanos, I., Carey, S., Phillips, J. C., & Sigurdsson, H. (2015). Stratigraphic relations of Santorini’s intracaldera fill and implications for the rate of post-caldera volcanism. Journal of the Geological Society, 172(3), 323–335. https://doi.org/10.1144/jgs2013-114
- Jolivet, L., Faccena, C., Huet, B., Labrousse, L., Le Pourhiet, L., Lacombe, O., Lecomte, E., Burov, E., Denèle, Y., Brun, J., Philoppon, M., Paul, A., Salaün, G., Karabulut, H., Piromallo, C., Monié, P., Gueydan, F., Okay, A. I., Oberhänsli, R., & Driussi, O. (2013). Aegean tectonics: Strain localisation, slab tearing and trench retreat. Tectonophysics, 597–598, 1–33. https://doi.org/10.1016/j.tecto.2012.06.011
- Kilias, S. P., Nomikou, P., Papanikolaou, D., Polymenakou, P. N., Godelitsas, A., Argyraki, A., Carey, S., Gamaletsos, P., Mertzimekis, T. J., Stathopoulou, E., Goettlicher, J., Steininger, R., Betzelou, K., Livanos, I., Christakis, C., Bell, K. C., & Scoullos, M. (2013). New insights into hydrothermal vent processes in the unique shallow-submarine arc-volcano, Kolumbo (Santorini), Greece. Scientific Reports, 3(1)). https://doi.org/10.1038/srep02421
- Kokkalas, S., & Aydin, A. (2013). Is there a link between faulting and magmatism in the south-central Aegean Sea? Geological Magazine, 150(2), 193–224. https://doi.org/10.1017/S0016756812000453
- Lee, E. M. (2001). Geomorphological mapping. In J. S. Griffiths (Ed.). Land surface evaluation for engineering practice (pp. 53–56). Geological Society of London, Engineering Geology Special Publications 18.
- Micallef, A. (2011). Marine geomorphology: Geomorphological mapping and the study of submarine landslides. In Developments in earth surface processes 15 (pp. 377–395). Elsevier. https://doi.org/10.1016/B978-0-444-53446-0.00013-6.
- NASA/METI/AIST/Japan Spacesystems, and U.S./Japan ASTER Science Team. (2019). ASTER Global Digital Elevation Model V003 [Data set]. NASA EOSDIS Land Processes DAAC. Accessed 2020-06-30 from https://doi.org/10.5067/ASTER/ASTGTM.003.
- Nomikou, P., Carey, S., Bell, K. L. C., Papanikolaou, D., Bejelou, K., Cantner, K., Sakellariou, D., & Perros, I. (2014). Tsunami hazard risk of a future volcanic eruption of Kolumbo submarine volcano, NE of Santorini Caldera, Greece. Natural Hazards, 72, 1375–1390. https://doi.org/10.1007/s11069-012-0405-0
- Nomikou, P., Carey, S., Papanikolaou, D., Bell, K. C., Sakellariou, D., Alexandri, M., & Bejelou, K. (2012). Submarine volcanoes of the Kolumbo volcanic zone NE of Santorini Caldera, Greece. Global and Planetary Change, 90-91, 135–151. https://doi.org/10.1016/j.gloplacha.2012.01.001
- Nomikou, P., Druitt, T. H., Hübscher, C., Mather, T. A., Paulatto, M., Kalnins, L. M., Kelfoun, K., Papanikolaou, D., Bejelou, K., Lampridou, D., Pyle, D. M., Carey, S., Watts, A. B., Weiẞ, B., & Parks, M. M. (2016). Post-eruptive flooding of Santorini caldera and implications for tsunami generation. Nature Communications, 7(1), 13332. https://doi.org/10.1038/ncomms13332
- Nomikou, P., Hübscher, C., & Carey, S. (2019). The Christiana-Santorini-Kolumbo volcanic field. Elements, 15(3), 171–176. https://doi.org/10.2138/gselements.15.3.171
- Nomikou, P., Hübscher, C., Papanikolaou, D., Farangitakis, G. P., Ruhnau, M., & Lampridou, D. (2018). Expanding extension, subsidence and lateral segmentation within the Santorini – Amorgos basins during Quaternary: Implications for the 1956 Amorgos events, central – south Aegean Sea, Greece. Tectonophysics, 722, 138–153. https://doi.org/10.1016/j.tecto.2017.10.016
- Nomikou, P., Hübscher, C., Ruhnau, M., & Bejelou, K. (2016). Tectono-stratigraphic evolution through successive extensional events of the Anydros Basin, hosting Kolumbo volcanic field at the Aegean Sea, Greece. Tectonophysics, 671, 202–217. https://doi.org/10.1016/j.tecto.2016.01.021
- Nomikou, P., Papanikolaou, D., Alexandri, M., Sakellariou, D., & Rousakis, G. (2013). Submarine volcanoes along the Aegean volcanic arc. Tectonophysics, 597-598, 123–146. https://doi.org/10.1016/j.tecto.2012.10.001
- Nomikou, P., Parks, M. M., Papanikolaou, D., Pyle, D. M., Mather, T. A., Carey, S., Watts, A. B., Paulatto, M., Kalnins, M. L., Livanos, I., Bejelou, K., Simou, E., & Perros, I. (2014). The emergence and growth of a submarine volcano: The Kameni islands, Santorini (Greece). GeoResJ, 1–2, 8–18. https://doi.org/10.1016/j.grj.2014.02.002
- Okal, E. A., Synolakis, C. E., Uslu, B., Kalligeris, N., & Voukouvalas, E. (2009). The 1956 earthquake and tsunami in Amorgos, Greece. Geophysical Journal International, 178(3), 1533–1554. https://doi.org/10.1111/j.1365-246X.2009.04237.x
- Papadimitriou, P., Kapetanidis, V., Karakonstantis, A., Kaviris, G., Voulgaris, N., & Makropoulos, K. (2015). The Santorini volcanic complex: A detailed multi-parameter seismological approach with emphasis on the 2011-2012 unrest period. Journal of Geodynamics, 85, 32–57. https://doi.org/10.1016/j.jog.2014.12.004
- Papanikolaou, D. (2015). Geology of Greece. Patakis Edition, p. 448 (in Greek).
- Papoutsis, I., Papanikolaou, X., Floyd, M., Ji, K. H., Kontoes, C., Paradissis, D., & Zacharis, V. (2013). Mapping inflation at Santorini volcano, Greece, using GPS and InSAR. Geophysical Research Letters, 40(2), 267–272. https://doi.org/10.1029/2012GL054137
- Parks, M. M., Biggs, J., England, P., Mather, T. A., Nomikou, P., Palamartchouk, K., Papanikolaou, X., Paradissis, D., Parsons, B., Pyle, D. M., Raptakis, C., & Zacharis, V. (2012). Evolution of Santorini Volcano dominated by episodic and rapid fluxes of melt from depth. Nature Geoscience, 5(10), 749–754. https://doi.org/10.1038/ngeo1562
- Parks, M. M., Moore, J. D. P., Papanikolaou, X., Biggs, J., Mather, T. A., Pyle, D. M., Raptakis, C., Paradissis, D., Hooper, A., Parsons, B., & Nomikou, P. (2015). From quiescence to unrest: 20 years of satellite geodetic measurements at Santorini volcano, Greece. Journal of Geophysical Research: Solid Earth, 120(2), 1309–1328. https://doi.org/10.1002/2014JB011540
- Perissoratis, C. (1995). The Santorini volcanic complex and its relation to the stratigraphy and structure of the Aegean arc, Greece. Marine Geology, 128(1-2), 37–58. https://doi.org/10.1016/0025-3227(95)00090-L
- Piper, D. J. W., Pe-Piper, G., Perissoratis, C., & Anastasakis, G. (2007). Distribution and chronology of submarine volcanic rocks around Santorini and their relationship to faulting. Geological Society, London, Special Publications, 291(1), 99–111. https://doi.org/10.1144/SP291.5
- Piper, D. J. W., & Perissoratis, C. (2003). Quaternary neotectonics of the South Aegean arc. Marine Geology, 198(3-4), 259–288. https://doi.org/10.1016/S0025-3227(03)00118-X
- Puchelt, H., Murad, E., & Hubberten, H. W. (1977). Geochemical and petrological studies of lavas, pyroclastics and associated xenoliths from the Christiana Islands, Aegean Sea. Neues Jahrbuch fuer Mineralogie, 131(2), 140–255.
- Pyle, D. M., & Elliott, J. R. (2006). Quantitative morphology, recent evolution, and future activity of the Kameni Islands volcano, Santorini, Greece. Geosphere, 2(5), 253. https://doi.org/10.1130/GES00028.1
- Schmitt, H. H., Trask, N. J., & Shoemaker, E. M. (1967). Geologic map of the Copernicus quadrangle of the moon. U.S. Geological Survey: Misc. Geologic Investigations Map, scale 1:1,000,000.
- Sigurdsson, H., Carey, S., Alexandri, M., Vougioukalakis, G., Croff, K., Roman, C., Sakellariou, D., Anagnostou, C., Rousakis, G., Ioakim, C., Gogou, A., Ballas, D., Misaridis, T., & Nomikou, P. (2006). Marine investigations of Greece’s Santorini volcanic field. Eos. Eos, Transactions American Geophysical Union, 87, 337. https://doi.org/10.1029/2006EO340001
- Skinner, J. A. Jr., Huff, A. E., Fortezzo, C. M., Gaither, T. A., Hare, T. M., & Hunter, M. A. (in press). Planetary Geologic Mapping Protocol, USGS Techniques and Methods Paper. Current digital release: https://astropedia.astrogeology.usgs.gov/alfresco/d/d/workspace/SpacesStore/01e32dcd-3072-4ac2-8e41-7cc5029bd2cf/PGM_Protocol_March2018.pdf
- Smith, M. J., & Pain, C. F. (2009). Application of remote sensing in geomorphology. Progress in Physical Geography: Earth and Environment, 33(4), 568–582. https://doi.org/10.1177/0309133309346648
- Tanaka, K. L., Skinner, J. A. Jr., Dohm, J. M., Irwin, R. P. III, Kolb, E. J., Fortezzo, C. M., Platz, T., Michael, G. G., & Hare, T. M. (2014). Geologic map of mars. U.S. Geological Survey Scientific Investigations Map 3292, scale 1:20,000,000, pamphlet 43 p., https://doi.org/10.3133/sim3292.
- Tassi, F., Vaselli, O., Papazachos, C. B., Giannini, L., Chiodini, G., Vougioukalakis, G. E., Karagianni, E., Vamvakaris, D., & Panagiotopoulos, D. (2013). Geochemical and isotopic changes in the fumarolic and submerged gas discharges during the 2011–2012 unrest at Santorini caldera (Greece). Bulletin of Volcanology, 75(4), 711. https://doi.org/10.1007/s00445-013-0711-8
- Ulvrova, M., Paris, R., Nomikou, P., Kelfoun, K., Leibrandt, S., Tappin, D. R., & McCoy, F. W. (2016). Source of the tsunami generated by the 1650 AD eruption of Kolumbo submarine volcano (Aegean Sea, Greece). Journal of Volcanology and Geothermal Research, 321, 125–139. https://doi.org/10.1016/j.jvolgeores.2016.04.034
- U.S. Geological Survey National Cooperative Geologic Mapping Program (USGS NCGMP). (2020). GeMS (Geologic Map Schema)—A standard format for the digital publication of geologic maps. USGS Techniques and Methods, book 11, chap. B10, 74 p., https://doi.org/10.3133/tm11B10.
- Wright, J., Rothery, D. A., Balme, M. R., & Conway, S. J. (2019). Geology of the Hokusai quadrangle (H05), Mercury. Journal of Maps, 15(2), 509–520. https://doi.org/10.1080/17445647.2019.1625821