
ABSTRACT
The maps produced in this article allow an extended interpretation of rural tourism’s development in mainland Portugal by identifying spatio-temporal patterns, relationships, and connections. This is accomplished through the superimposition of multiple thematic layers and kernel density analysis to potentially predict rural tourism’s ruralisation patterns. The maps demonstrate that the development of rural tourism in Portugal observed a centrifugal and dispersive pattern, spreading from semi-urban to deep-rural areas. The analysis is further refined by applying the CHAID algorithm helping to show that the more recent rural tourism establishments are avoiding towns and villages and locating closer to agricultural land and protected areas. The maps and the complementary analyses provide a multidimensional understanding of rural tourism’s spatial development exemplified in complex relationships between location factors and distinct rural tourism accommodation typologies.
KEYWORDS:
1. Introduction
The primary forms of rural tourism development in many European countries are mostly related to agriculture’s decline in the early 1970s (CitationLane & Kastenholz, Citation2015) and the consequent rural economy’s multifunctional evolvement (CitationGerowitt et al., Citation2003; CitationMarsden & Sonnino, Citation2008). The rural land base crisis gave rise to strategies of ‘farmland diversification’ (CitationMarsden & Sonnino, Citation2008, p. 423), encouraging the development of agritourism (Lane et al., Citation2014), which started by ‘recycling and revalorizing existing properties and heritage resources as tourist accommodation’ (CitationLane & Kastenholz, Citation2015, p. 1134). Therefore, the development of rural tourism is mostly explained as a panacea for agriculture’s ills (CitationLane, Citation1994) and an opportunity to sustain the agricultural economy by expanding the rural system to a new environment, that is, tourism. Primary forms of rural tourism were, expectedly, deeply embedded in rural landscapes and associated with accommodation on farms (Lane et al., Citation2014).
Unlike many European countries where agriculture had a relevant contribution to the economy, Portugal’s agriculture during 1970–1973 played a marginal role in the country’s economy and society (CitationAmaral, Citation1994), aggravated by the abandonment of agricultural practices on the land that began in the mid-twentieth century (CitationBeilin et al., Citation2014). Hence, tourism as a multifunctional transition strategy in rural communities (CitationWilson, Citation2010) and farm diversification was still not a priority issue in Portugal. In fact, rural tourism is seemingly rooted in semi-urbanized settings, supported by governmental policies and legislation that endorsed the renewal of manor houses. The Portuguese case suggests that the government’s approach was more concerned with promoting additional accommodation in specific regions rather than redeveloping rural areas.
Given the complex and controversial evolvement of rural tourism in Portugal regarding its geographical implications, it seems adequate to apply a geospatial analysis collecting, manipulating, and displaying geographic information system (GIS) and historical data to explain these dynamics. A cartographic longitudinal portrayal of the Portuguese rural tourism’s development, starting in 1977, should provide an understanding of the changes that have occurred in terms of rural spatial distribution and therefore provide evidence of the reconfiguration of rural space. Though previous studies have analyzed rural tourism´s spatial distribution and development conditions from a supply perspective, employing a variety of geospatial techniques combining GIS with multi-criteria decision analysis (CitationAyhana et al., Citation2020; CitationGonzález-Ramiro et al., Citation2016; CitationZhang & Yang, Citation2008), network analysis (CitationLee et al., Citation2013), or even kernel density methods (CitationXua et al., Citation2020), the majority of these studies have adopted a cross-sectional methodology and are deprived of a longitudinal temporal quality. Contrarily, our study gauges the longer-term trend of rural tourism’s spatial reconfiguration, allowing to observe a centrifugal and dispersive pattern, spreading from semi-urban to rural areas, thus demonstrating an incremental ruralization trend.
The resulting main and supplementary maps are suitable for perceiving the spatial reconfiguration of rural space in Portugal. Moreover, the cartographic representation allows a sounder response to challenges of accurate validation in pattern recognition in our data, which combines both temporal and spatial dimensions of dissemination of rural tourism establishments. This is accomplished through the superimposition of multiple thematic layers and the development of kernel density analysis to predict rural tourism´s ruralization patterns.
The dominant feature is the ‘Main Map 1’ dedicated to the distribution of rural tourism accommodation units by year and degree of urbanization. Other three additional maps show the location of rural tourism accommodations relative to the land cover, the superimposition of rural tourism units kernel density maps and the relation to nature and agriculture and a cartographic longitudinal portrayal rural tourism’s development.
2. Spatiotemporal insights of rural tourism supply
CitationPröbstl-Haider et al. (Citation2014) suggest four different tourism development options for rural areas: the ‘lighthouse model’, the ‘small-scale land use model’, the ‘zoning model’ and the ‘thematic model’. The ‘lighthouse model’ is based on the assumption that multiplier and spill-over effects over an extended rural area are prompted by one or a few projects. The ‘small-scale land use’ tourism development option is based on the combination of agricultural land use with tourism and as a diversification strategy to generate additional economic benefits to farmers, namely by offering farm stays. The ‘zoning model’ is purposefully developed to promote and enhance areas of high natural interest to visitors, and the concept is frequently applied in association to natural protected areas. Finally the ‘thematic model’ is based on the effect of branding and theming linking tourism’s infrastructure to an entire product in rural areas.
Rural tourism in mainland Portugal has developed under the assumption of CitationPröbstl-Haider et al.’s (2014) models (except for the ‘lighthouse model’), which has determined a deep reconfiguration of rural tourism spatial patterns since 1970. Rural tourism development was first leveraged by a political strategy to diversify the tourism offer (CitationMinistério do Comércio e do Turismo, Citation1991), based on a core objective to provide tourist accommodation in areas of transition from rural to urban land uses. Despite this initial intention, it evolved and expanded to diversify the economy of rural areas and contributing to the sustainability of rural landscapes (CitationCarvalho, Citation2018). It was first established as an alternative and supplementary form of tourist accommodation, particularly in areas with potential unsatisfied demand. A network of manor houses later developed a common brand named Solares de Portugal, examplifying the ‘thematic model’. This rural tourism typology remains until today as a form of tourist accommodation, focusing on architecture, prestige, and traditional family atmosphere, usually poorly integrated into rural environments and activities (CitationRibeiro & Marques, Citation2002). After 2000, a soaring rural tourism offer seems to have followed and at least two of the aforementioned models have sustained rural tourism’s development in mainland Portugal. Agritourism (farm tourism) was one of these forms, embodying the ‘small-scale land use model’ where tourism was integrated within existing agricultural holdings, allowing guests to take part in agricultural activities and related services. The latest form of rural tourism development has emerged and expanded according to the ‘zoning model’, with rural accommodation supply benefiting from the attraction and market value of landscape protection.
3. Methods
3.1. Research setting and data
The study area is mainland Portugal (88,962.5 km2). Geoinformation (GI) regarding rural tourism units was extracted from the Georeferenced Open Data Platform of Turismo de Portugal IP (Citation2021, accessed Feb 9). The available datasets were obtained from the Tourism Geographic Information System (SIGTUR), which stores hospitality and tourism spatial and non-spatial data. A total of 2361 registered rural tourism units in mainland Portugal were extracted, comprising four typologies. From these records, only 1979 (84%) provided information regarding the opening year. SIGTUR uses a data synchronization system working to retrieve the latest lodging establishments’ data from the National Tourism Registry (RNT), representing with a polygon each building or parcel that contains all the buildings from each lodging establishment. Centroid coordinates were obtained for each polygon.
GI on agriculture land use and land cover (LUC) were extracted from the Portuguese Land Cover Map of 2018 (CitationDGT, Citation2019b). This is a vector data model (polygons) at the 1/25,000 scale, with a minimal cartographic unit of 1 ha, and a minimum polygon width and distance between lines of 20 m. Its cartographic information was obtained from photointerpretation of orthophotos with a spatial resolution of 25 cm with four spectral bands (blue, green, red, and near-infrared) with an average interpretative accuracy of 85% that was divided into hierarchical levels, from level one (L1), containing nine primary types (1 – artificial areas; 2 – agricultural areas; 3 – pastures; 4 – agroforestry; 5 – forests; 6 – shrublands; 7 – sparsely vegetated areas; 8 – wetlands; and 9 – water bodies) to level four (L4) containing up to 83 classes (CitationDGT, Citation2019a). In this study, LUC agriculture L1 class was divided into two distinct groups using L4 class codes, namely: a) ‘Vineyards’ – LUC code 2.2.1.1 and b) ‘Other agriculture’ – remaining agriculture LUC L4 class codes. GI on water bodies was retrieved from the same source (CitationDGT, Citation2019b).
GI regarding natural protected areas, that is the Natura 2000 network, is provided by the Portuguese Institute for Nature Conservation and Forests (CitationICNF, 2020). Natura 2000 network is a European-wide ecological network, comprising sites designated under the Birds Directive (Special Protection Areas or SPAs) and the Habitats Directive (Sites of Community Importance or SCIs, and Special Areas of Conservation or SACs).
The degree of urbanization (DEGURBA) was obtained from GHSL Settlement Model (GHSL SMOD), a porting of the DEGURBA method in the Global Human Settlement Layer (GHSL) framework developed by the European Commission, Joint Research Centre. The degree of urbanization classifies, at 1 km2 grid cells, the entire territory of a country along the urban-rural continuum. It delineates and classifies settlement typologies via a logic of cell clusters of population size, population, and built-up area densities (CitationFlorczyk et al., Citation2019). In this study, we used the second hierarchical level of the GHSL SMOD (L2) (CitationPesaresi et al., Citation2019), represented by its municipal level technical term. This is a refinement of the method that enables the identification of smaller settlements with a nested classification into the first hierarchical level clusters, identifying the following spatial entities: a) ‘Urban Centres’ as the first level; b) ‘Dense Towns’ and c) ‘Semi-dense towns’ as parts of the ‘Urban Cluster’, classifying all the other cells of ‘Urban Clusters’ as ‘Suburb’; and identifying d) ‘Village’ within the ‘Rural grid cells’. All the other cells belonging to the ‘Rural grid cells’ are classified as ‘Rural dispersed area’ or ‘Mostly uninhabited area’ according to the population in the respective cell.
The production of the various maps also used complementary GI: elevation from the European Environmental Agency (CitationEEA, Citation2017); bathymetry from the CitationEMODnet Bathymetry Consortium (Citation2020); the Portuguese mainland boundary from the General Directorate for Territorial Development (CitationDGT, Citation2021).
3.2. Map design
Open-source GIS software (QGIS 3.16.3) was used to produce the maps and to perform the spatial and temporal analysis of rural accommodation units. Kernel density maps at 1 km2 grid cells, with a bandwidth of 45 km, determined by quartic kernel function, were produced for the subsets of rural tourism units’ points layer classified by year of opening into four distinct groups (1977-2000; 2001-2007; 2008-2014; 2015-2021).
Descriptive and exploratory quantitative analyses show how the territorial distribution of rural accommodation is associated with DEGURBA, land cover and protected areas. GRASS GIS v.distance process was used to compute the shortest-distance from each accommodation unit to agriculture land, vineyards, and Natura 2000 areas.
Regarding the Main Map, colors use for each DEGURBA class are in accordance with the color code provided by EEA. In order to improve visual contrast, we applied a color ramp based on a completely distinct secondary hue (violet) HSV range for TER units age classes. Given the pixel-based background of DEBURBA layer, simple geometric markers (circles) were also chosen for TER units to increase legibility.
In Main Map 2, we included a multi-directional hillshade based on the EU-DEM v1.1 digital surface model as a background and applied layer blending to enhance Natura 2000 areas topography. We opt for a multiply mode since it would also result in a darker colored layer that would increase legibility for the agricultural land uses that were layered in the foreground of natural areas. We then used simple geometric marker symbols for the distinct TER typologies, with mainly primary colors to increase its legibility in the land use and natural areas reference map.
In both main maps, layers were organized in order to emphasize the focus on the spatial relation between TER and urbanization in Main Map 1, and natural and agricultural land uses in Main Map 2, but given the perceived influence that the proximity to the coast can have in tourist accommodation units location, we decide to include the ocean representation in the map to depict that influence and also to add some relevant geographic context. By opposition, neighboring country urbanization and land uses were not considered relevant in the analysis so we opt for a neutral grey to improve focus and legibility of the mainland area.
3.3. Chi-squared Automatic Interaction Detection
Chi-squared Automatic Interaction Detection (CHAID) (CitationKass, Citation1980) is applied to combine optimal partitions of predictors explaining differences in the distribution of rural tourism units’ DEGURBA and distance(s) to the areas of interest. To have similar analyses for DEGURBA and distance(s), the former is transformed into an interval scale from 1 (‘mostly uninhabited’) to 7 (‘urban centers’). When the dependant variable is measured in a metric scale, CHAID splits the predictors into categories maximizing the F statistic for the difference in mean values between the nodes, applying a Bonferroni correction for the significance (CitationMagidson, Citation2004). Since we are interested in temporal and spacial dimensions of dissemination of rural tourism establishments, the time of opening was included as a monotonic predictor in the three CHAID models. The type of establishment is a free (i.e. every combination of categories is acceptable) predictor in every model. So does the wine region, and additional predictor included in the model explaining distance to vineyards.
4. Results
4.1. Dissemination of rural tourism
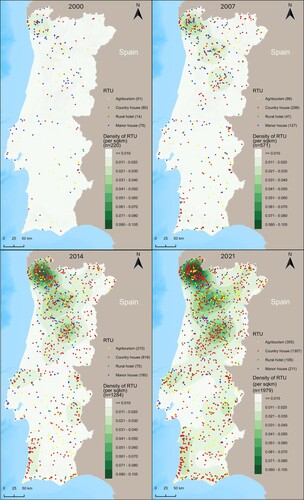
Rural tourism is spatially scattered all over mainland Portugal. Two hundred and fifty or 90% of the 278 municipalities have at least one rural tourism establishment. Considering all observations with opening dates (1979), it is possible to estimate how rural tourism spread over the country (). The Kernel density analysis shows that two decades ago there was a weak concentration of rural accommodation in the north-western part of the country and that the level of concentration of units diminished sharply towards the south. The number of units opening between 2000 and 2014 is almost fivefold those that already existed in 2000 and still exist. Important clusters of rural accommodation were formed in the Douro Wine Region and Serra da Estrela (the highest mountain on the mainland), while some less intense clusters were emerging in Alentejo. During the last seven years, the more mature clusters intensified the supply and most of the inland is now covered by some level of intensity. Notably, there is also an important level of supply on the coast of Alentejo.
Figure 1. Dissemination of rural accommodation (Kernel density estimated from the year of opening).
5. Ruralization
Given the aforementioned development pattern of rural tourism, it would be expected that more mature units would be closer to urban areas, while the more recent would be in less urbanized areas. Before analyzing the relationship between the opening year and the degree of urbanization, it is important to verify if the 382 units with unknown dates of opening differ from the others in the DEGURBA variable. The difference is non-significant (t = 1.33; p = .185). There is no association with the rural tourism typology either (χ2 = 1.17 with 3 d.f.; p = .761).
Overall, most units currently opened are indeed located in rural settings (Main Map 1) – 43% are in DEGURBA squares classified as mostly uninhabited with a global average of the transformed DEGURBA (scale from 1 to 7) of 1.89. shows the results of a CHAID analysis comparing the mean of the dependent variable DEGURBA according to the ideal splits of typology of units and opening years. Rural tourism units with reported opening years (average DEGURBA equal to 1.88) are classified into eight groups combining different levels of the predictor variables. The degree of urbanization varies significantly between rural tourism typologies, and it varies between opening periods within types of rural tourism (except for the least represented typology, rural hotels). In the largest groups of rural tourism typologies, namely agritourism and country houses, the DEGURBA is significantly lower in newer establishments, compared to the more mature. Regarding manor houses, DEGURBA decreased from 2000 to 2014, and increased again more recently, although the number of newer units is relatively small (31).
Table 1. Average DEGURBA according to typology and time of opening.
To summarize, the more frequent rural tourism typologies (agritourism and country houses), representing 84% of all units, which were already more rural than the other categories at the end of the first period, are becoming more rural, increasing the preference for location in uninhabited areas.
6. Relation to nature and agriculture
The agriculture LUC represents 26% of the territory. There is a close relationship between rural tourism location and agricultural land use. In fact, 85% of rural tourism establishments are less than 100 m apart from agriculture-covered land and only 1% (29 units) are more than 1 km away. A particular agricultural activity having outstanding potential for rural tourism accommodation is viticulture, especially when coupled with wine tourism activities at the cellar door, given that wine producers have an incentive to diversify into tourism with relatively low sunk costs (CitationTaylor et al., Citation2007). Most of the country is covered by wine regions, although vineyards represent only 9% (194,699 ha) of the total agriculture area. Its distribution reflects specific conditions of the territory. The Centro de Portugal region (Central Region) has the largest wine-growing area, followed by the Douro and Alentejo regions, although the Douro is the largest wine-producing region. In particular, the main DOC regions (DOC refers to a protected designation of origin, Denominação de Origem Controlada) have a good reputation, and tourists traveling to those destinations may consider the regional brand value involved in wine experiences. The largest DOC regions have developed wine routes and several accommodation establishments are active members.
There are 1666 (or 71%) units located within the limits of DOC regions. A CHAID analysis () shows that rural accommodation units vary considerably between DOC regions on how close they are to vineyards. The Douro is completely different from the rest of the country, given the prominence of vineyards in land cover and its ubiquity in the landscape. So, it is no surprise to find a rather small average distance (75 m) between vineyards and the accommodation establishments. The wine region with the most intense rural tourism supply is Vinho Verde, which includes the cluster of rural tourism units located in the Northwest and the western part of the Douro Valley (see ), with a total of 647 units. CHAID distinguishes, on average, the more distant country houses (1765 m) from the other types (554 m), suggesting that agritourism, rural hotels, and manor houses may be more integrated with viticulture, while country houses tend to be closer to natural areas, particularly to National Parks, as described below.
Figure 2. The wine regions and Natura 2000 areas most relevant to Kernel density of accommodation units.
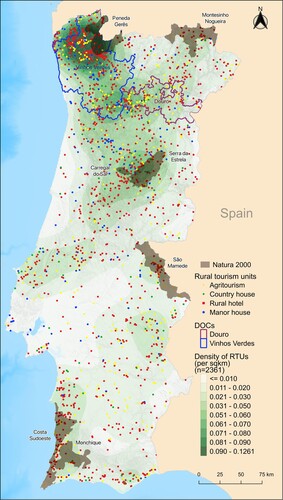
Table 2. Average distance (m) from vineyards, according to the wine region and typology of establishment.
The same distinction between country houses and other accommodations is apparent in the group formed by Trás-os-Montes, Távora-Varosa, Bairrada, and Setúbal-Palmela. In these regions, the number of rural tourism units is relatively low, but they tend to be fairly close to vineyards. The average distance increases in the other regions, including the important DOC producers Alentejo and Dão, suggesting that a mix of location factors are relevant in these regions rather than wine alone.
Besides agriculture, some units offer the benefit of being close to natural areas and nearly 23% are indeed within Natura 2000 protected areas. This proportion varies across rural tourism accommodation categories, country houses (28%) being the highest and agritourism (14%) and manor houses (6%) being the lowest. There is, however, a noticeable variance across regions. There are 85 units located in the National Park of Peneda-Gerês and the protected area of Rio Lima, corresponding to the densest cluster in , in the northwest of the country. Next, an emergent cluster in the Southwest (protected areas of Costa Sudoeste and Monchique), with 79 units. Natural areas also seem to be important location factors in the consolidated rural tourism cluster near the areas of Serra da Estrela – Carregal do Sal, where 61 units are located; followed by the São Mamede – Caia area, with 46 units in the emerging cluster of Alto Alentejo; and lastly in the Northeast, also with 46 units in the Montesinho Natural Park and rivers Sabor and Maçãs. Main Map 2 represents the location of all rural tourism units relative to all the Natura 2000 areas as well as the agricultural land use, standing out the viticulture.
The CHAID analysis () shows that manor houses tend to be located more distant from natural areas, while country houses tend to be closer. There is no interaction with the time of opening. This result is expected, as manor houses are more frequently located in urban settings ().
Table 3. Average distance (m) from NATURA 2000, according to the typology of establishment.
7. Discussion
Results reveal that, although the rural tourism supply was initially dependent on manor houses mostly located in villages and suburbs, it is now dominated by country houses and agritourism units, which are increasingly located in uninhabited areas. This evolution was determinant for the dispersion of rural tourism accommodation all over the countryside, including some coastal areas. However, even in the more intense clusters (Alto Minho – Cávado; Douro; Serra da Estrela), the units that have developed in the last 15 years are located in more rural environments, compared to more mature ones.
Most rural tourism units are located close to agricultural land, with various degrees of integration with agricultural activities. There are, however, some notable differences regarding land covered by vineyards, which is an important attracting factor for rural tourism. It is nearly impossible to stay at a rural accommodation in the Douro without running into a vineyard, whereas in other regions, including important wine producers, such as Vinho Verde, Dão, and Alentejo, the relation with viticulture plays only a part in a mix of location factors. In particular, natural protected areas constitute an additional attraction factor for rural tourism location in mountain ranges – namely Peneda-Gerês, Estrela, Nogueira, and São Mamede – and on the southwest coast.
Revisiting CitationPröbstl-Haider et al. (Citation2014) typology of rural tourism development models, one must concede that the prominent clusters of rural accommodation supply are an outcome of a combination of models. For example, in Douro 1/3 of rural tourism units are located within the limits of World Heritage designation, but all remaining units are under the site protection buffer zone and therefore are bonded to UNESCO’s special protection status of the Douro cultural property. These rural tourism units are integrated into vineyards, in close relation with viticulture and winemaking, and benefiting from thematic labeling from the Douro and Port terroir brands. On the other hand, in the densest north-western cluster, recent country houses at the outskirts of the National Park seem to articulate well with traditional manor houses in the Lima Valley (see Main Map 2), showing that regional competitiveness is favored when different motivations to venture in rural tourism and different rural tourism typologies coexist. The articulation may be well beyond rural accommodation, as CitationMarques et al. (Citation2021) demonstrate. Regions comprising leading clusters recorded an increase in the domestic demand in the period between the first two COVID-19 waves, compared to a context of decreasing demand at the national level.
8. Conclusion
This study delivers the first comprehensive spatial analysis of Portugal’s rural tourism ruralisation trend since mid-1970, following a centrifugal development pattern initially dependent on manor houses that began in semi-urban areas and spread across the countryside, including some coastal regions.
The maps produced in this article allow an extended interpretation of this development by identifying spatial dependence patterns, relationships, and connections, that have occurred in terms of rural spatial distribution. This is accomplished by overlaying multiple thematic maps and using a kernel function to fit a smoothly formed surface to each point to predict rural tourism’s ruralization patterns. The analysis was further refined by applying CHAID to show how specific spatial determinants, such as the degree of urbanization, natural areas, or agricultural sites, best merge to explain rural tourism’s ruralisation trend.
This exploratory analysis provided a multidimensional understanding of rural tourism’s spatial development exemplified in complex relationships between factors such as thematic labeling and landscape typology (e.g. Douro World Heritage site – vineyard landscape). Additionally, our maps captured spatial contiguity interactions between high-value natural resources (e.g. natural parks) and distinct rural tourism accommodation typologies (e.g. country and manor houses), revealing that rural tourism regional clustering increases with multi-typological development patterns. Therefore, our maps confirmed and expanded our initial understanding that rural tourism was originally dependent on manor houses located in villages and suburbs, spreading later to remote and uninhabited areas and developing more complex patterns and combinations of rural tourism typologies, moving towards the countryside, thus providing evidence of the reconfiguration of rural space and its transition towards a rural multifunctional paradigm.
Software
Data were processed and analyzed on Microsoft Office Excel Professional Plus 2016 and IBM SPSS Statistics 26. QGIS 3.16.3 software was used for managing all the GI and for creating the maps.
TJOM_A_2079430_Supplementary material_Map2
Download PDF (47.5 MB)TJOM_A_2079430_Supplementary material_Map1
Download PDF (47.1 MB)Data availability statement
The data sets that support the findings of this study are all publicly available and referenced and can be provided by the corresponding author, RB, upon reasonable request.
Disclosure statement
No potential conflict of interest was reported by the author(s).
Additional information
Funding
References
- Amaral, L. (1994). Portugal e o passado: política agrária, grupos de pressão e evolução da agricultura portuguesa durante o Estado Novo (1950-1973). Análise Social, XXIX(128), 889–906. http://analisesocial.ics.ul.pt/documentos/1223377900O7jBJ3zl9Px04XU4.pdf.
- Ayhana, Ç, Taşlıa, T., Özkök, T., & Tatlı, H. (2020). Land use suitability analysis of rural tourism activities: Yenice. Turkey. Tourism Management, 76, 103949. https://doi.org/10.1016/j.tourman.2019.07.003
- Beilin, R., Lindborg, R., Stenseke, M., Pereira, H. M., Llausàs, A., Slätmo, E., Cerqueira, Y., Navarro, L., Rodrigues, P., Reichelt, N., Munro, N., & Queiroz, C. (2014). Analysing how drivers of agricultural land abandonment affect biodiversity and cultural landscapes using case studies from Scandinavia, Iberia and Oceania. Land Use Policy, 36, 60–72. https://doi.org/10.1016/j.landusepol.2013.07.003
- Carvalho, P. (2018). Dynamics of rural low density spaces in Portugal. Méditerranée [Online], 130. Retrived from URL : http://journals.openedition.org/mediterranee/10516. DOI : https://doi.org/10.4000/mediterranee.10516
- DGT. (2019a). Especificações técnicas da Carta de Uso e Ocupação do Solo (COS) de Portugal Continental para 2018. Direção-Geral do Território. Retrieved Apr 16, 2021 from http://mapas.dgterritorio.pt/atom-dgt/pdf-cous/COS2018/ET-COS-2018_v1.pdf.
- DGT. (2019b). Registo Nacional de Dados Geográficos: Carta de Uso e Ocupação do Solo - 2018. Direção-Geral do Território. Retrieved Apr 16, 2021 from https://snig.dgterritorio.gov.pt/rndg/srv/en/catalog.search#/metadata/b498e89c-1093-4793-ad22-63516062891b.
- DGT. (2021). Registo Nacional de Dados Geográficos: Carta Administrativa Oficial de Portugal - CAOP2020 (Continente). Direção-Geral do Território. Retrieved Apr 16, 2021 from https://snig.dgterritorio.gov.pt/rndg/srv/en/catalog.search#/metadata/198497815bf647ecaa990c34c42e932e.
- EEA. (2017). Copernicus land monitoring service - EU-DEM [Dataset DAT-193-en]. https://www.eea.europa.eu/ds_resolveuid/DAT-193-en.
- EMODnet Bathymetry Consortium. (2020). EMODnet Digital Bathymetry (DTM 2020). https://doi.org/10.12770/bb6a87dd-e579-4036-abe1-e649cea9881a
- Florczyk, A. J., Corbane, C., Ehrlich, D., Freire, S., Kemper, T., Maffenini, L., Melchiorri, M., Pesaresi, M., Politis, P., Schiavina, M., Sabo, F., & Zanchetta, L. (2019). GHSL Data Package 2019 (No. EUR 29788 EN). https://doi.org/10.2760/0726.
- Gerowitt, B., Bertke, E., Hespelt, S.-K., & Tute, C. (2003). Towards multifunctional agriculture – weeds as ecological goods? Weed Research, 43(4), 227–235. https://doi.org/10.1046/j.1365-3180.2003.00340.x
- González-Ramiro, A., Gonçalves, G., Sánchez-Ríos, A., & Jeong, J. (2016). Using a VGI and GIS-Based Multicriteria Approach for Assessing the Potential of Rural Tourism in Extremadura (Spain). Sustainability, 8(11), 1144–1144. https://doi.org/10.3390/su8111144
- ICNF (Cartographer). (2020). Rede Natura 2000. https://sigservices.icnf.pt/server/rest/services/BDG/RN2000/MapServer.
- Kass, G. V. (1980). An exploratory technique for investigating large quantities of categorical data. Journal of the Royal Statistical Society. Series C (Applied Statistics), 29(2), 119–127. https://doi.org/10.2307/2986296
- Lane, B. (1994). What is rural tourism? Journal of Sustainable Tourism, 2(1-2), 7–21. https://doi.org/10.1080/09669589409510680
- Lane, B., & Kastenholz, E. (2015). Rural tourism: the evolution of practice and research approaches – towards a new generation concept? Journal of Sustainable Tourism, 23(8-9), 1133–1156. https://doi.org/10.1080/09669582.2015.1083997
- Lane, B., Weston, R., Davies, N., Kastenholz, E., Lima, J., & Majewsjki, J.. (2014). Industrial heritage and agri/rural tourism in Europe: A review of their development, socio–economic systems and future policy issues. European Publications Office. https://doi.org/10.2861/4530 .
- Lee, S.-H., Choi, J.-Y., Yoo, S.-H., & Oh, Y.-G. (2013). Evaluating spatial centrality for integrated tourism management in rural areas using GIS and network analysis. Tourism Management, 34, 14–24. https://doi.org/10.1016/j.tourman.2012.03.005
- Magidson, J. (2004). CHAID. In M. Lewis-Beck, A. Bryman, & T. Liao (Eds.), The SAGE encyclopedia of social science research methods (pp. 118–119). SAGE.
- Marques, C. P., Guedes, A., & Bento, R. (2021). Rural tourism recovery between two COVID-19 waves: the case of Portugal. Current Issues in Tourism, 1–7. https://doi.org/10.1080/13683500.2021.1910216
- Marsden, T., & Sonnino, R. (2008). Rural development and the regional state: Denying multifunctional agriculture in the UK. Journal of Rural Studies, 24(4), 422–431. https://doi.org/10.1016/j.jrurstud.2008.04.001
- Ministério do Comércio e do Turismo. (1991). Livro Branco do Turismo. Direcção-Geral do Turismo.
- Pesaresi, M., Florczyk, A., Schiavina, M., Melchiorri, M., & Maffenini, L. (2019). GHS-SMOD R2019A - GHS settlement layers, updated and refined REGIO model 2014 in application to GHS-BUILT R2018A and GHS-POP R2019A, multitemporal (1975-1990-2000-2015) [Dataset]. https://doi.org/10.2905/42E8BE89-54FF-464E-BE7B-BF9E64DA5218.
- Pröbstl-Haider, U., Melzer, V., & Jiricka, A. (2014). Rural tourism opportunities: strategies and requirements for destination leadership in peripheral areas. Tourism Review, 69(3), 216–228. https://doi.org/10.1108/TR-06-2013-0038
- Ribeiro, M., & Marques, C. (2002). Rural tourism and the development of less favoured areas - between rhetoric and practice. International Journal of Tourism Research, 4(3), 211–220. https://doi.org/10.1002/jtr.377
- Taylor, P., McRae-Williams, P., & Lowe, J. (2007). The determinants of cluster activities in the Australian wine and tourism industries. Tourism Economics, 13(4), 639–656. https://doi.org/10.5367/000000007782696050
- Turismo de Portugal , I. P. (2021). Turismo de Portugal - Dados Abertos. https://dadosabertos.turismodeportugal.pt/.
- Wilson, G. (2010). Multifunctional ‘quality’ and rural community resilience. Transactions of the Institute of British Geographers, 35(3), 364–381. https://doi.org/10.1111/j.1475-5661.2010.00391.x
- Xua, J., Yanga, M., Houb, C., Lua, Z., & Liu, D. (2020). Distribution of rural tourism development in geographical space: a case study of 323 traditional villages in Shaanxi, China. European Journal of Remote Sensing, 1–333. https://doi.org/10.1080/22797254.2020.1788993
- Zhang, H., & Yang, Q. (2008). Rural tourism spatial distribution based on multi-criteria decision analysis and GIS, Proc. SPIE 7144, Geoinformatics 2008 and Joint Conference on GIS and Built Environment: The Built Environment and Its Dynamics, 714425 (5 November 2008). https://doi.org/10.1117/12.812825.