
 ?Mathematical formulae have been encoded as MathML and are displayed in this HTML version using MathJax in order to improve their display. Uncheck the box to turn MathJax off. This feature requires Javascript. Click on a formula to zoom.
ABSTRACT
Although food insecurity continues to be widely researched, the body of literature examining its relationship with disability remains under-studied. To advance this area, the present study investigated the spatial prevalence of food insecurity and disability by examining the Southeast region of the United States (i.e., Alabama, Arkansas, Georgia, Louisiana, Mississippi, Tennessee), an area with disproportionately high levels of both conditions. After collecting records from multiple sources to create a dataset containing health-oriented and physical environment variables, an exploratory mapping analyses was conducted. Results showed distinct high and low value patterns for both food insecurity and disability and the test of local coefficients confirmed geographic variability. To account for this spatial non-stationarity, geographically weighted regression (GWR) was implemented with the county as the unit of analysis. GWR estimates revealed that disability was positively associated with food insecurity but the association varied in magnitude across the Southeast region.
1. Introduction
Food insecurity, defined as a household-level economic and social condition of limited or uncertain access to adequate food for a healthy life, remains a concern in the United States (US) with an estimated 11% of households being impacted at some period during 2018 (CitationColeman-Jensen et al., Citation2019). This indicates at-least one household member was worried food would run out or not last, was not able to afford a balanced meal, or experienced a reduced or skipped meal (CitationCafiero et al., Citation2018; CitationGundersen et al., Citation2011; CitationHarris et al., Citation2014; CitationNRC, 2006). On-going research has advanced our understanding of food insecurity and scholars and practitioners recognize the importance of addressing food insecurity from multiple perspectives. Despite this progress, shortcomings remain because some of this work has not accounted for the spatial distribution of food insecurity and how local health attributes are associated with the ability to acquire and consume wholesome foods (CitationGundersen & Ziliak, Citation2018; CitationJablonski et al., Citation2016). And with respect to being able to acquire food, there is a growing but still limited body of research in this area which examines disability (CitationBishop & Wang, Citation2018; CitationColeman-Jensen, Citation2020). In general, disability refers to a condition which impairs mobility.
1.1. Scholarly contribution and conceptual framework
The importance of understanding the covariance of food insecurity and disability with its correlates was made salient by Schwartz and colleagues (Citation2019a) with a comprehensive screening of 1406 articles with a final review of 106 articles dating from 1960 to 2018. Their analysis found disability was positively associated with food insecurity. However, a wide range was present for the odds ratios or OR (e.g. 95% confidence intervals ranging from 1.0 to 4.5 OR, 1.5 to 3.5 OR, 1.5 to 5.0 OR) for several studies while other studies provided a low contribution in terms of strength of evidence. Based on these inconsistent findings, CitationSchwartz et al. (Citation2019a) concluded disability impacted food insecurity but a more complete understanding is needed. Another notable review examined an extensive body of literature from multiple fields and found a relationship between food insecurity and disability (CitationGundersen & Ziliak, Citation2018). These scholars observed that the level of food insecurity varied across the US and such a finding espoused the need for a regional analysis. More specifically, food insecurity was common in the Southeast region but was less noticeable in the Midwest and Northeast. Except for Arizona and New Mexico, the West had among the lowest rates in the nation (CitationFeeding America, Citation2019). These scholars similarly conveyed the need for more research as to better inform policymakers about practical approaches to address food insecurity.
Building upon the afore-mentioned comprehensive reviews, this study applied a socio-ecological framework to better understand disability with food insecurity with an emphasis on health and physical environment attributes (CitationBurris et al., Citation2019; CitationDeller et al., Citation2017; CitationRivera et al., Citation2018). The socio-ecological approach has been widely used to better understand how structures beyond the individual-level influence outcomes. When applying such an approach within a spatial framework, researchers should consider the importance of local variation. That is, do these structures (i.e. health and physical environment attributes) have a spatial influence on the outcome (see Preliminary steps and GWR model formulation section for additional details). Accounting for this variation was another contribution of this study. More specifically, the county served as the unit of analysis with health and physical environment factors as community-level variables in explaining the association between disability and food insecurity in the Southeast region (CitationBronfenbrenner, Citation1992; CitationGoldberg & Mawn, Citation2015; CitationSchwartz et al., Citation2019b; CitationSharma, Citation2014; CitationShoff et al., Citation2014; CitationTarasuk et al., Citation2019). As explained in the Study setting section, the Southeast region consisted of the following states: Alabama, Arkansas, Georgia, Louisiana, Mississippi, and Tennessee.
In terms of a formal hypothesis, this study first examined the existence of food insecurity and disability by testing the following, where HO was the null and HA was the alternative:
HO1: Food insecurity exhibited a random pattern across the Southeast region.
HA1: Food insecurity did not exhibit a random pattern (i.e. clustered) across the Southeast region.
HO2: Disability exhibited a random pattern across the Southeast region.
HA2: Disability did not exhibit a random pattern (i.e. clustered) across the Southeast region.
Next, the study examined the association between the spatial distribution of disability with food insecurity and the following hypotheses were tested:
HO3: Varying levels of disability did not exhibit a local association with varying levels of food insecurity across the Southeast region.
HA3: Varying levels of disability exhibited a local association with varying levels of food insecurity across the Southeast region.
2. Methods
2.1. Study setting
The study area was the Southeast region of the US and included the following states: Alabama, Arkansas, Georgia, Louisiana, Mississippi, and Tennessee. These states were selected because (a) they had a sizeable population base, (b) maintained high levels of food insecurity, (c) comprised an area with elevated disability rates, and (d) offered the most complete data profile at the county-level.Footnote1 According to the 2019 Census, the total population for these six states approximated 33 million or nearly 10% of the entire US population with Georgia being the 8th and Tennessee being the 16th most populous of the 50 states (CitationU.S. Census Bureau, 2019). In terms of food insecurity, estimates from the 2019 Map the Meal Gap show several states in this region experienced a rate of 17% and nearly one-fifth of all the counties approached 25% (CitationFeeding America, Citation2019). Overall, Arkansas, Louisiana, and Mississippi were near the top of the ranking for US states with high levels of food insecurity (CitationHolston et al., Citation2020). In addition to a sizeable food insecure population, there was a significant representation of adults with a disability, thereby supporting this region as a suitable candidate to study. According to the 2017 Behavioral Risk Factor Surveillance System (BRFSS), approximately 33% of adults in Alabama had some type of disability and this approximated 35% for Arkansas, 28% for Georgia, 34% for Louisiana, 35% for Mississippi, and 30% for Tennessee (CitationCDC, Citationn.d.). This coincides with an analysis of disability estimates from the 2018 American Community Survey (ACS) where Alabama, Arkansas, and Mississippi were among the top five states for disability in the US (CitationErickson et al., Citation2020). In sum, these six states were selected because a significant portion of the population experienced food insecurity and this region had among the highest rates of disability in the nation.
2.2. Data sources and measures
Data were collected from multiple sources: Census programs (ACS, Population Estimates Program), BRFSS, Diabetes Surveillance System, and Map the Meal. The dependent variable corresponded to food insecurity. This was obtained from Map the Meal program, which acquired data on food insecurity from the Current Population Survey and then utilized the Core Food Insecurity Model to derive estimates. Food insecurity was defined as the percentage of households having difficulty providing adequate food for family members at some point during the year. This variable was measured at the county-level for 2018. An important point to note regarding this variable was the Core Food Insecurity Model employed a regression framework which estimated food insecurity based on unemployment, poverty, median income, percentage Hispanic, percentage Black, and homeownership percentage at the state-level (first step) and then another regression with these same variables at the county-level (second step). As such, the above-listed variables relating to income and race/ethnicity were not included in the present analysis since they were previously built into the food insecurity estimate (see Map the Meal: Technical Brief for details; CitationGundersen et al., Citation2018). One advantage of employing this measure was Map the Meal applied five-year averages from the ACS when modeling food insecurity, thereby limiting year-to-year fluctuations when examining smaller geographies.
The main independent variable corresponded to percentage of population with a disability at the county-level. This measure was obtained from the 2014 to 2018 five-year ACS. It represented the percentage of non-institutionalized individuals at least 18 years of age with a disability. For this study, disability was defined as the percentage of the non-institutionalized population with a self-reported inability to engage in activities related to walking, climbing stairs, or dressing and grooming and such an impairment lasted not less than six months (CitationAltman et al., Citation2017; CitationErickson, Citation2012; CitationU.S. Census, 2018).
The 2017 BRFSS was utilized to obtain the percentage smoking and percentage obese variables. Percentage smoking measured the population aged 18 or older that reported smoking cigarettes every day or some days for each county. This variable was included because recent studies have found an association between cigarette smoking and food insecurity (CitationFarrelly & Shafer, Citation2017; CitationMayer et al., Citation2019). Percentage obese was one of the four categories (e.g. underweight, normal, overweight, obese) calculated from the body mass index or BMI and this variable measured the percentage of the population with a BMI > 30 kilograms/meter2 (kg/m2) for each county. This variable was included because lower quality food purchases and a greater fear of running out of money to buy food could be higher for the obese category (CitationSarlio-Lahteenkorva & Lahelma, Citation2001). Excessive drinking measured the percentage of the adult population reporting binge or heavy drinking during the past 30 days and it was reported at the county-level. A recent analysis employing the 2018 Eating and Activity over Time (EAT 2018) data found a positive association between binge drinking and food insecurity (CitationLarson et al., Citation2020). As with smoking, this study highlighted the importance of accounting for health risk behaviors. Finally, percentage physically inactive was obtained from the 2017 Diabetes Surveillance System questionnaire where respondents were asked about reporting no leisure-time physical activity for the past month. This variable was added not only because previous research has found as association between it and food insecurity but also to reduce any confounding influence with obesity. This measure was also collected at the county-level. These variables were added based on previous studies which found an association between health attributes and food insecurity (CitationGucciardi et al., Citation2009; CitationMadden et al., Citation2020; CitationTarasuk et al., Citation2013).
Data for the physical environmental variables were obtained from various national programs. For example, air particulate matter measured ambient air quality for particle pollution at 2.5 micrometers for each county for 2016 and this data was collected by the Environmental Public Health Tracking System from the Centers for Disease Control and Prevention (CDC). This variable was included because recent work has found higher levels of PM2.5 negatively impacted food security while others have found areas with greater air pollution to be vulnerable to food production (CitationTai et al., Citation2014; CitationZhou et al., Citation2018). A recent study examined annual crop yields at the county-level throughout the US from 1980 to 2019 and found decreased production levels in areas with high air pollution (CitationLiu & Desai, Citation2021). Severe housing cost burden measured the percentage of households where at least 50% of the household income was spent on housing. Mobile homes measured the percentage of homes classified as a movable dwelling where units do not require a permanent foundation. Both variables were added based on previous studies which found a relationship between housing circumstances and food insecurity (CitationClay & Ross, Citation2020; CitationKirkpatrick & Tarasuk, Citation2011; CitationSt-Germain & Tarasuk, Citation2020). Finally, no vehicle for transportation was included based on critical reviews of food insecurity, which found residential mobility (i.e. car ownership) to be a factor (CitationCarter et al., Citation2014). These researchers also recommended adding spatial mobility as a variable in future studies. No vehicle for transportation was included for this reason and it measured the percentage of households without a vehicle available for use. These three variables were obtained from the 2014 to 2018 five-year ACS. The health and physical environment variables were selected based on the afore-mentioned comprehensive reviews and recent research reports (CitationColeman-Jensen, Citation2020; CitationGundersen & Ziliak, Citation2018; CitationHarris et al., Citation2014; CitationHeflin et al., Citation2019; CitationJih et al., Citation2018; CitationKestens et al., Citation2010; CitationMcIntyre et al., Citation2016; CitationSchwartz et al., Citation2019a).
2.3. Preliminary steps and GWR model formulation
When deciding whether to employ a global approach (i.e. ordinary least squares or global OLS) or a local approach (i.e. geographically weighted regression or GWR), researchers must first determine if the spatial context needs to be considered. To accomplish this, the researcher should explore the spatial distribution of the dependent variable (i.e. food insecurity) for the presence of spatial heterogeneity. The choropleth map revealed a pattern where counties with high values for food insecurity were adjacent to each other in several states. In this case, high values meant at least 20% of the population experienced food insecurity. This was also conveyed by the hot spot analysis map where a clustered pattern was evident (see map of Food Insecurity Clusters). This was determined by utilizing the Getis-Ord Gi* tool to examine statistically significant value groupings of neighboring counties. To examine the extent of this clustering, the Moran’s Index (I) was employed. Moran’s I measures spatial autocorrelation where the calculated value ranges from −1.0 (dispersed) to a +1.0 (clustered) with a value close to 0 indicating randomness. With an I value equal to 0.59, pseudo p-value < 0.01, and Z-score of 8.56, the null hypothesis of random distribution of the data was rejected in favor of the alternative suggesting non-random spatial clustering for food insecurity. In addition to spatial exploration of the dependent variable, the geographical context of the main independent variable (i.e. disability) should be examined. With a Moran’s I value equal to 0.40, pseudo p-value < 0.01, and a Z-score of 5.48, the null hypothesis of random distribution was rejected in favor of the alternative suggesting non-random spatial clustering for disability (see map of Disability Clusters). To ensure GWR will be an appropriate framework, researchers should also conduct the geographical variability test of local coefficients. This test evaluates all the independent variable coefficients for spatial variability by applying a difference criterion between the global and local model. Should a change in values occur across this space, then local non-stationarity is present. The results supported the use of a local approach.
After conducting the preliminary step of spatial exploration and finding evidence of both spatial autocorrelation and non-stationarity, the next step was to employ GWR. GWR was an appropriate framework because this formulation accounted for the uneven distribution of disability and it also adjusted (i.e. weighted) for the spatial influence and proximity of observations (CitationBrunsdon et al., Citation1998; CitationBrunsdon et al., Citation1996; CitationCharlton et al., Citation2009). GWR was also a suitable approach because the objective of this study was to advance the food insecurity and disability area by recognizing the spatial structure of both variables. In terms of an equation, GWR can be written as:
(1)
(1) where yi was the measure of food insecurity for county i and (ui,vi) denoted the centroid for each county with ϵi as the random error term. β0i was the intercept while βni was the estimated parameter for variable n with respect to county I. After formulating this framework, the next steps were to select the weighting function by (1) considering the type of kernel (i.e. Gaussian or bi-square), (2) determining whether the kernel would be adaptive or fixed, and (3) applying a selection method to determine the bandwidth (or distance) for the kernel. These three procedures comprised the initial regression process. The bi-square weighting function with an adaptive kernel was employed because the distribution of the observations varied across space. Specifically, counties were smaller and closer together in the Southeast region (i.e. Georgia) relative to the northwest and southwest (i.e. Arkansas and Louisiana). Due to this unequal distribution, the use of an adaptive kernel allowed adjustments to the bandwidth so counties closer to i could more strongly influence the estimation of βni (ui,vi). Finally, an iterative process which searched for the most favorable bandwidth (i.e. optimal kernel size) was utilized. This was accomplished by narrowing the range of values inside the bandwidth by searching and then comparing the lowest obtained Akaike Information Criteria scores (AICc).
3. Results
3.1. Descriptive analyses
Food insecurity at the county-level ranged from 6% to 30% and was clustered in the Southeast region of the US (see and Food Insecurity Clusters). Some areas with high values of food insecurity (i.e. at least 20%) include the southeastern counties of Arkansas, northeastern counties of Louisiana, central counties of Mississippi, and southwestern counties of Alabama. In contrast, some counties with low values of food insecurity (i.e. less than 10%) include most of Arkansas, the southern counties in Georgia, and the western portion of Tennessee. Disability at the county-level ranged from 7% to 29% and it was also clustered. Disability was widespread throughout Arkansas, central Georgia, southeastern Mississippi, and northeastern Tennessee. In contrast, some counties with low values of disability (i.e. less than 10%) include the central east part of Louisiana and the southern counties of Georgia. As for physical environmental variables, air particulate matter was consistent throughout the study area with a mean of 10 for PM2.5. A wide range applied to no vehicles for transportation with a mean of 7% and a minimum of 1% and maximum of 19%. Severe housing burden and mobile homes also exhibited a broad range.
Table 1. Descriptive summary for health and physical environment variables by state.
3.2. Regression analyses
GWR results conveyed the importance of recognizing the local context. That is, health and physical environment differences at the county-level were captured when understanding how disability was associated with food insecurity. Results showed wide ranging minimum and maximum values for disability, smoking, and no vehicles for transportation (see ).
Table 2. Local GWR regression results for Food Insecurity.
In terms of estimates, the disability values ranged from .08 to 0.41 with a mean of 0.25 and a median of 0.27. A geographical variability test of local coefficients and the accompanying map of disability estimates and disability significance offered evidence of regional differences. As such, the null hypothesis (HO3) stating varying levels of disability did not exhibit a local association with varying levels of food insecurity across the Southeast region could be rejected in favor of the alternative. In formal terms, the GWR results suggested a one percentage point increase in disability was associated with a 0.25 percentage point increase in food insecurity. For the afore-mentioned areas, disability approximated much higher at 0.41. GWR analyses also suggested other health attributes play a role when explaining food insecurity. For example, a one percentage point increase in smoking was associated with a 0.27 percentage point increase in food insecurity. A positive association was found for percentage obesity and physical inactivity but the estimates were much smaller at 0.03.
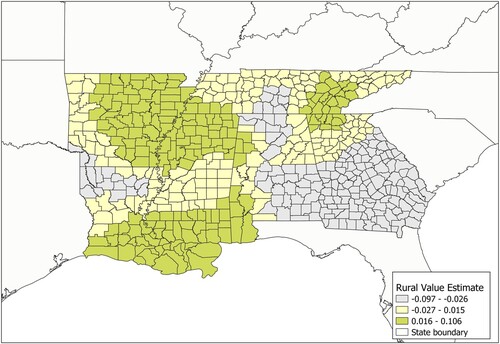
Physical environment attributes were also meaningful in explaining food insecurity. As a case in point, consider severe housing cost. An increase in severe housing cost burden was associated with increased food insecurity. While the mean estimated 0.18, GWR results showed this variable reached a maximum of 0.38 for several northern counties in the Southeast region. In other areas, the estimate was less than 0.05 and such a low value suggested housing cost may not be associated with food insecurity. Mobile homes also exhibited a positive association, as did no vehicles for transportation but with a much higher estimate. A one percentage point increase in no vehicles for transportation was associated with a 0.23 percentage point increase in food insecurity. Although rural was negatively associated with food insecurity, the association was near zero. However, counties in Arkansas, southern Louisiana, and northern and southern Mississippi reflected a positive association with food insecurity with an estimate of 0.11 while counties in Georgia reflected a negative association with food insecurity with an estimate of −0.10.
In addition to the GWR table of estimates, the map revealed the association between disability and food insecurity was notable in the northern and eastern counties and less so near the southwestern counties of the Southeast region (see map of GWR Estimates for Disability). In general, the contrast between spaces conveyed the importance of recognizing local variation. Some areas where a strong association with disability was found include the northern portion of Arkansas, all of Tennessee, northern part of Alabama, and both the northern and southeastern portion of Georgia (see darker shaded areas). Some areas where a weaker association with disability was found include the southern part of Arkansas and northern and central portion of Louisiana (see lighter shaded areas).
4. Discussion
The percentage of the population with a disability was positively associated with food insecurity for several counties in the Southeast region of the US (see map of GWR Estimates for Disability). In terms of a geographic perspective, this area encompassed the northern portions of Alabama and Arkansas, all of Tennessee, and the eastern part of Georgia. Some of these counties also had a greater proportion of the population with high rates of disability. That is, the percentage of the population with a disability approximated 25% or higher. In contrast to Arkansas or Tennessee, a clustered pattern for high values for the percentage of the population with a disability was not evident for Georgia (see map of Disability Clusters). Instead, a clustered pattern for very low and low values of the percentage of the population with a disability was noted (except for the Atlanta Metropolitan Statistical Area). That is, the percentage of the population with a disability approximated 10% or lower. However, the association with food insecurity estimated at the higher range of 0.28–0.41. This was an interesting finding and one which suggested local variation in disability had a distinct impact on food insecurity after accounting for other health and physical environment attributes. As another case in point, consider the southeastern portion of Mississippi and the southwestern portion of Alabama. For each of these states, a cluster of ten counties was notable for high levels of disability. With a value of nearly 25%, these areas maintained a population with disproportionately greater disability. However, the percentage of the population with a disability was weakly associated with food insecurity (see maps of Disability Clusters and GWR Estimates for Disability). Specifically, the association between disability and food insecurity estimated closer to the minimum value of 0.08. These results suggested the importance of recognizing local variation in disability and its disproportionate impact on food insecurity. In short, the association for disability varied in magnitude and significance across the Southeast region and other health and physical environment attributes were important considerations for food insecurity.
For some counties, severe housing cost burden had a stronger association with food insecurity than any other variable (see map of Housing Cost Burden). In these cases, the estimate for percentage of households in a county expending at least 50% of income on housing estimated at 0.38. Other studies have correspondingly found areas with higher levels of housing costs to experience greater food insecurity (CitationBartfeld et al., Citation2006; CitationGundersen et al., Citation2011). Such consistent and robust findings seem reasonable given the close link between food insecurity, housing, homeownership, and income with respect to food purchases and this positive association has been observed by other scholars (CitationMcIntyre et al., Citation2016; CitationShobe et al., Citation2018). That is, higher food insecurity in areas with greater home stability (CitationHolben & Marshall, Citation2017; CitationNord et al., Citation2014).
The local context was also a worthwhile consideration when examining another physical environment attribute: no vehicles for transportation. Counties with a greater percentage of no vehicles experienced higher levels of food insecurity. This was notable for the northeastern part of Arkansas and the northwestern part of Tennessee, as well as several northern counties in Mississippi (see map of No Vehicles). The association was smaller for most of Louisiana and the central and southern portions of Georgia. This finding requires greater exploration because a recent qualitative study in Louisiana noted some communities had access to only one grocery store and were distant (i.e. nearly 30 min by car) from usual places for food purchases (CitationHolston et al., Citation2020). This study also found dollar stores served as an option for non-perishables and low-cost items. This is concerning because areas with a high concentration of dollar stores lack nutritionally rich selections and tend to offer unhealthy processed foods items ().
Figure 1. GWR Estimates for No Vehicles.
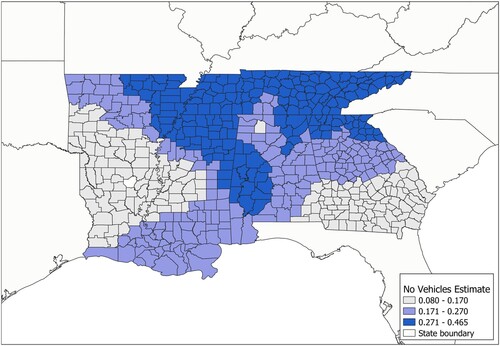
Figure 2. GWR Estimates for Severe Housing Cost Burden.
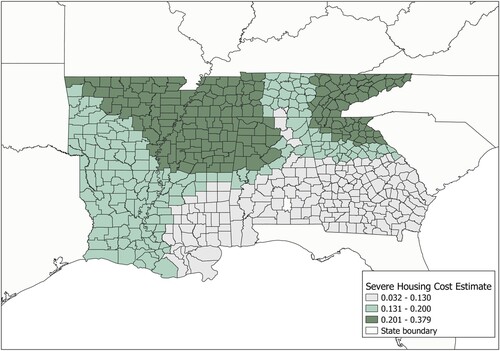
Figure 3. GWR Estimates for Mobile Homes.
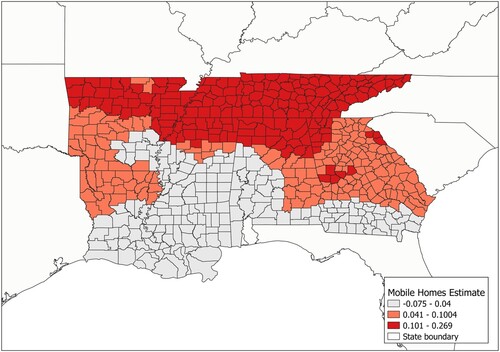
Figure 4. GWR Estimates for Rural Value.
4.1. Limitations
This study was limited in a few ways. For one, the GWR regression and the estimated coefficients for a county were influenced by bordering counties. Since places closer in space are more related (i.e. Tobler’s First Law of Geography) and the distance of influence is a theoretic construct, perhaps a county is too large of a geographic area. Possibly, an examination at the neighborhood-level may better capture local variation. However, a county-level analysis recognizes administrative boundaries and can be useful for policy and planning purposes. A second limitation was data availability regarding the built environment. Studies have found obstructed walkways, limited availability of sidewalks, difficult to navigate roadways, and limited public transportation can influence food purchases (CitationCrowe et al., Citation2018; CitationHuang et al., Citation2012). These types of variables were not included in the analyses. Although this study included percentage of mobile homes and percentage of households without a vehicle for transportation at the county-level, having additional measures would have offered a better understanding of how the local context influenced food insecurity. Another measure to include corresponds to proximity to grocery stores. While a recent study did not find food insecure individuals lived at distances greater than food secure individuals with respect to healthy grocery stores, adding a spatial component which accounted for distance to food outlets (e.g. grocery stores, farmers’ markets, etc.) could have offered additional insight into how disability was associated with food insecurity (CitationSantarossa et al., Citation2021).
This study was undertaken to better understand the association between disability and food insecurity and, in the process, contribute to a growing but still limited body of research by building upon the recommendations of leading scholars. As such, this study was not a comprehensive review or comparative analysis of disability and food insecurity. Additionally, findings from this study should not be interpreted in a causal manner. A final limitation to note corresponds to careful consideration of the unit of analysis when drawing conclusions with aggregated data by being aware of Simpson’s paradox, ecological fallacy, and the areal unit problem (CitationBuzzelli, Citation2020). While current research suggests that Simpson’s paradox can be resolved by identifying the causal structure, readers should still exercise caution because the body of research examining food insecurity and disability continues to develop (CitationHernán et al., Citation2011; CitationSchwartz et al., Citation2019a). Although GWR maintains properties which can diminish the influence of the areal unit problem, policymakers and public health practitioners should still undertake efforts to become familiar with the geographic scale for food insecurity and disability in their community or county when devising interventions to promote population health and try to limit drawing conclusions at the individual-level (CitationLee, Citation2020).
5. Conclusion
The relationships among minority populations, household median income, obesity, physical inactivity, and unemployment with food insecurity have been studied previously (CitationCarter et al., Citation2014; CitationColeman-Jensen, Citation2020; CitationHolben & Marshall, Citation2017; CitationShobe et al., Citation2018; CitationZiliak & Gundersen, Citation2019). However, many of these studies have not examined food insecurity with disability by adding a spatial component which investigated the non-stationarity of these relationships. The major strength of this study was the use of GWR in the analyses of the spatial distribution and correlates of food insecurity prevalence. Building on the work by Schwartz and colleagues (Citation2019a) and Ziliak and Gundersen (Citation2020), this present study applied their recommendations and extended the present state of knowledge by examining micro-geographies (i.e. regional scope) of food insecurity within a health and physical environment framework. For some counties, disability played a larger role with food insecurity while income spent on housing costs or no vehicles for transportation were more critical in other areas. Given the value of employing GWR to better understand local influences, policymakers in the Southeast region can use these results to formulate action plans based on county-specific needs. The second step may involve working with nutrition professionals, public health professionals, and social workers to identify specific community-level needs (e.g. no vehicles for transportation, mobile homes, housing cost burden) by conducting an analysis using census tracts (CitationIvassenko et al., Citation2022). This could be a direction for future research.
Software
The analyses were conducted using Stata V15, GWR4, and QGIS (CitationNakaya et al., Citation2014; CitationQGIS, 2019; CitationStataCorp., Citation2015). Stata and GWR were employed for the descriptive and regression analyses while QGIS was utilized to render the cluster, disability estimates, and disability significance maps.
TJOM_A_2092909_Supplementary material
Download PDF (17.7 MB)Disclosure statement
No potential conflict of interest was reported by the author(s).
Data availability statement
The author will provide data for any reasonable request.
Notes
1 Florida and North Carolina were not included due to data limitations for the physical environment variables while Virginia was excluded because it divided the existing contiguous spatial area (i.e., created loss of spatial space).
References
- Altman, B. M., Madans, J., & Weeks, J. D. (2017). An evaluation of the American Community Survey indicators of disability. Disability and Health Journal, 10(4), 485–491. https://doi.org/10.1016/j.dhjo.2017.03.002
- Bartfeld, J., Dunifon, R., Nord, M., & Carlson, S. (2006). What factors account for state-to-state differences in food security? (No. 1476-2016-121049).
- Bishop, N. J., & Wang, K. (2018). Food insecurity, comorbidity, and mobility limitations among older US adults: Findings from the health and retirement study and health care and nutrition study. Preventive Medicine, 114, 180–187. https://doi.org/10.1016/j.ypmed.2018.07.001
- Bronfenbrenner, U. (1992). Ecological systems theory. Jessica Kingsley Publishers.
- Brunsdon, C., Fotheringham, A. S., & Charlton, M. E. (1996). Geographically weighted regression: A method for exploring spatial nonstationarity. Geographical Analysis, 28(4), 281–298. https://doi.org/10.1111/j.1538-4632.1996.tb00936.x
- Brunsdon, C., Fotheringham, S., & Charlton, M. (1998). Geographically weighted regression. Journal of the Royal Statistical Society: Series D (The Statistician), 47(3), 431–443. https://doi.org/10.1111/1467-9884.00145
- Burris, M., Kihlstrom, L., Arce, K. S., Prendergast, K., Dobbins, J., McGrath, E., & Himmelgreen, D. (2019). Food insecurity, loneliness, and social support among older adults. Journal of Hunger & Environmental Nutrition, 16(1), 29–44. https://doi.org/10.1080/19320248.2019.1595253
- Buzzelli, M. (2020). Modifiable areal unit problem. International Encyclopedia of Human Geography, 2020, 169–173. https://doi.org/10.1016/B978-0-08-102295-5.10406-8.
- Cafiero, C., Viviani, S., & Nord, M. (2018). Food security measurement in a global context: The food insecurity experience scale. Measurement, 116, 146–152. https://doi.org/10.1016/j.measurement.2017.10.065
- Carter, M. A., Dubois, L., & Tremblay, M. S. (2014). Place and food insecurity: A critical review and synthesis of the literature. Public Health Nutrition, 17(1), 94–112. https://doi.org/10.1017/S1368980013000633
- CDC. (n.d). Disability & Health U.S. State Profile Data: Adults 18 + years of age. Retrieved May 10, 2021 from www.cdc.gov/ncbddd/disabilityandhealth/impacts/index.html
- Charlton, M., Fotheringham, S., & Brunsdon, C. (2009). Geographically weighted regression. White Paper. National Centre for Geocomputation. National University of Ireland Maynooth, 2.
- Clay, L. A., & Ross, A. D. (2020). Factors associated with food insecurity following Hurricane Harvey in Texas. International Journal of Environmental Research and Public Health, 17(3), 762. https://doi.org/10.3390/ijerph17030762
- Coleman-Jensen, A. (2020). US food insecurity and population trends with a focus on adults with disabilities. Physiology & Behavior, 220, 112865. https://doi.org/10.1016/j.physbeh.2020.112865
- Coleman-Jensen, A., Rabbitt, M. P., Gregory, C. A., & Singh, A. (2019). Household food security in the United States in 2018. ERR-270. USDA. Economic Research Service.
- Crowe, J., Lacy, C., & Columbus, Y. (2018). Barriers to food security and community stress in an urban food desert. Urban Science, 2(2), 46. https://doi.org/10.3390/urbansci2020046
- Deller, S., Canto, A., & Brown, L. (2017). Food access, local foods, and community health. Community Development, 48(5), 657–680. https://doi.org/10.1080/15575330.2017.1358197
- Erickson, W. (2012). A guide to disability statistics from the American Community Survey (2008 forward).
- Erickson, W., Lee, C., & von Schrader, S. (2020). 2017 disability status report: Arkansas. Cornell University Yang Tan Institute on Employment and Disability (YTI).
- Farrelly, M. C., & Shafer, P. R. (2017). Comparing trends between food insecurity and cigarette smoking among adults in the United States, 1998 to 2011. American Journal of Health Promotion, 31(5), 413–416. https://doi.org/10.1177/0890117116660773
- Feeding America. (2019). Hunger & Poverty in the United States. Food Insecurity in the United States before COVID-19. Map the Meal Gap. (n.d.). Retrieved February 10, 2022, from https://map.feedingamerica.org/
- Goldberg, S. L., & Mawn, B. E. (2015). Predictors of food insecurity among older adults in the United States. Public Health Nursing, 32(5), 397–407. https://doi.org/10.1111/phn.12173
- Gucciardi, E., Vogt, J. A., DeMelo, M., & Stewart, D. E. (2009). Exploration of the relationship between household food insecurity and diabetes in Canada. Diabetes Care, 32(12), 2218–2224. https://doi.org/10.2337/dc09-0823
- Gundersen, C., Kreider, B., & Pepper, J. (2011). The economics of food insecurity in the United States. Applied Economic Perspectives and Policy, 33(3), 281–303. https://doi.org/10.1093/aepp/ppr022
- Gundersen, C., Satoh, A., Dewey, A., Kato, M., & Engelhard, E. (2018). Map the meal gap 2018: Technical brief. Feeding America.
- Gundersen, C., & Ziliak, J. P. (2018). Food insecurity research in the United States: Where we have been and where we need to go. Applied Economic Perspectives and Policy, 40(1), 119–135. https://doi.org/10.1093/aepp/ppx058
- Harris, D. E., Aboueissa, A. M., Walter, K., & Bampton, M. (2014). Predictors of food insecurity in Lewiston, Maine: A community-level analysis. Journal of Hunger & Environmental Nutrition, 9(1), 96–112. https://doi.org/10.1080/19320248.2013.840549
- Heflin, C. M., Altman, C. E., & Rodriguez, L. L. (2019). Food insecurity and disability in the United States. Disability and Health Journal, 12(2), 220–226. https://doi.org/10.1016/j.dhjo.2018.09.006
- Hernán, M. A., Clayton, D., & Keiding, N. (2011). The Simpson's paradox unraveled. International Journal of Epidemiology, 40(3), 780–785. https://doi.org/10.1093/ije/dyr041
- Holben, D. H., & Marshall, M. B. (2017). Position of the Academy of Nutrition and Dietetics: Food insecurity in the United States. Journal of the Academy of Nutrition and Dietetics, 117(12), 1991–2002. https://doi.org/10.1016/j.jand.2017.09.027
- Holston, D., Stroope, J., Greene, M., & Houghtaling, B. (2020). Perceptions of the food environment and access among predominantly Black low-income residents of rural Louisiana communities. International Journal of Environmental Research and Public Health, 17(15), 5340. https://doi.org/10.3390/ijerph17155340
- Huang, D. L., Rosenberg, D. E., Simonovich, S. D., & Belza, B. (2012). Food access patterns and barriers among midlife and older adults with mobility disabilities. Journal of Aging Research, 2012. https://doi.org/10.1155/2012/231489
- Ivassenko, V., Macnab, A. J., Di Emidio, D., Hollederer, A., Iellamo, E. A., Cabuslay, J. I. B., Lim, I., Felipe, S., Arante, B., & Sharma, A. (2022). Engaging with people and populations in health promotion research: A snapshot on participatory processes. Global Handbook of Health Promotion Research, Vol. 1: Mapping Health Promotion Research, 93.
- Jablonski, B. B., McFadden, D. T., & Colpaart, A. (2016). Analyzing the role of community and individual factors in food insecurity: Identifying diverse barriers across clustered community members. Journal of Community Health, 41(5), 910–923. https://doi.org/10.1007/s10900-016-0171-0
- Jih, J., Stijacic-Cenzer, I., Seligman, H. K., Boscardin, W. J., Nguyen, T. T., & Ritchie, C. S. (2018). Chronic disease burden predicts food insecurity among older adults. Public Health Nutrition, 21(9), 1737–1742. https://doi.org/10.1017/S1368980017004062
- Kestens, Y., Lebel, A., Daniel, M., Thériault, M., & Pampalon, R. (2010). Using experienced activity spaces to measure foodscape exposure. Health & Place, 16(6), 1094–1103. https://doi.org/10.1016/j.healthplace.2010.06.016
- Kirkpatrick, S. I., & Tarasuk, V. (2011). Housing circumstances are associated with household food access among low-income urban families. Journal of Urban Health, 88(2), 284–296. https://doi.org/10.1007/s11524-010-9535-4
- Larson, N., Laska, M. N., & Neumark-Sztainer, D. (2020). Food insecurity, diet quality, home food availability, and health risk behaviors among emerging adults: Findings from the EAT 2010–2018 study. American Journal of Public Health, 110(9), 1422–1428. https://doi.org/10.2105/AJPH.2020.305783
- Lee, K. H. (2020). Mental health and recreation opportunities. International Journal of Environmental Research and Public Health, 17(24), 9338. https://doi.org/10.3390/ijerph17249338
- Liu, X., & Desai, A. R. (2021). Significant reductions in crop yields from air pollution and heat stress in the United States. Earth's Future, 9(8), e2021EF002000. https://doi.org/10.1029/2021EF002000
- Madden, J. M., Shetty, P. S., Zhang, F., Briesacher, B. A., Ross-Degnan, D., Soumerai, S. B., & Galbraith, A. A. (2020). Risk factors associated with food insecurity in the Medicare population. JAMA Internal Medicine, 180(1), 144–147. https://doi.org/10.1001/jamainternmed.2019.3900
- Mayer, M., Gueorguieva, R., Ma, X., & White, M. A. (2019). Tobacco use increases risk of food insecurity: An analysis of continuous NHANES data from 1999 to 2014. Preventive Medicine, 126, 105765. https://doi.org/10.1016/j.ypmed.2019.105765
- McIntyre, L., Wu, X., Fleisch, V. C., & Emery, J. H. (2016). Homeowner versus non-homeowner differences in household food insecurity in Canada. Journal of Housing and the Built Environment, 31(2), 349–366. https://doi.org/10.1007/s10901-015-9461-6
- Nakaya, T., Charlton, M., Fotheringham, S., Lewis, P., & Brunsdon, C. (2014). GWR4 version 4.0. 80. Application for geographically weighted regression modelling. GWR4 development team.
- National Research Council. (2006). Food insecurity and hunger in the United States: An assessment of the measure. National Academies Press.
- Nord, M., Coleman-Jensen, A., & Gregory, C. (2014). Prevalence of US food insecurity is related to changes in unemployment, inflation, and the price of food (No. 1477-2017-3979).
- QGIS Development Team. (2019). QGIS geographic Information system. Open-Source Geospatial Foundation Project.
- Rivera, R. L., Dunne, J., Maulding, M. K., Wang, Q., Savaiano, D. A., Nickols-Richardson, S. M., & Eicher-Miller, H. A. (2018). Exploring the association of urban or rural county status and environmental, nutrition-and lifestyle-related resources with the efficacy of SNAP-Ed (supplemental nutrition assistance program-education) to improve food security. Public Health Nutrition, 21(5), 957–966. https://doi.org/10.1017/S1368980017003391
- Santarossa, S., Hill, A. B., Sitarik, A. R., Taylor, M., Hawkins, S., Scher, K., Sohaski, A., Baseer, M., Dombrowski, R., Plum, A., & Joseph, C. L. (2021). Food insecurity in Detroit: Exploring the relationship between patient-reported food insecurity and proximity to healthful grocery stores. Public Health Nutrition, 25(4), 954–963. https://doi.org/10.1017/S1368980021003128.
- Sarlio-Lahteenkorva, S., & Lahelma, E. (2001). Food insecurity is associated with past and present economic disadvantage and body mass index. The Journal of Nutrition, 131(11), 2880–2884. https://doi.org/10.1093/jn/131.11.2880
- Schwartz, N., Buliung, R., & Wilson, K. (2019a). Disability and food access and insecurity: A scoping review of the literature. Health & Place, 57, 107–121. https://doi.org/10.1016/j.healthplace.2019.03.011
- Schwartz, N., Tarasuk, V., Buliung, R., & Wilson, K. (2019b). Mobility impairments and geographic variation in vulnerability to household food insecurity. Social Science & Medicine, 243, 112636. https://doi.org/10.1016/j.socscimed.2019.112636
- Sharma, A. (2014). Spatial analysis of disparities in LDL-C testing for older diabetic adults: A socio-environmental framework focusing on race, poverty, and health access in Mississippi. Applied Geography, 55, 248–256. https://doi.org/10.1016/j.apgeog.2014.09.017
- Shobe, M. A., Narcisse, M. R., & Christy, K. (2018). Household financial capital and food security. Journal of Poverty, 22(1), 1–22. https://doi.org/10.1080/10875549.2017.1348426
- Shoff, C., Chen, V. Y. J., & Yang, T. C. (2014). When homogeneity meets heterogeneity: The geographically weighted regression with spatial lag approach to prenatal care utilization. Geospatial Health, 8(2), 557. https://doi.org/10.4081/gh.2014.45
- StataCorp. (2015). Stata Statistical software: Release 15. StataCorp LP.
- St-Germain, A. A. F., & Tarasuk, V. (2020). Homeownership status and risk of food insecurity: Examining the role of housing debt, housing expenditure and housing asset using a cross-sectional population-based survey of Canadian households. International Journal for Equity in Health, 19(1), 1–12. https://doi.org/10.1186/s12939-019-1102-3
- Tai, A. P., Martin, M. V., & Heald, C. L. (2014). Threat to future global food security from climate change and ozone air pollution. Nature Climate Change, 4(9), 817–821. https://doi.org/10.1038/nclimate2317
- Tarasuk, V., Mitchell, A., McLaren, L., & McIntyre, L. (2013). Chronic physical and mental health conditions among adults may increase vulnerability to household food insecurity. The Journal of Nutrition, 143(11), 1785–1793. https://doi.org/10.3945/jn.113.178483
- Tarasuk, V., St-Germain, A. A. F., & Mitchell, A. (2019). Geographic and socio-demographic predictors of household food insecurity in Canada, 2011–12. BMC Public Health, 19(1), 12. https://doi.org/10.1186/s12889-018-6344-2
- U.S. Census Bureau. (2018). Code lists, definitions, and accuracy. http://www.census.gov/programs-surveys/acs/technical-documentation /code-lists.html
- U.S. Census Bureau. (2019). QuickFacts. http://www.census.gov/quickfacts/AR
- Zhou, L., Chen, X., & Tian, X. (2018). The impact of fine particulate matter (PM2. 5) on China's agricultural production from 2001 to 2010. Journal of Cleaner Production, 178, 133–141. https://doi.org/10.1016/j.jclepro.2017.12.204
- Ziliak, J. P., & Gundersen, C. (2019). The state of senior hunger in America 2017: An annual report. National Foundation to End Senior Hunger.
- Ziliak, J. P., & Gundersen, C. (2020). The state of senior hunger in America 2018: An annual report. National Foundation to End Senior Hunger.