
ABSTRACT
We study the marine terraces of the southern side of the Sibari Plain in Northern Calabria (Italy) through the use of traditional and quantitative analyses of the Digital Terrain Model (DTM). The main aim of the present work consists in the extensive use of GIS tools that were never used before in the area, and in checking the applicability of this procedure. The terraced surfaces identified using photo interpretation and those recognized semi-automatically through the GIS tools were compared to finally produce a consensus map. In the final map, we identified 272 terraced surfaces and 62 morphological features associated with inner margins (i.e. paleoshorelines). The main map shows a well-developed flight of seven orders of marine terraces with elevation ranging from 45 to 360 m asl and age ranging from Marine Isotope Stage (MIS) 5a to 11.
1. Introduction
Spectacular flights of marine terraces mark the coastal landscape of southern Italy, and of the Calabria region (the toe of the Italian peninsula) in particular (CitationAntonioli et al., 2006; CitationBalescu et al., 1997; CitationCucci & Cinti, 1998; CitationCucci & Tertulliani, 2010; CitationDumas et al., 1987; CitationFerranti et al., 2009; CitationLucà et al., 2022; CitationSantoro et al., 2009). Marine terraces are prominent geomorphological features originated at paleo sea-levels during an interglacial highstand; in an uplifting region, a wave-cut platform will form during a highstand when the rate of global sea level rise slows down and matches that of the land uplift (CitationLajoie, 1986). Each wave-cut platform can be overlain by aggradational and progradational terrace deposits and is backed by a relict sea cliff. The inner edge (or shoreline angle), i.e. the intersection between platform and cliff, closely approximates the paleoshoreline and is the datum mapped to assess subsequent tectonic or isostatic deformation. The result of this process is a staircase landscape, like the one characterizing the Sibari Plain in northern Calabria (Italy), that indicates sustained uplift at least over the past 400–600 kyr (CitationCucci, 2004; CitationCucci & Cinti, 1998; CitationFerranti et al., 2009; CitationLucà et al., 2022; CitationSantoro et al., 2009). In this work, we present a detailed map of the marine terraces that mark the landscape of the southern side of the Sibari Plain. Although the uplift history in the study area is partially known, the basic novelty of the present work consists in the extensive use of technological tools that were never used before in the area, and in testing the reliability of this specific procedure. For analyzing and mapping landforms we combined the use of analogue (stereoscope) and digital (5 m pixel Digital Elevation Models – DEM data, Geographic Information Systems – GIS) techniques (CitationBowles & Cowgill, 2012; CitationBrunori et al., 2013), along with a field survey. The outcome of the use of this methodological approach is a map that can provide valuable tools for new studies about the characterization of active deformation processes and the forecasting of landscape evolution.
1.1. Study area, geology and tectonics
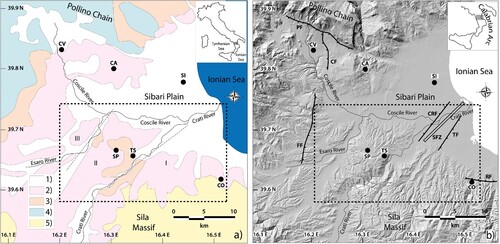
The geodynamic model commonly adopted for the Mediterranean region assumes NNW-SSE convergence between Eurasia and Africa-Adria continental plates, a process that started during Cretaceous (CitationArtemieva, 2023; CitationGvirtzmann & Nur, 1999; CitationJolivet & Faccenna, 2000; CitationMalinverno & Ryan, 1986; CitationWestaway, 1993). The same process caused southeastward rollback of the subducting slab located beneath the Southern Tyrrhenian Sea, well defined by seismicity (CitationAmato et al., 1993; CitationDellong et al., 2020; CitationSelvaggi & Chiarabba, 1995), tomography (CitationCimini, 1999; CitationDi Luccio et al., 2022; CitationLucente et al., 1999), and volcanism (CitationBarberi et al., 1973; CitationPalmiotto et al., 2022). The tectonic evolution of the Calabrian Arc is commonly ascribed to such plate convergence (CitationMalinverno & Ryan, 1986). Complex dynamics associated with subduction and rollback produced throughout the Calabrian Arc back-arc extension, widespread uplift, and relative subsidence in the major tectonic basins, where mainly normal seismogenic faults accommodate the internal deformation (CitationFaccenna et al., 2001). Located in the northeastern Calabrian Arc, the Sibari Plain is one of several alluvial plains that border the Italian Peninsula and the widest one in the Calabria region (). The plain is bounded by the Pollino Chain to the North, and by the Sila Massif and the northern Crati Basin to the South and West. The Pollino Chain is mainly formed by Mesozoic limestones and dolomites of the Campania-Lucania carbonate platform, while igneous and metamorphic rocks of the Calabride Complex formation constitute the Sila Massif (CitationBigi et al., 1983; a). During the Upper Pliocene-Middle Pleistocene the former Sibari Basin was progressively filled by fan deltas (CitationColella, 1988) and marine terrigenous sediments; these deposits are the terrains into which a well-developed suite of marine terraces is cut throughout the area, providing evidence for sustained uplift since the upper Pleistocene (CitationCucci, 2004, Citation2005; CitationCucci & Cinti, 1998; CitationFerranti et al., 2009; CitationLucà et al., 2022; CitationSantoro et al., 2009, Citation2013). An active submarine delta, like the middle Pleistocene one, is presently developing at the mouth of the Crati River (CitationColella & Normark, 1984). The upper part of the plain is filled by several hundred-meter-thick Holocene alluvial gravels, sands and silts, mostly originated by the three main rivers Crati, Coscile and Esaro (CitationCucci, 2005; CitationWestaway, 1993). The sedimentary sequences in the study area belong to the southern Apennines for what concerns the Pollino chain and to the Calabrian arc for what concerns the Sila Massif outcrops (). Compressional tectonics associated with plate collision shaped the area since the Miocene (CitationTansi et al., 2007; CitationVan Dijk et al., 2000); the resulting geology is a succession of thrust units and nappes, piled up and overthrusted during the Neogene, and eventually sliced by Quaternary high-angle strike-slip and extensional faults (b). Although scarce modern seismicity affects this area (CitationRovida et al., 2022), strong paleoseismological and historical evidence testifies to large magnitude earthquakes along faults located by the northern side of the Sibari Plain, namely the Castrovillari Fault (CitationCinti et al., 1997, Citation2002) and the Pollino Fault (CitationMichetti et al., 1997; CitationTertulliani & Cucci, 2014). Conversely, the southern side of the plain is bordered by the WNW-striking Corigliano-Rossano Fault (CitationGalli et al., 2010), whose present activity is debated, at least along its westernmost portion (CitationCucci, 2004; CitationGaladini et al., 2000). Finally, evidence of a NE-SW fault zone with recent activity has been observed in the middle of the plain as coseismic features in the Sybaris archaeological settlement by CitationCinti et al. (2015) and in geophysical acquisitions by CitationCianflone et al. (2018). Therefore, the area depicts a complex geotectonic environment, so a marine terrace study and analysis could contribute to assess the recent tectonic and environmental evolution of this specific sector.
Figure 1. A dashed rectangle indicates the study area. Black dots indicate the location of main villages: CV Castrovillari, CA Cassano allo Ionio, SI Sibari, SP Spezzano Albanese, TS Terranova da Sibari, CO Corigliano Calabro. (a) Simplified geological map of the Sibari Plain (modified from CitationCucci, 2004; CitationSantoro et al., 2009). Legend: 1 continental and marine deposits (Holocene-Upper Pleistocene); 2 marine terrigenous and fan deltas deposits (Middle Pleistocene-Upper Pliocene); 3 Liguride complex (Lower Cretaceous-Jurassic) and turbidites cover (Paleogene); 4 Campania-Lucania carbonate platform (Mesozoic); 5 Calabride Complex (Paleozoic). Roman numbers (I, II, III) indicate the three different sectors (bordered by dashed lines) where terrace analyses have been conducted. (b) Map of the main faults in the study area. Abbreviations: PF Pollino Fault (CitationMichetti et al., 1997), CF Castrovillari Fault (CitationCinti et al., 1997, Citation2002), FF Firmo Fault (CitationIthaca Working Group, 2019), CRF Crati Fault (CitationLanzafame & Tortorici, 1981), TF Timparelle Fault (CitationLanzafame & Tortorici, 1981), RF Rossano Fault (CitationGalli et al., 2010), SFZ Sybaris Fault Zone (CitationCinti et al., 2015).
2. Methodology
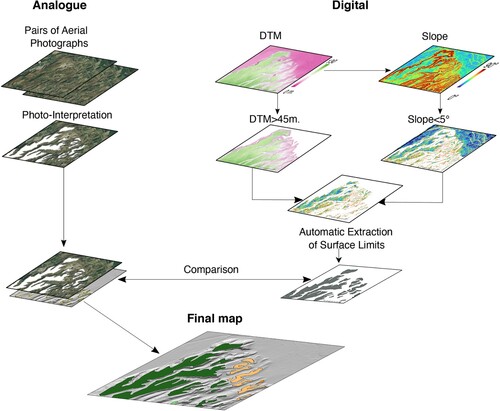
The methodology for mapping marine terraces in a coastal area is based on the identification of topographic features with low slope values, as a primary topographic signature. Then, group these surfaces as a function of their elevation with respect to the actual sea level and give them a chronological attribution. The first step of our work involved a detailed analysis of the morphological features from aerial photographs at the scale 1:33.000 (Black and White series, 1954-1955, Istituto Geografico Militare) and 1:70.000 (Volo Italia, 1994, Compagnia Generale Riprese aeree – CGR SpA), and from topographic maps at two different scales, 1:10.000 and 1:5.000, from Regione Calabria (http://geoportale.regione.calabria.it/). This step was followed by quality control through field surveys (when possible) and by the analysis of specific data available from the literature (e.g. datings, thickness of the continental deposits, sedimentological information). The mapped surfaces that ideally identify the terrace surfaces, isolated using analogue tools (stereoscope) and topographic maps, were digitalized using QGis tools (http://www.qgis.org) through the identification of the same morphological features on digital layers such as: (1) Digital Terrain Model (DTM, 5 meters/pixel, provided by Regione Calabria – http://geoportale.regione.calabria.it/ accessed on April 2022) and the derived shaded relief and slope map calculated using a 3 m × 3 m moving window (CitationMoore et al., 1993); and (2) digital aerial orthophoto (2012 national coverage acquisitions, 50 cm/pixel resolution distributed by the Italian Ministry of Ecological Transition – http://www.pcn.minambiente.it/mattm/servizio-wms/ – via information system web service technology-WMS, accessed on 4 April 2023). The methods followed for processing and mapping the marine terraces in the study area are outlined in .
Figure 2. Summary of the marine terrace mapping process. On the left side, the surfaces are recognized and drawn using photo-interpretation techniques of the aero stereo pairs. On the right, the surfaces are recognized semi-automatically through the quantitative analysis of the DTM (for elevations > 45 m). The ‘digital’ and the ‘analogue’ sets of polygons are then compared by the geologists, on the base of their knowledge of the territory and of direct inspections on the field, for a refinement of the limits and the attribution of the orders as an indicator of the relative terrace formation age.
Generally, the terraced surfaces in the Sibari Plain area slope seaward <5°, however, in certain cases the slope can increase up to 15° following the increase of the terrace age (CitationCucci, 2004; CitationFerranti et al., 2009; CitationLucà et al., 2022; CitationSantoro et al., 2009, Citation2013). The increase of slope with age is due to the burial of the inner edge and subsequent colluvium accumulation. Also, sea stacks, landslides, and gullies can locally increase terrace surface roughness (CitationBowles & Cowgill, 2012 and reference therein). In order to refine the extension of the directly observed polygons/terraces, we overlaid the georeferenced polygon shapes (terraced surfaces, see ), picked up using the stereoscope and matched with topographic maps, to the information extracted from slope digital maps, such as the flat surfaces with inclination values <5° (CitationBucci et al., 2016). After this phase, the polygon layers were processed using the Qgis zonal statistic function.
For each surface/polygon the tool extracts, from the pixels belonging to each polygon, the population of elevation values and calculates a zonal statistic. The principal outputs in the zonal statistics utilized in this work are: the Mean (the sum of the elevation values divided by the amount of values); the Median (the value separating the higher half from the lower half of a population of elevation values falling in the polygon/terrace), the Maximum, and the Minimum (the highest and lowest elevation value in each zone respectively). The statistical GIS analysis was employed to refine the extension of the polygons and the attribution of the relative elevation, especially when the field control was lacking; this tool also furnished a validation of the observation made by direct methods. In order to check the position of the ‘observed’ inner margins and to tentatively draw their path through the area, we performed tens of digital cross sections. The cross sections took advantage of the GIS profile tools and were realized using the Digital Terrain Model (DTM), 5 m/pixel. This technique not only allowed us to confirm the position of each singular inner margin in the area, drawn using direct observation, but also provided important hints on the interpretation of the path layout of these features. The profile tool proved useful to verify and refine the areal extention of the terraces.
3. Results
In the study area, the above described procedures allowed the identification of 272 terraced surfaces at elevations ranging from ∼45 to ∼360 m asl, grouped into seven different marine terraces (T1 to T7, lowermost to uppermost). We also recognized 62 remnants of inner margins belonging to marine terraces T1 to T6 whose elevations range between 50 and 275 m asl (see Main Map and ). The terraces are mainly of depositional origin; in particular, the most common facies association consists of beach or shallow-marine conglomerates and sands (beachface and shoreface). In places, a very thin veneer of non-marine (alluvial and colluvial) sediments overlies the marine terrace deposits.
Figure 3. (a) Panoramic view of the left side of the Crati Valley in the Terranova da Sibari surroundings. White letters (from ‘b’ to ‘i’) indicate the location of the corresponding pictures, with the field evidence of the terraces orders and relative details surveyed in the study area; (b) terraced surface of T7 order, overlayed by colluvium deposits; (c) coastal deposits of the T7 terraces; (d) fine sands and coastal deposits on a MIS9e platform, lithodomes holes are indicated by white arrows; (e) fine laminated sands deposits belonging to the T3 terrace order, the person for scale; (f) detail of the sands and coastal deposits of T3 terrace (height of the cliff about 4 m); (g) beach pebble conglomerates in brownish sandy matrix (T3); (h) in the foreground are visible the T6 and T7 terraced surfaces near the Terranova da Sibari village, in the background the alignment of the T2-T3 stacks of terraces on the west side of the Crati river, the picture is taken looking toward north-east, the horizon line is marked by the Sibari plain; (i) T3 terrace order, example of optimum state of preservation.
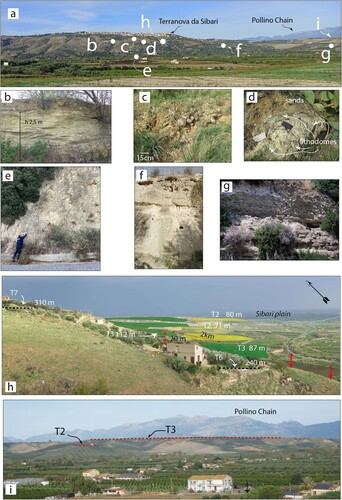
To reconstruct the history of uplift in this area we took advantage of the following evidence: (1) an Electronic Spin Resonance (ESR) age of 135 ± 20 ka for an in situ Cardium sp. (CitationSantoro, 2010; CitationSantoro et al., 2009) on T3, that allows correlation of this terrace with MIS5e; (2) an amino acid racemization (D/L ratio) age of 130 ka for an in situ Glycymeris sp. reported by CitationCucci (2004) close to Trebisacce (north of our study area), on a terrace associated with MIS5e morphologically correlated with our T3; and (3) the observed optimum state of preservation of T3 throughout the study area (see the Main Map and i), which confirms the hypothesis that the best expressed geomorphic surface is associated with the most prominent and constrained highstand of the paleo sea level record (+ 6 m asl, i.e. MIS5e; CitationWaelbroeck et al., 2002).
The above-described evidence (two datings and best preservation of the terrace associated with the MIS 5e) leads to an average uplift rate of 0.91 mm/yr (i.e. 113 m uplift over 124 ka, range 0.90-0.94 mm/yr, see ) for T3 in the study area. On the basis of the T3 – MIS5e correlation and assuming a comparable uplift rate we ascribe T2 to MIS5c and T1 to MIS5a of the paleo sea-level curve (CitationWaelbroeck et al., 2002). Although the subaerial erosion erased most of the inner edges associated with the highest terraces, we can rely on the optimal preservation of T3 for the reconstruction of the pattern of terraces T4 to T7. Therefore, following this rationale we attribute the four uppermost marine terraces to MIS7a, MIS8e, MIS9c, and MIS11, respectively, extending the chronology back to ∼ 400 ka (). These results are summarized in . The relatively high estimated uplift rate does not favor the possibility of reoccupation of marine terraces during different MIS in this area.
Figure 4. Chronological correlation between observed marine terraces and sea level peaks of the paleo sea-level curve (modified from CitationWaelbroeck et al., 2002), confidence interval marked by a grey area, marine isotope stages indicated in bold.
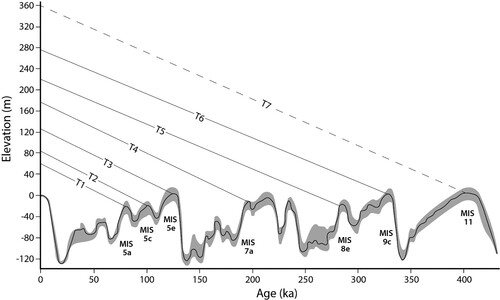
Table 1. Elevation values for each of the seven terrace orders as distributed in the three different sectors of the study area (I, II, III, as in Figure 1(a)). Data are obtained from direct observation and standard methodology for terraces analysis; the uplift rates derived from inner margins are indicated in bold, while the others are based on the maximum elevation of the surface. Marine Isotope Stages (MIS) are from the paleo sea-level curve from CitationWaelbroeck et al. (2002).
In we summarize the principal outputs of the zonal statistics analysis, carried out by dividing the study area into three geographical sectors homogeneous from the geo-lithological point of view, bounded by the Esaro and Crati rivers (a and inset in ). The comparison between the two sets of data in and , although obtained with different methodologies, displays a good agreement among the elevation values of the terrace orders (Min., Max., and Mean). Also, the data in both Tables enhances a slight increase in mean elevation of the terraces from Sector I to Sector III, i.e. from East to West. This observation stands for the T2, T3, T4 terraces which are surveyed throughout the area.
Table 2. Elevation values for each of the seven terrace orders as distributed in the three different sectors of the study area (I, II, III, as in (a)) obtained from the zonal statics analysis conducted with GIS tools (see text for details).
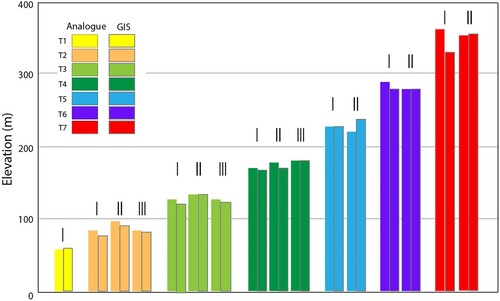
shows the bar diagram of elevations in the three sectors that highlights the peaks marking the elevation ranges of terrace levels. Values are plotted both for analogue-based and for GIS-based results.
Figure 5. Bar diagram of the terrace elevations for terrace level (from T1 to T7) in the three sectors (I,II,III). The data obtained from analogue analyses are represented with a plain colored box, while the data from GIS analysis are shown by a contoured box.
The comparison of the Mean and Median elevation values for each terrace surface with both traditional and statistical methods provides support in deriving a consensus map, and in assigning the relative age to each mapped terrace.
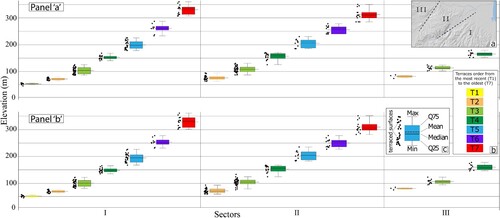
The final output of the analysis carried out both with traditional methods and with GIS tools is summarized in . In particular, the terrace elevation values in panel ‘a’ have been assigned based on photo interpretation and the field surveys (see black dots in panel ‘a’). These are the values employed to perform statistical analysis, represented by the colored boxes indicating the distribution of terrace elevations/orders. The upper and lower box limits Q75 and Q25 represent the 75th and 25th quartiles of elevation values, respectively. We also symbolize the statistical values of Maximum, Minimum, Mean and Median. In the lower panel ( panel ‘b’) the elevation values of each surface (represented by black dots) are the mean values of the DEM pixels falling inside the photo-interpreted traced terrace limits; in this case the statistics are carried out on these latter derived values. This analysis allows a cross-check control for the level of robustness of the classes of elevation assigned to each terrace. When the elevation of the surface is greater than the Q25-Q75 thresholds, the corresponding surface was reanalyzed in order to verify the terrace assignment or to check for possible geological/tectonic origins of the observed misplaced position in the staircase suite of terrace elevations. When no evidence of misplacement or geological/tectonic causes was found, the final choice was left to the operator’s judgment. A general look at the graph shows that the statistical data positively supports the analysis carried out using traditional cartography. However, the digital extraction cannot be the only tool for the recognition of the terraced surfaces and for the consequent attribution of the relative age of formation.
Figure 6. Summary of the results of the statistical analyses of the terrace elevations from direct observations (panel ‘a’) and from the statistical zonal analysis (panel ‘b’). In the inset ‘a’ we show the three geographic sectors (I, II, III). Inset ‘b’: the marine terraces are grouped around intervals of elevation and classified in orders from the most recent (1st) to the oldest (7th), each order is represented with different colors as in the legend and in the Main Map. Inset ‘c’: each terraced surface belonging to a group is represented with a black dot located at its altitude; the colored box indicates the distribution of terraces elevations, and the upper and lower box limits (Q75 and Q75) represent the 75th and 25th quartiles of the elevation values distribution of all the surfaces belonging to the group. We also symbolize the statistical values of Maximum, Minimum, Mean and Median values.
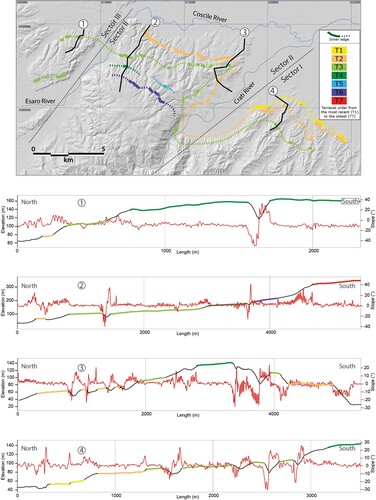
GIS tools were also employed to further verify the position of the inner margins and the geometry and extension of the terraces; examples of these analyses are shown in . In the figure, we show four key-profiles drawn to intercept the maximum number of terraced surfaces and inner margins over the three sectors. A general observation is that T3 and T4 surfaces are the most developed and best preserved terraces, especially in sector III. The combination of the profile and the slope patterns allowed us to trace the pattern of the six paleoshorelines (), that in general mimic the southern edge of the Sibari Plain. However, our detailed reconstruction enhances a particular behavior between sectors I and II where the paleoshorelines contour a ∼ 2 km-wide embayment across the Crati valley ((h) and 7), in a sector where no marine terraces were previously mapped. This embayment is testified by the trace of the T2 and T3 inner margins, which means that the paleo gulf originated at least from 124 ka (age of the oldest terrace showing this pattern).
Figure 7. (up) Map of the inner margins derived from observations and GIS analyses. The contour of the paleoshorelines in the map is dashed when inferred. Black lines indicate the traces of four topographic profiles. (down) Profiles 1–4 (see map for location): the red line represents the slope value. The elevation profile is represented in colors corresponding to the terrace order (as in the main map) when it intersects the surface of the terrace.
3.1. Discussion and conclusions
Apart from the different purposes and techniques of previous investigations on the ∼ 70 km-long stretch of the Ionian coast of Northern Calabria (CitationCucci, 2004, Citation2005; CitationCucci & Cinti, 1998; CitationFerranti et al., 2009; CitationLucà et al., 2022; CitationSantoro et al., 2009, Citation2013), some key points from those studies can be summarized as follows: an uplift history that dates to the Middle Pleistocene (∼ 0.6 ka); average uplift rates in the range 0.7-1.0 mm/yr; and a general northeastward tilt of the region with tilt rate in the range 3-6 × 10⁻³ m km−1 ka−1. In particular, CitationCucci (2004), CitationFerranti et al. (2009) and CitationSantoro et al. (2009), who focused also on the southern side of the Sibari Plain, found between three and ten different strandlines at elevations in the range 40-440 m asl. However, there is great variability in paleogeographic reconstruction, which is mainly due to the scale of previous surveys and to the available chronological constraints, and traditional methods of mapping alone are no longer sufficient to accurately map paleoshoreline and terraces. The application of GIS tools and technologies can provide a fundamental contribution through numerical/quantitative analysis of the terraced surfaces to produce an independent, unbiased cross-check and integration of mapping with improvement in the final outcome (see Main Map).
An interesting example of this evidence is the novel mapping of several terrace remnants belonging to seven different orders (along with some inner margins), that overlook the innermost sides of the Crati River valley (between sectors I and II in Main Map and in ). A common feature to these remnants is their very limited extent, which possibly hampered their initial identification through aerial photographs and topographic maps alone. The use of GIS tools highlighted the presence of these small terrace surfaces. These terraces were never mapped before and were successfully validated by the field survey ().
To get a comprehensive view of the consensus mapping we plotted a chart of the surfaces’ and inner margins’ distributions along the coastline vs the elevation along the coastline () along a vertical section. The terraces and inner margins are projected along a direction that follows the ideal pattern of paleoshorelines; this was technically resolved approximating the mean direction of the paleoshorelines to four segments (‘A’ to ‘D’), as shown in a.
Figure 8. (a) Map of the seven orders of marine terraces recognized in the area. In the graphical representation we subdivided the map in four differently colored areas. Terraces and inner margins falling within each colored area are projected along a direction (‘A’ to ‘D’) approximating that of the paleo coastline in each sector. (b) marine terrace distribution along coastlines vs elevation along coastline. Blue lines locate the position of Esaro and Crati rivers.
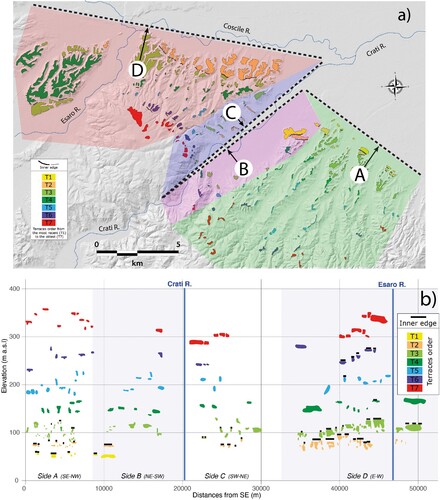
This visualization allows a better understanding of the different features characterizing the surveyed area. The lowermost terrace T1 is only observed along the zone East of the Crati River; its absence in the other sectors may have occurred for several reasons: (1) the combined erosional forcing of the Crati, Coscile and Esaro rivers that erased the T1 remnants; (2) the difficulty in tracing – with traditional methods – low elevation surfaces in an area exploited for agricultural activities; and (3) the small difference in elevation between terraced surfaces and alluvial plain, and the consequent difficulty to resolve this difference through DEM analysis. Further final considerations on the relation between the geo-lithological/tectonic setting and morphological aspects of the terraces remains can be derived from our results (, , 8b and Main Map). At a first glance, it appears that the level of preservation of terraces depends on the geo-lithological properties and the characteristics of erosional processes associated with the pattern and energy of the hydrographic network. In fact, terrace remnants are more preserved where they are developed on the Middle Pleistocene fan deltas (see ). On the contrary, the terraces are less preserved when they are lying on Paleozoic and/or Mesozoic terrains.
The widths of the terraces may be influenced by topographic slope and tectonic uplift rates rather than wave – and rock-related properties (CitationMatsumoto et al., 2022). This aspect is visible in the profiles of , where the terrace width positively correlates with decreasing topographic slope, and with increasing tectonic uplift rate (see and ). The graphical visualization of allows us to appreciate the uplift rate behavior in the area, as the boxes, representing individual terraces, show an averaged higher position from sector I to sector III. This may be associated with the proximity to the axis of maximum regional uplift (i.e. the axis of the Apennine Chain).
In conclusions, our use of the classical and digital methodologies for marine terrace mapping allowed a better definition of some features of the paleogeography of the area and of uplift patterns. In particular, GIS tools followed by subsequent field analysis allowed the first mapping of a paleo gulf originated about 124 ka and encircling the modern Crati valley close by the southern edge of the Sibari Plain. The detail of the present mapping can provide hints for studies of neotectonics in the area. As already demonstrated in previous studies (CitationCucci, 2004; CitationCucci & Cinti, 1998; CitationSantoro et al., 2013), possible differences of terrace elevations in closely spaced inner margins in the study area could be attributed to repeated activity along some of the (seismogenic) faults that mark this territory.
Software
Morphometric and statistical analyses:
QGIS 3.22.9-Białowieża, QGIS.org, 2023. QGIS Geographic Information System. QGIS Association. http://www.qgis.org
Statistical analyses ad graphics drawings:
R Statistical Software (v4.1.2; R Core Team 2021)
Graphic postprocessing:
Inkscape ver 1.0.2. Inkscape Project, 2020. Inkscape, Available at: https://inkscape.org. Adobe Illustrator (Adobe Inc., 2019)
Adobe Photoshop (Adobe Inc., 2019)
JOMap_FinaleV2.pdf
Download PDF (111.9 MB)Acknowledgements
Thorough criticism and helpful suggestions and comments by reviewers Mike Shand and Simone Racano, and by the Associate Editor Jasper Knight helped improving the manuscript.
Disclosure statement
No potential conflict of interest was reported by the author(s).
Data availability statement
The authors state that the data that supports the findings of the study in the article and in the supplementary materials are freely available.
Additional information
Funding
References
- Amato, A., Alessandrini, B., Cimini, G. B., & Selvaggi, G. (1993). Active and remnant subducted slabs beneath Italy: Evidence from seismic tomography and seismicity. Annali di Geofisica, XXXVI(2), 201–214.
- Antonioli, F., Ferranti, L., Lambeck, K., Kershaw, S., Verrubbi, V., & Dai Pra, G. (2006). Late pleistocene to holocene record of changing uplift rates in southern Calabria and northeastern Sicily (southern Italy, central Mediterranean Sea). Tectonophysics, 422(1-4), 23–40. https://doi.org/10.1016/j.tecto.2006.05.003
- Artemieva, I. M. (2023). Back-arc basins: A global view from geophysical synthesis and analysis. Earth-Science Reviews, 236. https://doi.org/10.1016/j.earscirev.2022.104242
- Balescu, S., Dumas, B., Gueremy, P., Lamothe, M., Lhenaff, R., & Raffy, J. (1997). Thermoluminescence dating tests of pleistocene sediments from uplifted marine shorelines along the southwest coastline of the Calabrian Peninsula (southern Italy). Palaeogeography, Palaeoclimatology, Palaeoecology, 130(1-4), 25–41. https://doi.org/10.1016/S0031-0182(96)00119-8
- Barberi, F., Gasparini, P., Innocenti, F., & Villari, L. (1973). Volcanism of the southern tyrrhenian Sea and its geodynamic implications. Journal of Geophysical Research, 78(23), 5221–5232. https://doi.org/10.1029/JB078i023p05221
- Bigi, G., Cosentino, D., Parotto, M., Sartori, R., & Scandone, P. (1983). Structural model of Italy, quad. Ricerca Scientifica, 114(3).
- Bowles, C. J., & Cowgill, E. (2012). Discovering marine terraces using airborne LiDAR along the mendocino-sonoma coast, northern California. Geosphere, 8(2), 386–402. https://doi.org/10.1130/GES00702.1
- Brunori, C. A., Civico, R., Cinti, F. R., & Ventura, G. (2013). Characterization of active fault scarps from LiDAR data: A case study from central Apennines (Italy). International Journal of Geographical Information Science, 27(7), 1405–1416. https://doi.org/10.1080/13658816.2012.684385
- Bucci, F., Mirabella, F., Santangelo, M., Cardinali, M., & Guzzetti, F. (2016). Photo-geology of the montefalco quaternary basin, umbria, central Italy. Journal of Maps, 12, 314–322. https://doi.org/10.1080/17445647.2016.1210042
- Cianflone, G., Cavuoto, G., Punzo, M., Dominici, R., Sonnino, M., Fiore, V. D., Pelosi, N., Tarallo, D., Lirer, F., Marsella, E., Critelli, S., & Rosa, R. D. (2018). Late quaternary stratigraphic setting of the Sibari Plain (southern Italy): hydrogeological implications. Marine and Petroleum Geology, 97, 422–436. https://doi.org/10.1016/j.marpetgeo.2018.07.027
- Cimini, G. B. (1999). P-wave deep velocity structure of the Southern Tyrrhenian Subduction Zone from nonlinear teleseismic traveltime tomography. Geophysical Research Letters, 26(24), 3709–3712. https://doi.org/10.1029/1999GL010907
- Cinti, F., Moro, M., Pantosti, D., Cucci, L., & D’Addezio, G. (2002). New constraints on the seismic history of the castrovillari fault in the Pollino gap (calabria, southern Italy). Journal of Seismology, 6, 199–217. https://doi.org/10.1023/A:1015693127008
- Cinti, F. R., Alfonsi, L., D'Alessio, A., Marino, S., & Brunori, C. A. (2015). Faulting and ancient earthquakes at sybaris archaeological site, ionian calabria, southern Italy. Seismological Research Letters, 86(1), 245–254. https://doi.org/10.1785/02201401071
- Cinti, F. R., Cucci, L., Pantosti, D., D’Addezio, G., & Meghraoui, M. (1997). A major seismogenic fault in a ‘silent area’: The castrovillari fault (southern Apennines, Italy). Geophysical Journal International, 130(3), 595–605. https://doi.org/10.1111/j.1365-246X.1997.tb01855.x
- Colella, A. (1988). Fault-controlled marine Gilbert-type fan deltas. Geology, 16(11), 1031–1034. https://doi.org/10.1130/0091-7613(1988)016<1031:FCMGTF>2.3.CO;2
- Colella, A., & Normark, W. R. (1984). High-resolution side-scanning sonar survey of delta slope and inner fan channels of Crati submarine fan (Ionian Sea). Mem. Soc. Geol. It., 27, 481–486.
- Cucci, L. (2004). Raised marine terraces in the northern calabrian Arc (southern Italy): a ∼600000 years-long geological record of regional tectonic deformation, Ann. Geophysics, 47(4), 1391–1406.
- Cucci, L. (2005). Geology versus myth: The Holocene evolution of the Sybaris Plain. Annals of Geophysics, 48(6), 1017–1033.
- Cucci, L., & Cinti, F. R. (1998). Regional uplift and local tectonic deformation recorded by the quaternary marine terraces on the Ionian coast of Northern Calabria (Southern Italy). Tectonophysics, 292(1-2), 67–83. https://doi.org/10.1016/S0040-1951(98)00061-4
- Cucci, L., & Tertulliani, A. (2010). The Capo Vaticano (Calabria) coastal terraces and the 1905 M7 earthquake: The geomorphological signature of regional uplift and coseismic slip in southern Italy. Terra Nova, 22(5), 378–389. https://doi.org/10.1111/j.1365-3121.2010.00961.x
- Dellong, D., Klingelhoefer, F., Dannowski, A., Kopp, H., Murphy, S., Graindorge, D., Margheriti, L., Moretti, M., Barreca, G., Scarfì, L., Polonia, A., & Gutscher, M.-A. (2020). Reply to comment by A. Argnani on “geometry of the deep calabrian subduction from wide-angle seismic data and 3-D gravity modeling”. Geochemistry, Geophysics, Geosystems, 21(8), https://doi.org/10.1029/2020GC009223
- Di Luccio, F., Palano, M., Chiodini, G., Cucci, L., Piromallo, C., Sparacino, F., Ventura, G., Improta, L., Cardellini, C., Persaud, P., Pizzino, L., Calderoni, G., Castellano, C., Cianchini, G., Cianetti, S., Cinti, D., Cusano, P., De Gori, P., De Santis, A., … Zuccarello, L. (2022). Geodynamics, geophysical and geochemical observations, and the role of CO2 degassing in the Apennines. Earth-Science Reviews, 234, 104236. https://doi.org/10.1016/j.earscirev.2022.104236
- Dumas, B., Gueremy, P., Lhenaff, R., & Raffy, J. (1987). Rates of uplift as shown by raised quaternary shorelines in southern calabria (Italy). Z. Geomorphology 63, 119–132.
- Faccenna, C., Becker, T. W., Lucente, F. P., Jolivet, L., & Rossetti, F. (2001). History of subduction and back-arc extension in the central Mediterranean. Geophysical Journal International, 145, 809–820. https://doi.org/10.1046/j.0956-540x.2001.01435.x
- Ferranti, L., Santoro, E., Mazzella, M., Monaco, C., & Morelli, D. (2009). Active transpression in the northern calabria Apennines, southern Italy. Tectonophysics, 476(1-2), 226–251. https://doi.org/10.1016/j.tecto.2008.11.010
- Galadini, F., Meletti, C., & Vittori, E. (2000). Stato delle conoscenze sulle faglie attive in italia: Elementi geologici di superficie. In F. Galadini, C. Meletti, & A. Rebez (Eds.), Le ricerche del GNDT nel campo della pericolosità sismica (1996-1999), Int. Rep. CNR-GNDT, pp. 397.
- Galli, P., Spina, V., Ilardo, I., & Naso, G. (2010). Evidence of active tectonics in southern Italy: The Rossano fault (Calabria). In P. Guarnieri (Ed.), Recent progress on earthquake geology, pp. 49–78, Nova Science Publishers, Inc.
- Gvirtzmann, Z., & Nur, A. (1999). Plate detachment, asthenosphere upwelling, and topography across subduction zones. Geology, 27(6), 563–566.
- Ithaca working group. (2019). “ITHACA (ITaly HAzard from Capable faulting),” in A database of active capable faults of the Italian territory (ISPRA Geological Survey of Italy).
- Jolivet, L., & Faccenna, C. (2000). Mediterranean extension and the Africa-eurasia collision. Tectonics, 19(6), 1095–1106. https://doi.org/10.1029/2000TC900018
- Lajoie, K. R. (1986). Coastal tectonics. In T. M. Usselman (Ed.), Studies in geophysics; active tectonics (pp. 95–124). National Academy Press.
- Lanzafame, G., & Tortorici, L. (1981). La tettonica recente della Valle del Fiume Crati (Calabria). Geografia Fisica e Dinamica Quaternaria, 4, 11–22. 5 ff., 1 t.
- Lucà, F., Brogno, A., Tripodi, V., & Robustelli, G. (2022). Terrace morpho-sedimentary sequences on the sibari plain (Calabria, Southern Italy): implication for Sea level and tectonic controls. Geosciences, 12, 211. https://doi.org/10.3390/geosciences12050211
- Lucente, F. P., Chiarabba, C., & Cimini, G. B. (1999). Tomographic constraints on the geodynamic evolution of the Italian region. Journal of Geophysical Research: Solid Earth, 104(B9), 20307–20327. https://doi.org/10.1029/1999JB900147
- Malinverno, A., & Ryan, W. B. F. (1986). Extension in the tyrrhenian Sea and shortening in the Apennines as result of arc migration driven by sinking of the litosphere. Tectonics, 5(2), 227–245. https://doi.org/10.1029/TC005i002p00227
- Matsumoto, H., Young, A. P., & Carilli, J. E. (2022). Modeling the relative influence of environmental controls on marine terrace widths. Geomorphology, 396, 107986. https://doi.org/10.1016/j.geomorph.2021.107986
- Michetti, A. M., Ferreli, L., Serva, L., & Vittori, E. (1997). Geological evidence for strong historical earthquakes in an “aseismic” region: The Pollino case (Southern Italy). Journal of Geodynamics, 24, 67–86.
- Moore, I. D., Lewis, A., Gallant, J. C. (1993). Terrain properties: Estimation methods and scale effects. In A. J. Jakeman (Ed.), Modeling change in environmental systems (pp. 189–214). Wiley.
- Palmiotto, C., Braga, R., Corda, L., Bella, L. D., Ferrrante, V., Loreto, M. F., & Muccini, F. (2022). New insights on the fossil arc of the tyrrhenian back-Arc basin (Mediterranean Sea). Tectonophysics, 845. https://doi.org/10.1016/j.tecto.2022.229640
- Rovida, A., Locati, M., Camassi, R., Lolli, B., Gasperini, P., & Antonucci, A., eds. (2022). Italian parametric earthquake catalogue (CPTI15), version 4.0. Istituto nazionale di geofisica e vulcanologia (INGV). https://doi.org/10.13127/CPTI/CPTI15.4.
- Santoro, E. (2010). Deformazione recente e attiva (Pleistocene Medio – Olocene) nell'area costiera compresa tra la Sila e il Pollino (confine calabro-lucano): analisi integrata di tipo morfotettonico e strutturale [PhD thesis]. University of Catania.
- Santoro, E., Ferranti, L., Burrato, P., Mazzella, M. E., & Monaco, C. (2013). Deformed Pleistocene marine terraces along the Ionian Sea margin of southern Italy: Unveiling blind fault-related folds contribution to coastal uplift. Tectonics, 32(3), 737–762. https://doi.org/10.1002/tect.20036
- Santoro, E., Mazzella, M. E., Ferranti, L., Randisi, A., & Napolitano, E. (2009). Raised coastal terraces along the ionian Sea coast of northern calabria, Italy, suggest space and time variability of tectonic uplift rates. Quaternary International, 206(1-2), 78–101. https://doi.org/10.1016/j.quaint.2008.10.003
- Selvaggi, G., & Chiarabba, C. (1995). Seismicity and Pwave velocity image of the Southern Tyrrhenian subduction zone, Geophysical Journal International, 121, 818–826.
- Tansi, C., Muto, F., Critelli, S., & Iovine, G. (2007). Neogene–quaternary strike-slip tectonics in the central calabrian Arc (southern Italy). Journal of Geodynamics, 43(3), 393–414. https://doi.org/10.1016/j.jog.2006.10.006
- Tertulliani, A., & Cucci, L. (2014). New insights on the strongest historical earthquake in the Pollino region (southern Italy). Seismological Research Letters, 85(3), 743–751. https://doi.org/10.1785/0220130217
- Van Dijk, J. P., Bello, M., Brancaleoni, G. P., Cantarella, G., Costa, V., Frixa, A., Golfetto, F., Merlini, S., Riva, M., Torricelli, S., Toscano, C., & ZerillI, A. (2000). A regional structural model for the northern sector of the calabrian Arc (southern Italy). Tectonophysics, 324(4), 267–320. https://doi.org/10.1016/S0040-1951(00)00139
- Waelbroeck, C., Labeyrie, L., Michel, E., Duplessy, J. C., McManus, J. F., Lambeck, K., Baldon, E., & e Labracherie, M. (2002). Sea-level and deep water temperature changes derived from benthic foraminifera isotopic records. Quaternary Science Reviews, 21(1-3), 295–305. https://doi.org/10.1016/S0277-3791(01)00101-9
- Westaway, R. (1993). Quaternary uplift of southern Italy. Journal of Geophysical Research: Solid Earth, 98(B12), 21741–21772. doi:10.1029/93JB01566