
ABSTRACT
Disparities in geographic access to medication for opioid use disorder (OUD) are well documented. Further, historical implications of systemic racism and of the longstanding War on Drugs in the United States have driven both social and spatial inequities in access to treatment. This work builds on a previously published spatial access methodology that uses a gravity-based variant of the enhanced two-step floating catchment area model, to determine how OUD pharmacotherapy accessibility varies nationally at the census tract level. Medication for OUD (MOUD) accessibility scores are then analyzed by rurality and racial/ethnic segregation. The Getis-Ord Gi* statistic was used to identify clusters of high or low accessibility to MOUD, while the interaction index was used as a measure of segregation to assess the racial/ethnic population distribution. The results of the clustering statistic, and the associated significance values were then compared to rurality and interaction using the Chi-Square test to determine if hot or cold areas of access are independent of rurality and racial/ethnic spatial distributions. Lastly, the percentage of buprenorphine providers at capacity by census tract was calculated using the binary ‘at-capacity’ data attribute associated with each SAMHSA buprenorphine provider record. The results demonstrate distinct spatial variability of MOUD resources based on urbanicity and racial makeup that have significant implications for intervention or policy reform that seeks to encourage equal access to both treatment modalities.
Highlights
MOUD access varies by racial segregation and rurality
Black segregated and integrated Black-White urban communities have greater accessibility to both MOUD types
White urban communities have significantly lower levels of spatial access to MOUD
Low urban MOUD induction and adherence rates of minority populations are likely not strongly driven by spatial access, rather structural, political, physical, and social components are more influential to intervention uptake.
97% of buprenorphine providers were at their patient capacity limit prior to the end of the federal DATA waiver process in June 2023.
1. Introduction
The decades-long opioid overdose epidemic has been a persistent problem in the United States. Recently, illicit manufactured fentanyl (IMF), found in cocaine, methamphetamine, and counterfeit prescription pills (O’Donnell, Citation2021), is expanding the demographic impact of the opioid overdose epidemic (Lippold et al., Citation2019). Fentanyl is now the leading cause of death for Americans ages 18–49 (CitationMiroff et al., 2022). Nearly all racial/ethnic groups have experienced an increase in opioid-involved overdose deaths, however, Black and Hispanic populations experienced the highest rates of increase from 2015–2017 (+103%, + 57% respectively), with fentanyl-specific deaths having increased for Black populations more than 140% from 2011–2016 (Guerrero et al., Citation2022; Lippold et al., Citation2019). In response, federal priorities across administrations have focused on increasing access to treatment. Affordability, availability, accessibility, accommodation, and acceptability all contribute to patient access and the uptake of a health service in a population (Penchansky & Thomas, Citation1981; Wyszewianski, Citation2002). However, current research suggests access to evidence-based treatment for opioid use disorder (OUD) may be racially and socio-economically divided (Guerrero et al., Citation2022). The agency charged with regulating Medication for Opioid Use Disorder (MOUD), the Substance Abuse and Mental Health Services Administration (SAMHSA), has declared that a ‘two-tiered treatment system exists where buprenorphine is accessed by Whites, high income, and privately insured, while methadone is accessed by people of color, low-income, and publicly insured’ (SAMHSA, Citation2020, 9). Further, Blacks and Hispanics have lower referral, induction, adherence, and completion rates of MOUD treatment than Whites (Entress, Citation2021; Hansen et al., Citation2016; Hollander et al., Citation2021; Lagisetty et al., Citation2019; Stahler et al., Citation2021). Importantly, research has found that equity of access to both types of MOUD empowers patient choice and ultimately improves adherence and health outcomes (Yarborough et al., Citation2016). The multifaceted components of access are especially important in the context of addiction treatment given that the history of the initial implementation of MOUD services has contributed to both the social and spatial inequities in access to MOUD treatment. This article investigates census tract-level patterns of racial segregation and rurality as potential explanations of differential accessibility to the current standard of care for OUD across the contiguous U.S.
Methadone treatment via Opioid Treatment Programs (OTPs) gained popularity in the early 1970s as President Nixon’s top weapon in fighting the War on Drugs in response to the heroin epidemic of the 1960s and 1970s (Hansen et al., Citation2020; James & Jordan, Citation2018). Methadone clinics were (and still are) highly regulated and surveilled and were introduced in urban centers with large populations of low-income Black and Latino heroin-dependent people with the goal of controlling unruly populations and reducing crime, given that addiction was seen as inextricably linked to crime (Hansen & Roberts, Citation2012; Raz, Citation2017). As such, methadone clinics and drug use became racialized and stigmatized, associated with moral depravity, narcotic criminalization, and control (Hansen et al., Citation2020). ‘Not In My Back Yard’ protests were held by affluent neighborhood associations to prevent these clinics from locating nearby, further alienating the treatment modality (Hansen & Roberts, Citation2012). The crack-cocaine epidemic of the 1980s and 1990s brought about the Anti-Drug Abuse Act of 1986 which set mandatory sentencing 100 times harsher for crack (more commonly used by Blacks) convictions than for powder cocaine (predominantly used by Whites), although the drugs are pharmacologically almost identical (James & Jordan, Citation2018). Further, although prevalence estimates for illicit drug use are roughly equivalent for non-Hispanic Black and White populations, Black Americans are significantly more likely to be incarcerated for drug offenses (Alexander, Citation2020; Netherland et al., Citation2016). Media and political discourse coded drug use to Black criminals (Burston & Jones, Citation1995) with the appropriate response deemed militarized policing and mass incarceration (James & Jordan, Citation2018). However, with the evolution of the current opioid epidemic, the racial gradient of opioid overdose began to shift; by 2010 the overdose mortality rate for Whites was more than twice that of Blacks (Alexander et al., Citation2018; Hansen et al., Citation2020). According to Hansen et al. (Citation2020), congressional debates of the late 1990s emphasized a new kind of drug user that was young, suburban, not hardcore, and – implicitly – White; this warranted the push to legalize buprenorphine prescriptions in private doctors’ offices rather than in DEA regulated methadone clinics. In an effort to destigmatize addiction, National Institute on Drug Abuse (NIDA) researchers reclassed drug abuse as ‘Chronic Relapsing Brain Disease’, a chronic medical illness of the brain (McLellan et al., Citation2000). Congressional records of the Drug Addiction Treatment Act include statements from Alan Leshner, then director of NIDA, testifying that buprenorphine rather than methadone was uniquely appropriate for the new suburban drug user (CitationCongressional Record, 1999). The FDA approved Suboxone® (buprenorphine) for OUD treatment in 2002 (Drug Enforcement Administration, Citation2022). The pharmaceutical marketing strategy for Suboxone® used an internet based physician referral service and public service announcements and commercials featuring white, middle class people with OUD (Nguemeni Tiako, Citation2021). This led to $1.4 billion in sales of Suboxone for 2012 alone (CESAR FAX, Citation2012) among consumers that were almost entirely White and predominantly prescription opioid dependent (Netherland et al., Citation2016).
In this MOUD intervention problem space, the structural influence of the War on Drugs likely influenced the spatial distribution of MOUD resources as well as MOUD access for different population groups. Structural determinants of health refer to cultural norms, policies, institutions, and practices that affect the distribution of power and resources across the population, engendering health inequities among population health groups and intersections of those groups (Crear-Perry et al., Citation2021). Recent literature analyzing racial patterns of regional availability of MOUD in the U.S. have supported the narrative that people of color have greater availability of methadone and Whites have greater availability of buprenorphine providers, suggesting equity in access to buprenorphine may still be a locational issue. An analysis of Medicare Part D beneficiaries found counties with a higher percentage of Black and Hispanic enrollees were less likely to have availability of buprenorphine compared to those with a higher percentage of White enrollees (Abraham et al., Citation2019). Goedel et al. (Citation2020) examined county-level capacity to buprenorphine and methadone by racial/ethnic segregation indices and found that more isolated Black and Hispanic populations have greater availability of methadone. Conversely, increased Whiteness (areas with greater proportion of White residents) was associated with greater availability of buprenorphine (Goedel et al., Citation2020). A study of buprenorphine distribution by race and Medicaid expansion over three-digit ZIP codes found buprenorphine growth from 2007–2017 to be disproportionately greater for ZIP3s with higher percentages of White residents (Schuler et al., Citation2021). However, other studies have contradicted this association of Whiteness and high buprenorphine availability and accessibility. A study analyzing MOUD availability by county differed from previous research in that methadone and buprenorphine availability were found to be higher for counties with greater percentages of Black and Hispanic populations (Corry et al., Citation2022). Joudrey et al. (Citation2022) measured drive time to MOUD providers and facilities by ZIP code tabulated areas (ZCTAs) within the US and found racial and ethnic minority status was correlated with greater accessibility to MOUD.
Rural communities have also been found to have poor accessibility to MOUD (Joudrey et al., Citation2022; Mitchell et al., Citation2022), despite many rural areas experiencing a disproportionate amount of overdose deaths (Palombi et al., Citation2018) and an increased risk of opioid harms (Kolak et al., Citation2020; Van Handel et al., Citation2016). Overall, the intersection of race, ethnicity, rurality and MOUD accessibility is an area in need of improved understanding to facilitate more equitable MOUD intervention distribution. The prior studies associating buprenorphine with Whiteness may have methodological limitations. In many of the studies, the enumeration units used of analysis were geographically large – thus aggregating rural, urban, racial, and ethnic communities, and likely masking the nuance of MOUD distribution in relation to those attributes. This analysis aims to contribute to this research area with the use of a spatial accessibility analysis to methadone and buprenorphine providers vis-à-vis racial and ethnic segregation and rurality at the census tract level.
2. Data
Population and demographic data for the 48 contiguous states were obtained from the US Census Bureau American Community Survey (ACS) data products. Population weighted census tract centroids and segregation indices were generated using ACS 2015–2019 5-Year Demographic and Housing Estimates (DP05) at the Block Group level. Routing data was based on average weekday travel times derived from Esri StreetMap Premium. MOUD location data was obtained from the SAMHSA in November 2022. This consisted of 1,958 opioid treatment programs (OTPs), providing methadone, and 49,686 DATA-waived providers (providing buprenorphine) in the contiguous 48 states; DATA-waiver capacity limits are also derived from this dataset. DATA-waivers permit the treatment of 30 or 100 patients; once a provider meets this limit, they are at capacity and cannot accept new patients for this service. OTP capacity limits are not presently available. The spatial accessibility analysis to MOUD providers is performed on the population group aged 18–64 and results are standardized per 100,000 persons.
Patient capacity limits of buprenorphine providers to date have been regulated by the federal DATA waiver process, however, the Omnibus bill passed by Congress in December 2022 eliminates the federal requirement of the DATA-waiver, and other restrictions associated with the waiver such as patient limits, beginning in June of 2023 (CitationSubstance Abuse and Mental Health Services Administration, 2023). Many providers in the field have conveyed that the removal of the DATA-waiver is long overdue, but that the policy change is not a silver bullet in improving patient access to MOUD (CitationLarson, 2023). Rather, the immediate impact may be minimal as workforce challenges around addiction treatment prescribers will take time to address (CitationLarson, 2023). Further, the Omnibus bill also included the Medication Access and Training Expansion (MATE) Act which requires practitioners to complete eight hours of training on opioid or other substance use disorders, unless the provider is a physician holding specific board certification(s) in addiction medicine, in order to prescribe buprenorphine (CitationSubstance Abuse and Mental Health Services Administration, 2023). Thus, while patient capacity limits have been removed, the recent buprenorphine treatment landscape is of value in understanding the current distribution of buprenorphine availability.
Rurality classification is based on rural-urban commuting area (RUCA) four category classification developed by the Washington, Wyoming, Alaska, Montana, Idaho (WWAMI) Rural Health Research Center. This classification subdivides rural into three separate rural types with the premise that large rural towns with, for instance, a population of 30,000 people and many medical providers should be treated differently than a place with a population of 1,000 and is isolated from urban places, as these communities differ greatly (WWAMI Rural Health Research Center, Citationn.d.). Using this classification, 83% of tracts class as urban focused, 9% large rural, 4% small rural, and 4% isolated.
3. Methods
This work builds on a previously published spatial access methodology that uses a gravity-based variant of the enhanced two-step floating catchment area model, where distance decay is derived from empirically assessed willingness to travel for patients visiting opioid treatment programs (OTPs), to determine how OUD pharmacotherapy accessibility varies nationally at the census tract level (Mitchell et al., Citation2022). That work suggested but did not fully pursue the racial disparities in access, and that gap in the literature is addressed here.
Spatial accessibility scores for OTPs, providing methadone, and buprenorphine providers were generated with 2022 SAMHSA location data at the census tract level following the methodology of Mitchell et al. (Citation2022). The accessibility index for OTPs and buprenorphine providers is equivalent to n facilities or providers, respectively, per 100,000 persons aged 18-64; the buprenorphine waiver accessibility index is equivalent to n waivers per 100,000 persons aged 18-64. For example, an accessibility score of 1 would equate to 1 OTP facility or 1 DATA-waived provider or 1 DATA-waiver per 100,000 people aged 18–64 years. Accessibility scores were then analyzed by rurality and by racial/ethnic population distribution. More specifically, statistically significant spatial clusters of provider accessibility, ‘hot spots’, or lack thereof, ‘cold spots’, were identified using the Getis-Ord Gi* local spatial clustering statistic. This statistic requires a conceptualization of the spatial relationship to define the spatial weight between each pair of tracts. Since there is no existing literature that suggests a ‘best practice’ in determining the correct neighborhood for use in the context of MOUD accessibility, this research takes both a logic- and data-driven approach to determine the spatial weights that are employed. Logically, the distance to provider is already captured in the accessibility measure as described in Mitchell et al. (Citation2022). Therefore, clusters of those values are best described by contiguity, although the nature of the contiguity around those points is unknown. To assess this relationship, sensitivity analyses were conducted using the Delaunay triangulation method of conceptualizing spatial relationships, applying Voronoi triangles between census tract centroids, and defining neighbors as locations that share a triangle edge. To assess racial/ethnic population distribution, the interaction index was used as a measure of segregation as it describes the probability that a minority person shares a unit area with a majority person and is computed as the minority weighted average of the minority proportion in each unit area (Goedel et al., Citation2020; Iceland et al., Citation2002; Massey & Denton, Citation1988). The interaction measure was applied to Black and White, and Hispanic and non-Hispanic population groups using the formulation depicted in (Citation2020). The interaction index varies from 0 to 1, with lower values indicating higher segregation. Results were divided into tertiles of low, medium, and high minority and majority interaction. However, tracts containing no minority population yield a 0/high-segregation score as well. Therefore, a separate class was created to categorize the no minority tracts to stratify segregation types (minority-segregated in comparison to majority-segregated). The z-scores generated from the clustering statistic, and associated significance values were then compared to rurality and interaction using the Chi-Square test to determine if hot or cold areas of access are independent of rurality and racial/ethnic spatial distributions. Lastly, the percentage of buprenorphine providers at capacity by census tract was calculated using the binary ‘at-capacity’ data attribute associated with each SAMHSA buprenorphine provider record.
4. Results
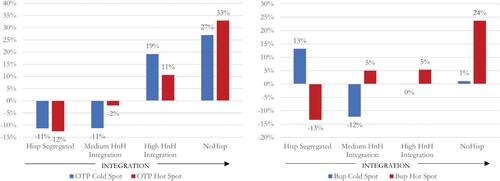
Maps 2 and 3 in (Main Map) depict the spatial results of the Getis-Ord Gi* local spatial clustering statistic for treatment accessibility of OTPs (providing methadone) and buprenorphine providers. A Chi-Square analysis of hot and cold spots by Black and White interaction index shows Black segregated tracts have a significant excess of hot spots (clusters of high-high access) and deficit of cold spots (clusters of low-low access) for both methadone and buprenorphine treatment accessibility (). Notably, tracts with no Black population have 82% and 40% more cold spots of OTPs and buprenorphine providers, respectively, than the expected frequency if there were no relationship between the variables. However, when looking at Hispanic to not Hispanic (HnH) populations by tract in comparison to MOUD hot and cold spots (), no clear trend was discerned. Segregated Hispanic populations were found to have a deficit of hot and cold clusters of OTP accessibility, which indicates that there are few groupings of census tracts with either high or low accessibility. As the Hispanic and non-Hispanic population become more integrated, both hot and cold spots increase above expected values, implying that population heterogeneity is related to high and low accessibility clusters across the country. Buprenorphine provider accessibility trends stratified by HnH interaction show a more distinct pattern of segregated Hispanic populations with an excess of cold spots to buprenorphine providers, and as integration with the non-Hispanic population increases, the number of hot spots of buprenorphine increases.
Figure 1. Maps presenting different depictions of availability and accessibility to MOUD providers in the US. Map 1displays the scarcity of buprenorphine providers with available patient capacity under the DATA-waiver regulation that ended in June 2023. Maps 2 and 3 show the results of the cluster analysis on the spatial accessibility of OTP facilities and buprenorphine providers, respectively, at census tract level.
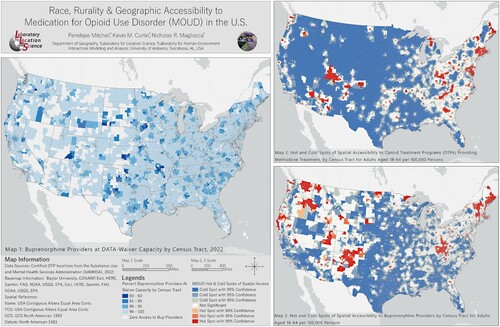
Figure 2. OTP (left) and Buprenorphine (right) provider hot and cold spot percent difference from observed and expected values by Black White racial interaction index within census tracts.
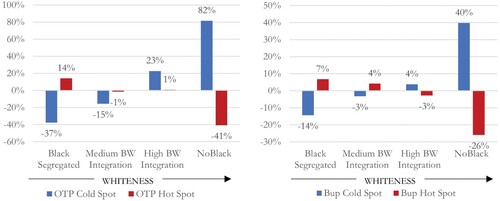
Figure 3. OTP (left) and Buprenorphine (right) provider hot and cold spot percent difference from observed and expected values by Hispanic – not Hispanic ethnic interaction index within census tracts.
To gain more insights into accessibility trends, race and ethnicity interaction classes are further stratified by four class RUCA status (). For OTPs, results show that Black segregated urban tracts have the greatest excess of hot spots and the greatest deficit of cold spots. This pattern dissipates with increased interaction with Whites and reverses in urban no-Black areas to show an excess of cold spots and deficit of hot spots. Similarly, buprenorphine accessibility results show medium Black-White integrated urban and Black segregated urban communities, to have the greatest excess of hot spots and deficit of cold spots, while urban tracts with no Black population again show a deficit of accessibility. All rural areas irrespective of the interaction index maintain low access patterns to both treatment types. However, as Whiteness increases in rural areas, the excess of cold spots and deficit of hot spots is reduced, indicating better access is associated with Whiteness in rural areas. This trend is also found when looking at mean and median accessibility values across Black-White interaction and rurality (). Urban Black segregated and Urban medium Black-White Interaction tracts have the best OTP and Buprenorphine access values; these accessibility values decrease with increased Whiteness. Conversely, MOUD accessibility in large and small rural tracts improves with increased Whiteness, particularly for buprenorphine access. Isolated rural tracts do not show a clear pattern of accessibility in comparison to Black-White interaction. With regard to buprenorphine provider capacity, accessibility by DATA-waiver capacity (‘Bup Wvr Ai’) values increase with increased Whiteness for urban, large rural, and small rural tracts.
Figure 4. OTP and Buprenorphine (Bup) provider hot and cold spot percent difference from observed and expected values by Black and White racial interaction within census tracts and stratified by 4 class RUCA status.
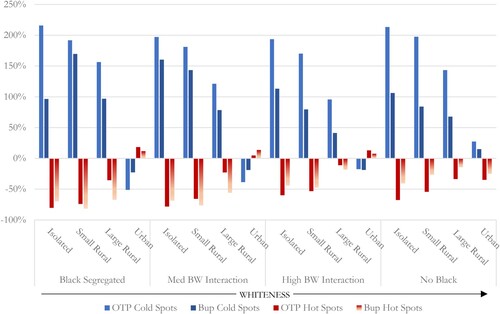
Table 1. Mean, count, and median values of accessibility by census tracts for OTPs (OTPAi), Buprenorphine Providers (Bup Ai), and Buprenorphine Waivers (Bup Wvr Ai) per 100,000 adults aged 18-64. Results are stratified by Black and White racial interaction (BW Intrxn) and four class RUCA status. Percent tracts at waiver capacity and with zero buprenorphine access is also shown.
When examining MOUD accessibility in comparison to Hispanic/not-Hispanic interaction across rurality a different trend emerges in urban areas (). In this instance, an excess of hot spots and a deficit of cold spots to both OTP and Buprenorphine increase as the majority population increases in urban areas; this is likely attributed to Black urban communities aggregated in the majority population. Hispanic segregated urban tracts show a moderate deficit of hot and cold spots, indicating more neutral, dispersed high- and low-access tracts. The finding of higher MOUD accessibility values associated with an increase in majority population is reinforced by the results in . Mean and median OTP, Buprenorphine, and Buprenorphine waiver access values increase with increase in majority population.
Figure 5. OTP and Buprenorphine (Bup) provider hot and cold spot percent difference from observed and expected values by Hispanic not-Hispanic ethnic interaction within census tracts and stratified by 4 class RUCA status.
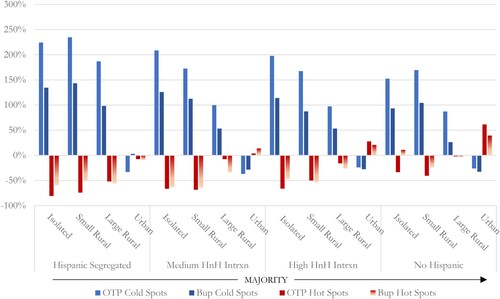
Table 2. Mean, count, and median values of accessibility by census tracts for OTPs (OTPAi), Buprenorphine Providers (Bup Ai), and Buprenorphine Waivers (Bup Wvr Ai) per 100,000 adults aged 18-64. Results are stratified by Hispanic and Not Hispanic (HnH Intrxn) ethnic interaction and four class RUCA status. Percent tracts at waiver capacity and with zero buprenorphine access is also shown.
Lastly, it is important to note that upon examination of the empirical spatial data of buprenorphine providers utilized in this analysis, provider capacity across racial, ethnic interaction and rurality measures was nearly maxed out across the US. 97% of buprenorphine providers had met their capacity and could not accept new patients. 56% of providers had a 30-patient limit, with the remaining 44% of providers at a 100-patient limit. Map 1 in (Main Map) illustrates the lack of available capacity under DATA-waiver limits across the country.
5. Discussion
The results of the accessibility analysis conducted in this study demonstrate distinct spatial variability of MOUD resources based on urbanicity and racial makeup that have significant implications for intervention or policy reform that seeks to encourage equal access to both treatment modalities. Contrary to recent literature, segregated Black and integrated Black White urban communities were found to have greater accessibility to both MOUD types than segregated White urban communities. The finding here that urban Black communities have high availability of accessible MOUD providers also supports the results of the Joudrey et al. (Citation2022) study which measured MOUD availability by drive time and found MOUD availability to be high for urban minority communities at the ZCTA level. Both of these studies suggest that the availability, or supply, of accessible MOUD providers is not the barrier to MOUD access for urban Black communities. Conversely, accessible MOUD supply is likely a key issue to MOUD access in rural communities.
The results presented here provide a snapshot of buprenorphine accessibility and availability prior to the passage of the Omnibus bill which eliminated the DATA waiver process. This last snapshot shows in the face of a burgeoning overdose crisis, almost all buprenorphine providers were at patient capacity. While the removal of the capacity constraint is a significant step forward in improving MOUD availability, buprenorphine availability hinges on the supply of primary care providers – providers not historically employed in addiction treatment and who are in a short supply (Association of American Medical Colleges, Citation2021). The primary care provider shortage exacerbates the scarcity of MOUD availability. The results of this study are relevant despite the elimination of the DATA-waiver given that the workforce challenges around MOUD treatment providers will take time to address.
Other points of friction in MOUD intervention uptake may relate to structural, political, physical, and social determinants. These determinants can interact in complex ways to hinder MOUD access and provide broader context and potential root causes to this problem space. The War on Drugs criminalized drug addiction predominantly within communities of color with punitive treatment provided as the resolution (Hansen et al., Citation2020; James & Jordan, Citation2018). The initial implementation of racially biased MOUD treatments created a structural path dependence reinforcing the punitive treatment environment associated with methadone treatment and likely is a point of friction in MOUD uptake in communities of color. Political determinants relevant here relate to MOUD affordability. Individuals covered by Medicaid may face barriers to accessing buprenorphine or methadone depending on state policy (Dickson-Gomez et al., Citation2022), and on the willingness of providers to accept Medicaid – a recent study found 52% of buprenorphine providers accept Medicaid (Knudsen & Studts, Citation2019), with rural buprenorphine providers being more likely to accept Medicaid than urban (Andrilla et al., Citation2020). Rural communities often have physical determinants that cause lower availability of accessible MOUD providers. Urbanicity and rurality, by means of population density, are drivers of MOUD availability via market suitability, while rural areas have a unique susceptibility to opioid harms. Social determinants relating to the impact of unmet health-related social needs (HRSNs) such as homelessness, inconsistent access to food, and exposure to violence is linked to poor health and healthcare utilization (Billioux et al., Citation2017; Kushel et al., Citation2001) and likely contributes to poor MOUD uptake. Overall, spatial access to MOUD does not directly promote induction and adherence to MOUD treatment, particularly in urban areas. Instead, complex interactions among these determinants strongly influence MOUD outcomes, often creating and/or reinforcing racial and ethnic biases.
6. Limitations
This work has several limitations. The gravity-based spatial accessibility model maintains a uniform assumption of distance decay across all community types while travel behavior likely varies across communities as well as the urban-rural continuum. Further, the Rosenblum et al. (Citation2011) study which provides the empirical basis for the distance decay estimation has limitations which may lead to the over estimation of willingness to travel to OTPs. For example, willingness to travel among patients interested in methadone but unable to engage in treatment is not captured; data was derived from a cross-sectional convenience sample of OTP enrollees from 84 facilities; survey participants could include someone in treatment for a week or numerous years; and a survey response rate was not included. Moreover, all OTPs provided within the SAMHSA directory were included in this analysis, but some providers may provide detoxification-only services. In 2012, SAMHSA documented the proportion of detoxification-only providers as 1% of total OTP providers (CitationSubstance Abuse and Mental Health Services Administration & Center for Behavioral Health Statistics and Quality, 2014). Therefore, the OTP dataset may include a small proportion of detoxification-only providers, thus the results of this analysis may overestimate the number of providers offering methadone treatment. Moreover, OTP capacity is not included in the accessibility analysis and may also lead to overestimation of OTP accessibility given that the accessibility measure is contingent on capacity. With regard to buprenorphine providers, SAMHSA does not include all waivered providers within their directory dataset thus some providers could be missing from this analysis. With regard to the Getis-ord Gi* clustering statistic, although the determination of the spatial weights is justified here, it is possible that other conceptualizations of the spatial relationships could logically be conceived and would either confirm or refute the findings presented here. Lastly, the four-category urban-rural classification scheme may overestimate urbanicity within the urban-focused class.
7. Conclusions
This research explores census tract-level patterns of racial/ethnic segregation and rurality as potential explanations of differential access to MOUD across the contiguous US. Distinct spatial patterns of MOUD access by racial interaction and rurality were identified. Contrary to the premise that Black communities have spatial access to methadone treatment and White communities have spatial access to buprenorphine treatment – which suggests achieving equity in access to buprenorphine is a locational issue – this research found segregated Black and integrated Black White urban communities to have greater accessibility to both MOUD types than White urban communities which were found to have significantly less spatial access. However, another key finding is related to the heterogeneity of accessibility based on race and rurality. Rural accessibility to MOUD is problematic across racial and ethnic interaction levels, however, rural accessibility to buprenorphine improved with increasing Whiteness or majority population. Low urban MOUD induction and adherence rates of minority populations are likely not strongly driven by spatial access and availability, rather structural, political, physical, and social determinants may be more influential to intervention uptake. At the same time rural MOUD access problems are likely more strongly driven by locational access. Future research is needed to explore the complexity of drivers, feedbacks, and relationships related to induction and adherence to MOUD treatment to examine how the structural, political, physical, and social determinants of health may cause friction points in MOUD implementation. Relatedly, future research on the overdose risk environment is needed so interventions including wrap around services (e.g. medical and social services) can be spatially optimized – leveraging existing urban MOUD locations and strategically recommending new rural sites – to maximize intervention appropriateness and the ability to engage with underserved populations.
Software
The authors used ArcGIS Pro 2.9.5, including the spatial statistics toolbox and the network analyst extension to generate the maps in this article. ArcGIS StreetMap Premium was utilized for routing data. Additionally, ArcGIS Notebooks, built on top of the Jupyter Notebook were used for python functionality. Arcpy, Pandas, ArcGIS.features.GeoAccessor, Scipy, and Matplotlib libraries were key python packages used in the analyses.
JoM Combined Layout2.pdf
Download PDF (73.2 MB)Disclosure statement
No potential conflict of interest was reported by the author(s).
Data availability statement
The data that support the findings of this study are available from the corresponding author, P. Mitchell, upon reasonable request.
References
- Abraham, A. J., Adams, G. B., Bradford, A. C., & Bradford, W. D. (2019). County-level access to opioid use disorder medications in medicare Part D (2010-2015). Health Services Research, 54(2), 390–398. https://doi.org/10.1111/1475-6773.13113
- Alexander, M. (2020). The New Jim crow: Mass incarceration in the age of colorblindness: Vol. Tenth anniversary edition. The New Press. http://libdata.lib.ua.edu/login?url=https://search.ebscohost.com/login.aspx?direct=true&db=nlebk&AN=2088758&site=eds-live&scope=site.
- Alexander, M. J., Kiang, M. V., & Barbieri, M. (2018). Trends in black and white opioid mortality in the United States, 1979–2015. Epidemiology (Cambridge, Mass.), 29(5), 707–715. https://doi.org/10.1097/EDE.0000000000000858
- Andrilla, C. H. A., Jones, K. C., & Patterson, D. G. (2020). Prescribing practices of nurse practitioners and physician assistants waivered to prescribe buprenorphine and the barriers they experience prescribing buprenorphine. The Journal of Rural Health, 36(2), 187–195. https://doi.org/10.1111/jrh.12404
- Association of American Medical Colleges. (2021). The complexities of physician supply and demand: Projections from 2019 to 2034.
- Billioux, A., Verlander, K., Anthony, S., & Alley, D. (2017). Standardized screening for health-related social needs in clinical settings: The accountable health communities screening tool. Centers for Medicare and Medicaid Services National Academy of Medicine Perspectives, 7(5), https://doi.org/10.31478/201705b
- Burston, B. W., & Jones, D. (1995). Drug use and African Americans: Myth versus reality. Journal of Alcohol & Drug Education, 40(2), 19.
- CESAR FAX. (2012). Suboxone® sales estimated to reach $1.4 billion in 2012 – more than Viagara® or Adderall® (49 Vol. 21). Center for Substance Abuse Research, University of Maryland.
- Congressional Record, Volume 145, Part 1—STATEMENTS ON INTRODUCED BILLS AND JOINT RESOLUTIONS. (1999). https://www.govinfo.gov/content/pkg/CRECB-1999-pt1/html/CRECB-1999-pt1-Pg1459-3.htm.
- Corry, B., Underwood, N., Cremer, L. J., Rooks-Peck, C. R., & Jones, C. (2022). County-level sociodemographic differences in availability of two medications for opioid use disorder: United States, 2019. Drug and Alcohol Dependence, 236, 109495. https://doi.org/10.1016/j.drugalcdep.2022.109495
- Crear-Perry, J., Correa-de-Araujo, R., Lewis Johnson, T., McLemore, M. R., Neilson, E., & Wallace, M. (2021). Social and structural determinants of health inequities in maternal health. Journal of Women's Health, 30(2), 230–235. https://doi.org/10.1089/jwh.2020.8882
- Dickson-Gomez, J., Weeks, M., Green, D., Boutouis, S., Galletly, C., & Christenson, E. (2022). Insurance barriers to substance use disorder treatment after passage of mental health and addiction parity laws and the affordable care act: A qualitative analysis. Drug and Alcohol Dependence Reports, 3, 100051. https://doi.org/10.1016/j.dadr.2022.100051
- Drug Enforcement Administration. (2022). BUPRENORPHINE (Trade Names: Buprenex®, Suboxone®, Subutex®,Zubsolv®, Sublocade®, Butrans®). https://www.deadiversion.usdoj.gov/drug_chem_info/buprenorphine.pdf.
- Elrod, J. K., & Fortenberry, J. L. (2017). The hub-and-spoke organization design revisited: A lifeline for rural hospitals. BMC Health Services Research, 17(S4), 795. https://doi.org/10.1186/s12913-017-2755-5
- Entress, R. M. (2021). The intersection of race and opioid use disorder treatment: A quantitative analysis. Journal of Substance Abuse Treatment, 131, 108589. https://doi.org/10.1016/j.jsat.2021.108589
- Goedel, W. C., Shapiro, A., Cerdá, M., Tsai, J. W., Hadland, S. E., & Marshall, B. D. L. (2020). Association of racial/ethnic segregation with treatment capacity for opioid use disorder in counties in the United States. JAMA Network Open, 3(4), e203711–e203711. https://doi.org/10.1001/jamanetworkopen.2020.3711
- Guerrero, E. G., Amaro, H., Khachikian, T., Zahir, M., & Marsh, J. C. (2022). A bifurcated opioid treatment system and widening insidious disparities. Addictive Behaviors, 130, 107296. https://doi.org/10.1016/j.addbeh.2022.107296
- Hansen, H., Parker, C., & Netherland, J. (2020). Race as a Ghost Variable in (White) Opioid Research. Science Technology and Human Values, 45(5), 848–876. https://doi.org/10.1177/0162243920912812
- Hansen, H., & Roberts, S. K. (2012). Two tiers of biomedicalization: Methadone, buprenorphine, and the racial politics of addiction treatment. In J. Netherland (Ed.), Critical perspectives on addiction (Vol. 14, pp. 79–102). Emerald Group Publishing. https://www-emerald-com.libdata.lib.ua.edu/insight/content/doi/10.1108S1057-6290(2012)0000014008/full/pdf?title=two-tiers-of-biomedicalization-methadone-buprenorphine-and-the-racial-politics-of-addiction-treatment.
- Hansen, H., Siegel, C., Wanderling, J., & DiRocco, D. (2016). Buprenorphine and methadone treatment for opioid dependence by income, ethnicity and race of neighborhoods in New York City. Drug and Alcohol Dependence, 164, 14–21. https://doi.org/10.1016/j.drugalcdep.2016.03.028
- Hollander, M. A. G., Chang, C.-C. H., Douaihy, A. B., Hulsey, E., & Donohue, J. M. (2021). Racial inequity in medication treatment for opioid use disorder: Exploring potential facilitators and barriers to use. Drug and Alcohol Dependence, 227, 108927. https://doi.org/10.1016/j.drugalcdep.2021.108927
- Iceland, J., Weinberg, D. H., & Steinmetz, E. (2002). Racial and Ethnic Residential Segregation in the United States: 1980-2000 [Series CENSR-3]. U.S. Census Bureau.
- James, K., & Jordan, A. (2018). The opioid crisis in black communities. Journal of Law, Medicine & Ethics, 46(2), 404–421. https://doi.org/10.1177/1073110518782949
- Joudrey, P. J., Kolak, M., Lin, Q., Paykin, S., Anguiano Jr, V., & Wang, E. A. (2022). Assessment of community-level vulnerability and access to medications for opioid use disorder. JAMA Network Open, 5(4), e227028. https://doi.org/10.1001/jamanetworkopen.2022.7028
- Knudsen, H. K., & Studts, J. L. (2019). Physicians as mediators of health policy: Acceptance of medicaid in the context of buprenorphine treatment. The Journal of Behavioral Health Services & Research, 46(1), 151–163. https://doi.org/10.1007/s11414-018-9629-4
- Kolak, M. A., Chen, Y.-T., Joyce, S., Ellis, K., Defever, K., McLuckie, C., Friedman, S., & Pho, M. T. (2020). Rural risk environments, opioid-related overdose, and infectious diseases: A multidimensional, spatial perspective. International Journal of Drug Policy, 85, 102727. https://doi.org/10.1016/j.drugpo.2020.102727
- Komaromy, M., Duhigg, D., Metcalf, A., Carlson, C., Kalishman, S., Hayes, L., Burke, T., Thornton, K., & Arora, S. (2016). Project ECHO (Extension for Community Healthcare Outcomes): A new model for educating primary care providers about treatment of substance use disorders. Substance Abuse, 37(1), 20–24. https://doi.org/10.1080/08897077.2015.1129388
- Kushel, M. B., Vittinghoff, E., & Haas, J. S. (2001). Factors associated with the health care utilization of homeless persons. JAMA, 285(2), 200–206. https://doi.org/10.1001/jama.285.2.200
- Lagisetty, P. A., Ross, R., Bohnert, A., Clay, M., & Maust, D. T. (2019). Buprenorphine treatment divide by race/ethnicity and payment. JAMA Psychiatry, 76(9), 979–981. https://doi.org/10.1001/jamapsychiatry.2019.0876
- Larson, C. (2023, March 3). It’s not ‘magic’: Ending the X-waiver alone unlikely to Fix MAT’s access problem. Behavioral Health Business. https://bhbusiness.com/2023/03/03/its-not-magic-ending-the-x-waiver-alone-unlikely-to-fix-mats-access-problem/.
- Lippold, K. M., Jones, C. M., Olsen, E. O., & Giroir, B. P. (2019). Racial/ethnic and Age group differences in opioid and synthetic opioid–involved overdose deaths Among adults aged ≥18 years in metropolitan areas — United States, 2015–2017. MMWR. Morbidity and Mortality Weekly Report, 68(43), 967–973. https://doi.org/10.15585/mmwr.mm6843a3
- Massey, D. S., & Denton, N. A. (1988). The dimensions of residential segregation. Social Forces, 67(2), 281–315. https://doi.org/10.2307/2579183
- McLellan, A. T., Lewis, D. C., O’Brien, C. P., & Kleber, H. D. (2000). Drug dependence, a chronic medical illness: Implications for treatment, insurance, and outcomes evaluation. JAMA, 284(13), 1689–1695. https://doi.org/10.1001/jama.284.13.1689
- Metzl, J. M., & Hansen, H. (2014). Structural competency: Theorizing a new medical engagement with stigma and inequality. Social Science & Medicine (1982), 103, 126–133. https://doi.org/10.1016/j.socscimed.2013.06.032
- Miroff, N., Higham, S., Rich, S., Georges, S., & O’Connor, E. P. (2022, December 12). Cause of death: Washington faltered as fentanyl gripped America. Washington Post. https://www.washingtonpost.com/investigations/interactive/2022/dea-fentanyl-failure/.
- Mitchell, P., Samsel, S., Curtin, K. M., Price, A., Turner, D., Tramp, R., Hudnall, M., Parton, J., & Lewis, D. (2022). Geographic disparities in access to Medication for Opioid Use Disorder across US census tracts based on treatment utilization behavior. Social Science & Medicine, 302, 114992. https://doi.org/10.1016/j.socscimed.2022.114992
- Netherland, J., Hansen, H., & Hansen, H. B. (2016). The War on drugs that wasn’t: Wasted whiteness, “dirty doctors,” and race in media coverage of prescription opioid misuse. Culture, Medicine, and Psychiatry, 40(4), 664–686. https://doi.org/10.1007/s11013-016-9496-5
- Nguemeni Tiako, M. J. (2021). Addressing racial & socioeconomic disparities in access to medications for opioid use disorder amid COVID-19. Journal of Substance Abuse Treatment, 122, 108214. https://doi.org/10.1016/j.jsat.2020.108214
- O’Donnell, J. (2021). Trends in and characteristics of drug overdose deaths involving illicitly manufactured fentanyls — United States, 2019–2020. MMWR. Morbidity and Mortality Weekly Report, 70), https://doi.org/10.15585/mmwr.mm7050e3
- Palombi, L. C., St Hill, C. A., Lipsky, M. S., Swanoski, M. T., & Lutfiyya, M. N. (2018). A scoping review of opioid misuse in the rural United States. Annals of Epidemiology, 28(9), 641–652. https://doi.org/10.1016/j.annepidem.2018.05.008
- Penchansky, R., & Thomas, J. W. (1981). The concept of access: Definition and relationship to consumer satisfaction. Medical Care, 19(2), 127–140. https://doi.org/10.1097/00005650-198102000-00001
- Raz, M. (2017). Treating addiction or reducing crime? Methadone maintenance and drug policy under the nixon administration. Journal of Policy History, 29(1), 58–86. https://doi.org/10.1017/S089803061600035X
- Rosenblum, A., Cleland, C. M., Fong, C., Kayman, D. J., Tempalski, B., & Parrino, M. (2011). Distance traveled and cross-state commuting to opioid treatment programs in the United States. Journal of Environmental and Public Health, https://doi.org/10.1155/2011/948789
- Schuler, M. S., Dick, A. W., & Stein, B. D. (2021). Growing racial/ethnic disparities in buprenorphine distribution in the United States, 2007-2017. Drug and Alcohol Dependence, 223, 108710. https://doi.org/10.1016/j.drugalcdep.2021.108710
- Stahler, G. J., Mennis, J., & Baron, D. A. (2021). Racial/ethnic disparities in the use of medications for opioid use disorder (MOUD) and their effects on residential drug treatment outcomes in the US. Drug and Alcohol Dependence, 226, 108849. https://doi.org/10.1016/j.drugalcdep.2021.108849
- Substance Abuse and Mental Health Services Administration. (2020). The opioid crisis and the black/African American population: An urgent issue (Publication No. PEP20-05-02-001). Office of Behavioral Health Equity. https://store.samhsa.gov/product/The-Opioid-Crisis-and-the-Black-African-American-Population-An-Urgent-Issue/PEP20-05-02-001
- Substance Abuse and Mental Health Services Administration. (2023, April 25). Removal of DATA Waiver (X-Waiver) Requirement. https://www.samhsa.gov/medications-substance-use-disorders/removal-data-waiver-requirement.
- Substance Abuse and Mental Health Services Administration, & Center for Behavioral Health Statistics and Quality. (2014). Services Offered by Outpatient-Only Opioid Treatment Programs: 2012 (The N-SSATS Report). https://www.samhsa.gov/data/sites/default/files/NSSATS%20_SR_162/NSSATS%20_SR_162/NSSATS-SR162-OpioidOOTx-2014.htm.
- Van Handel, M. M., Rose, C. E., Hallisey, E. J., Kolling, J. L., Zibbell, J. E., Lewis, B., Bohm, M. K., Jones, C. M., Flanagan, B. E., Siddiqi, A.-E.-A., Iqbal, K., Dent, A. L., Mermin, J. H., McCray, E., Ward, J. W., & Brooks, J. T. (2016). County-level vulnerability assessment for rapid dissemination of HIV or HCV infections among persons who inject drugs, United States. JAIDS Journal of Acquired Immune Deficiency Syndromes, 73(3), 323–331. https://doi.org/10.1097/QAI.0000000000001098
- WWAMI Rural Health Research Center. (n.d.). Rural Urban Commuting Area Codes Data. Retrieved April 24, 2023, from https://depts.washington.edu/uwruca/ruca-uses.php.
- Wyszewianski, L. (2002). Access to care: Remembering old lessons. Health Services Research, 37(6), 1441–1443. https://doi.org/10.1111/1475-6773.12171
- Yarborough, B. J. H., Stumbo, S. P., McCarty, D., Mertens, J., Weisner, C., & Green, C. A. (2016). Methadone, buprenorphine and preferences for opioid agonist treatment: A qualitative analysis. Drug and Alcohol Dependence, 160, 112–118. https://doi.org/10.1016/j.drugalcdep.2015.12.031