
ABSTRACT
Introduction: Extended-release calcifediol (ERC) 30 µg capsules were recently approved as Rayaldee® by the United States Food and Drug Administration (FDA) for the treatment of secondary hyperparathyroidism (SHPT) in adults with stage 3–4 (not 5) chronic kidney disease (CKD) and vitamin D insufficiency (serum total 25-hydroxyvitamin D < 30 ng/mL). Calcifediol is 25-hydroxyvitamin D3, a prohormone of calcitriol (1,25-dihydroxyvitamin D3), the endogenous active vitamin D hormone. ERC capsules have a lipophilic fill which gradually releases calcifediol, corrects vitamin D insufficiency and increases serum calcitriol and thereby suppresses production of parathyroid hormone (PTH) in CKD patients without perturbing normal vitamin D and mineral metabolism.
Areas covered: This review focuses on the chemical, pharmacokinetic, pharmacodynamic and clinical profiles of ERC and describes the product’s utility relative to other current treatment options for SHPT.
Expert commentary: Randomized clinical trials (RCTs) have demonstrated that nutritional vitamin D is ineffective for treating SHPT whereas vitamin D receptor activators can correct elevated PTH but with increased risk of hypercalcemia and hyperphosphatemia. ERC offers healthcare professionals a new treatment option that has been demonstrated in RCTs to be safe and effective for controlling SHPT without meaningfully increasing serum concentrations of calcium or phosphorus.
1. Introduction
1.1. Secondary hyperparathyroidism
Secondary hyperparathyroidism (SHPT) is a common condition that occurs with advancing chronic kidney disease (CKD) and is characterized by excessive production of parathyroid hormone (PTH), hypocalcemia, and hypertrophy of the parathyroid glands. SHPT affects 40–82% of patients with stage 3 or 4 CKD [Citation1]. SHPT requires prompt and effective treatment, as prolonged elevation of PTH causes calcium and phosphorus release from bone, leading to metabolic bone disease and extra-skeletal calcification. In the absence of effective treatment, SHPT becomes progressively more severe and unresponsive to medical treatment as the parathyroid gland becomes hyperplastic and less sensitive to calcium and vitamin D hormone signaling [Citation2].
1.2. Chronic kidney disease
CKD is a worldwide public health problem with steadily increasing incidence, prevalence, and cost [Citation3]. Key factors driving growth of CKD in developed countries include aging populations, the increasing incidence of obesity, and its associated complications of hypertension and adult-onset diabetes. CKD is categorized into five successive stages on the basis of estimated glomerular filtration rate (eGFR), with each successive stage representing more advanced disease. CKD afflicts approximately 6–13% of the global population. Despite treatment, CKD continues to be associated with poor outcomes, reflecting the inadequacies of the current standard of care [Citation4,Citation5].
1.3. Vitamin D insufficiency
Vitamin D insufficiency affects an estimated 71–83% of patients with stage 3 or 4 CKD [Citation6,Citation7]. It is defined by the National Kidney Foundation as serum total 25-hydroxyvitamin D of ≥15 to <30 ng/mL and vitamin D deficiency as <15 ng/mL in its Kidney Disease Outcomes Quality Initiative (K/DOQI) Clinical Practice Guidelines for Bone Metabolism and Disease in Chronic Kidney Disease [Citation8]. The more recent Kidney Disease: Improving Global Outcomes (KDIGO) Guideline for Chronic Kidney Disease-Mineral and Bone Disorder (CKD-MBD) [Citation9] points out that most published studies define vitamin D insufficiency as serum 25-hydroxyvitamin D levels down to 10 ng/mL and vitamin D deficiency as levels below 10 ng/mL. The Endocrine Society’s Guideline for the Treatment and Prevention of Vitamin D Deficiency [Citation10] defines vitamin D sufficiency as serum 25-hydroxyvitamin D concentrations between 30 and 100 ng/mL (inclusive). The US Institute of Medicine expert committee noted in their 2010 report [Citation11] that the general population is at risk of vitamin D deficiency at serum 25-hydroxyvitamin D concentrations <12 ng/mL, and some individuals are potentially at risk for inadequacy at levels ranging from 12 to 20 ng/mL. Multiple factors contribute to vitamin D insufficiency in CKD including nutritional inadequacy, decreased sunlight exposure, proteinuric loss and decreased hepatic synthesis of 25-hydroxyvitamin D, and increased expression of fibroblast growth factor (FGF23) and CYP24A1, the cytochrome P450 enzyme that specifically catabolizes vitamin D and its metabolites [Citation12,Citation13]. Vitamin D insufficiency is associated with increased morbidity and mortality [Citation14,Citation15].
1.4. Pathogenesis of SHPT
CKD-associated SHPT develops as the result of phosphorus retention, mild hypocalcemia, and vitamin D insufficiency [Citation1]. Vitamin D insufficiency plays a central role in the pathogenesis of SHPT in CKD [Citation16]. It limits the normal activation of 25-hydroxyvitamin D to vitamin D hormone (1,25-dihydroxyvitamin D) in the kidney and in other tissues which contain cytochrome P450 25-hydroxyvitamin D-1α-hydroxylase (CYP27B1) by reducing the amount of available substrate for conversion. Declining hormone concentrations increase PTH secretion by the parathyroid glands and decrease calcium absorption in the small intestine, leading to hypocalcemia.
2. Overview of the market
2.1. Treatment of vitamin D insufficiency
Vitamin D supplementation is recommended by both the K/DOQI and KDIGO Clinical Practice Guidelines, although there is no consensus in regarding how vitamin D supplements should best be administered. Published studies have reported the use of daily doses of vitamin D (either cholecalciferol or ergocalciferol) of 700–4000 International Units (IU), weekly doses of 5000–50,000 IU, and monthly doses of approximately 50,000–250,000 IU. Irrespective of the treatment regimen used, no or inadequate reductions in PTH levels have been observed at reasonable doses in randomized clinical trials (RCTs), and nutritional vitamin D remains unproven as an effective treatment for SHPT in patients with stage 3 to 4 CKD [Citation17,Citation18]. Immediate-release (IR) formulations of calcifediol, used occasionally in the EU, have also shown no or inadequate reductions in PTH in clinical trials focused on stage 3 to 4 CKD (see Section 3.1).
2.2. Treatment of SHPT
In current clinical practice, therapy with a vitamin D receptor activator (VDRA) is typically initiated when vitamin D supplementation is found ineffective in controlling PTH in patients with stage 3 or 4 CKD. Three VDRAs are available in the US for oral administration: calcitriol, paricalcitol, and doxercalciferol. One other oral VDRA, alfacalcidol, is available outside of the US. Although VDRAs can control elevated PTH, they leave serum total 25-hydroxyvitamin D uncorrected (and potentially lower), depriving tissues of adequate substrate for local hormone production [Citation19]. Bolus oral administration of VDRAs produces supraphysiological surges in blood vitamin D hormone levels, causing unwanted elevation of FGF23- and CYP24A1-mediated vitamin D catabolism, both of which are implicated in the observed development of resistance to vitamin D therapy [Citation19]. VDRAs also stimulate intestinal absorption of calcium and phosphorus, leading to elevations of serum calcium and phosphorus which increase the risk of vascular calcification, the primary cause of morbidity and mortality in CKD [Citation20]. Both the original K/DOQI and KDIGO Clinical Practice Guidelines (Guideline 8A and Chapter 4.2, respectively) recommend the use of VDRAs in CKD, but the recently updated KDIGO Clinical Practice Guideline for CKD-MBD [Citation21] recommends against the routine use of VDRAs in patients with stage 3 or 4 CKD due to the increased risk of hypercalcemia (Chapter 4.2).
2.3. The unmet medical need
Prior to US FDA approval of extended-release calcifediol (ERC), health-care professionals were limited to two therapeutic options for SHPT in patients with stage 3 to 4 CKD: vitamin D supplements and VDRAs (calcitriol and its 1α-hydroxylated analogs). Nutritional vitamin D supplements are safe and inexpensive, but published RCTs have shown that they are ineffective for reducing elevated PTH and often delay the initiation of effective therapy [Citation17]. In contrast, VDRAs are effective for controlling PTH but increase the risk of hypercalcemia, hyperphosphatemia and adynamic bone disease, and associated vascular calcification [Citation16]. Calcimimetic therapies (cinacalcet and etelcalcetide) are approved only for use in dialysis-dependent stage 5 CKD and cause hypocalcemia and hyperphosphatemia in patients with stage 3 to 4 CKD [Citation22]. ERC addresses a pressing need for a new, improved treatment for SHPT in patients with stage 3 to 4 CKD.
3. Introduction to ERC
3.1. Background
ERC became available in the US market in late 2016. The product is indicated for the treatment of SHPT in adults with stage 3 or 4 CKD and vitamin D insufficiency, defined as serum total 25-hydroxyvitamin D below 30 ng/mL. It is not indicated in patients with stage 5 CKD on dialysis.
IR formulations of calcifediol have been available for decades in the European Union (EU) for indications such as rickets, prevention of calcium disorders secondary to corticosteroid or anticonvulsant therapy and treatment of osteomalacia, renal osteodystrophy, hypoparathyroidism, familial hypophosphatemia, and vitamin D malabsorption. In the US, IR calcifediol was marketed from 1980 to 2002 as Calderol® for the treatment of metabolic bone disease in dialysis patients and was withdrawn from the market in 2002 for commercial reasons not associated with safety or efficacy. Calderol displayed pharmacokinetic (PK) characteristics consistent with an IR formulation, with the time (tmax) to reach maximum serum calcifediol concentrations (Cmax) occurring within 4–8 h postdose [Citation23].
Published clinical studies have clearly shown that IR calcifediol increased serum 25-hydroxyvitamin D far more quickly and effectively than vitamin D supplements but failed to produce clinically meaningful reductions in PTH (≥30% from pretreatment levels) in many patients with stage 3 or 4 CKD at doses considered to be safe [Citation24–Citation26].
ERC gradually releases calcifediol, increasing serum 25-hydroxyvitamin D at a slower rate than IR formulations. Phase 2 and 3 RCTs have demonstrated that gradual elevation of serum 25-hydroxyvitamin D to within the normal laboratory range (30–100 ng/mL) allows effective suppression of elevated PTH in patients with SHPT, stage 3 or 4 CKD, and vitamin D insufficiency [Citation13,Citation27] with minimal effect on serum levels of calcium and phosphorus.
3.2. Chemistry
ERC contains calcifediol (25-hydroxyvitamin D3) monohydrate, the natural precursor (or prohormone) of calcitriol, the endogenous active vitamin D hormone. Calcifediol monohydrate is a white crystalline powder, has a calculated molecular weight of 418.65, and is soluble in alcohol and fatty oils but practically insoluble in water. Chemically, calcifediol monohydrate is (3β,5Z,7E)-9,10-secocholesta-5,7,10(19)-triene-3,25-diol monohydrate. The structure of calcifediol is shown in .
Figure 1. Chemical structures of cholecalciferol, calcifediol monohydrate, and calcitriol.
ERC is formulated for oral administration as capsules, each containing 30 µg of calcifediol and the following excipients: mineral oil, monoglycerides and diglycerides, paraffin, hypromellose, lauroyl polyoxylglycerides, dehydrated alcohol, and butylated hydroxytoluene. The capsule shell contains modified starch, carrageenan, sodium phosphate dibasic, sorbitol sorbitan solution, FD&C Blue #1, titanium dioxide, and purified water. Medium-chain triglyceride (fractionated coconut) oil is used as a lubricant during manufacture, and trace amounts may be present in the final formulation.
ERC capsules are intended to be swallowed whole, by design, based on the characteristics of the formulation. The capsule has a predominately lipophilic ‘waxy’ fill material which controls the release rate of calcifediol and, therefore, determines the PK and pharmacodynamic (PD) profiles. The product is appropriately described as an extended-release or prolonged-release capsule.
3.3. Pharmacodynamics
ERC gradually releases calcifediol and thereby prevents the rapid increases in serum calcifediol and calcitriol seen with IR formulations. The gradual rise in systemic calcifediol is characterized by a lower Cmax and a longer tmax compared to IR formulations (see Section 3.4).
The single-dose PD profile of ERC capsules was compared in a randomized, open-label study to IR calcifediol in patients with SHPT, stage 3 or 4 CKD, and vitamin D insufficiency [Citation28]. Patients were randomly assigned to receive a single oral dose of 450 or 900 μg of ERC (5 or 10 capsules each containing 90 µg) or a single IR (intravenous) dose of 448 μg calcifediol. All patients were followed for 6 weeks postdose. Blood samples were collected predose and postdose for the analysis of serum calcifediol, 1,25-dihydroxyvitamin D, and 24,25-dihydroxyvitamin D3. Serum levels of 24,25-dihydroxyvitamin D3 were used to monitor the degree of CYP24A1 upregulation, since human tissue biopsy analysis was impractical. A total of 28 subjects completed this study; 9 received 450 μg oral ERC, 9 received 900 μg oral ERC, and 10 received 448 µg intravenous calcifediol. Serum calcifediol and 1,25-dihydroxyvitamin D, plasma PTH, and serum 24,25-dihydroxyvitamin D3 concentrations are presented by treatment group in –, respectively.
Figure 2. Mean baseline-adjusted serum calcifediol concentrations from 0 to 96 hours after administration of a single dose of Intravenous (IV) or Extended-release (ER) Oral Calcifediol (Phase 2a Study).
Asterisk denotes significant differences between treatment groups at p < 0.05 and bars indicate standard deviation. (Reprinted with permission from Petkovich 2015, Copyright© 2014 Elsevier Ltd, Amsterdam, the Netherlands.)
Figure 3. Mean baseline-adjusted serum 1,25-dihydroxyvitamin D from 0 to 96 hours after administration of a single dose of Intravenous (IV) or Extended-release (ER) Oral Calcifediol (Phase 2a Study).
Note: bars indicate standard deviation. (Reprinted with permission from Petkovich 2015, Copyright© 2014 Elsevier Ltd, Amsterdam, the Netherlands.).
Figure 4. Mean baseline-adjusted plasma intact PTH from 0 to 72 hours after administration of a single dose of Intravenous (IV) or Extended-release (ER) Oral Calcifediol (Phase 2a Study).
Asterisk denotes significant differences between treatment groups at p < 0.05 and bars indicate standard deviation. (Reprinted with permission from Petkovich 2015, Copyright© 2014 Elsevier Ltd, Amsterdam, the Netherlands.).
Figure 5. Mean baseline-adjusted serum 24,25-dihydroxyvitamin D3 concentrations from 0 to 96 hours after administration of a single dose of Intravenous (IV) or Extended-release (ER) Oral Calcifediol (Phase 2a Study).
Asterisks denote significant differences between treatment groups at p < 0.05 and bars indicate standard deviation. (Reprinted with permission from Petkovich 2015, Copyright© 2014 Elsevier Ltd, Amsterdam, the Netherlands.)
Administration of 900 µg of ERC resulted in gradual increases in serum calcifediol and 1,25-dihydroxyvitamin D without significantly elevating serum 24,25-dihydroxyvitamin D3 and produced meaningful, sustained PTH suppression. Conversely, administration of IR calcifediol produced rapidly rising and higher drug exposures due to a substantially faster delivery and higher bioavailability. IR dosing also caused abrupt, large increases in serum 1,25-dihydroxyvitamin D and 24,25-dihydroxyvitamin D3, consistent with greater CYP24A1 activity, and negligible PTH suppression.
A parallel nonclinical study [Citation28] showed that renal production of calcitriol is driven by the supply of calcifediol until CYP27B1 is suppressed. The faster calcifediol is supplied, the more calcitriol is produced. The abrupt increase in serum 25-hydroxyvitamin D after bolus IR (intravenous) dosing produced a corresponding surge in serum 1,25-dihydroxyvitamin D, which in turn triggered massive upregulation of CYP24A1 in both kidney and parathyroid gland [Citation28]. Increased expression of CYP24A1 in CKD patients attenuated the further rise of serum 1,25-dihydroxyvitamin D, boosted serum levels of 24,25-dihydroxyvitamin D3, and blocked clinically meaningful reductions in plasma PTH. In contrast, ERC gradually increased both serum calcifediol and 1,25-dihydroxyvitamin D, avoided excessive increases in 24,25-dihydroxyvitamin D3, and yielded serum 1,25-dihydroxyvitamin D concentrations that were similar despite much lower calcifediol exposures. ERC produced much greater and more prolonged suppression of plasma PTH in CKD patients. These data showed that the rate at which exogenous calcifediol is supplied to a patient with SHPT, stage 3 or 4 CKD, and vitamin D insufficiency has a significant effect on treatment outcome, with ERC being more effective in reducing elevated plasma PTH than IR calcifediol.
3.4. Pharmacokinetics
Bioequivalence between ERC and any IR preparation of calcifediol was not expected since the rate of absorption of calcifediol from ERC capsules is more gradual. The bioavailability of calcifediol from an IR preparation was reported in the literature to be between approximately 62% and 77% of the administered dose [Citation23]. The bioavailability of ERC capsules is lower (approximately 25%), consistent with a lower Cmax.
Healthy adult volunteers treated in the fasted state with a single oral dose of 900 µg of ERC exhibited serum calcifediol concentrations that rose gradually to a mean baseline-corrected Cmax of 35.9 ng/mL at a median tmax of 21.0 h. Serum calcifediol concentrations in similar subjects given a single dose of 448 µg of intravenous calcifediol increased to a mean baseline-corrected Cmax of 133.7 ng/mL at a median tmax of 0.17 h. The postdose PK profiles for these two treatment groups demonstrated single-order characteristics with a mean terminal elimination half-life (t1/2) of approximately 11 days and a mean clearance (CL) of 0.027–0.028 L/h. The mean apparent volume of distribution (Vd) was 8.8 L after ERC and 9.7 L after intravenous calcifediol.
In a food effect study, a single oral dose of 450 µg of ERC was given to healthy adult volunteers in the fed and fasting states. The median tmax was 11 h in the fed group compared to 32 h in the fasted group. Mean Cmax and area under the curve (AUC) were 5- and 3.5-fold higher, respectively, in fed versus fasted subjects.
Another study conducted in adults with SHPT, stage 3 or stage 4 CKD, and vitamin D insufficiency provided multiple-dose data on serum calcifediol, total 25-hydroxyvitamin D, and total 1,25-dihydroxyvitamin D for population PK analysis [Citation13]. In this study, subjects received daily bedtime doses of 30, 60, or 90 µg of ERC or placebo for 6 weeks and were monitored for 6 weeks after the last dose. Mean serum calcifediol increased gradually in a dose-proportional manner. The tmax after the last dose was 38–43 h with a tendency toward higher values with increasing dose. Mean Cmax, after adjustment for baseline values, was 28, 60, and 86 ng/mL for the 30, 60, and 90 µg groups, respectively. Calcifediol exposures, calculated as mean background-adjusted AUC, were dose proportional, and the mean t1/2 was between 25 and 50 days. Steady-state serum calcifediol levels were not reached after 6 weeks of dosing. PK modeling predicted that steady state would have been achieved after at least 8 to 9 weeks of dosing.
The effect of alcohol on the release of calcifediol from ERC capsules was evaluated in an in vitro dissolution study. Concentrations of ethanol up to 40% by volume had no effect on the release of calcifediol.
3.5. Metabolism
The metabolism of calcifediol has been extensively reviewed in the literature [Citation29–Citation32]. Calcifediol is metabolized by the following three routes: conversion into calcitriol by 25-hydroxyvitamin D-1α-hydroxylase (CYP27B1), located in the kidney, parathyroid gland, and other tissues; hepatic catabolism to water-soluble forms excreted in bile, a significant fraction of which have been identified as glucuronide conjugates; and conversion into 24,25-dihydroxyvitamin D3, which is biologically inactive, and subsequently calcitroic acid by CYP24A1.
Excretion of calcifediol occurs primarily through the biliary fecal route [Citation33–Citation35] which can be inhibited by uremic toxins, causing the t1/2 to increase as CKD progresses [Citation36,Citation37].
4. Clinical efficacy
4.1. Scope of clinical development program
The efficacy of ERC for the treatment of SHPT in patients with stage 3 or 4 CKD and vitamin D insufficiency has been evaluated in one phase 2b and three phase 3 multiple-dose studies. A placebo control was selected for the three RCTs because there were no approved therapies in the US or elsewhere to treat both elevated PTH and vitamin D insufficiency in stage 3 to 4 CKD. Nutritional vitamin D (either cholecalciferol or ergocalciferol) has no PTH-lowering efficacy in patients with stage 3 to 4 CKD, and VDRAs increase vitamin D catabolism and, thereby, lower serum total 25-hydroxyvitamin D (see Section 2.2). The fourth study was an open-label phase 3 extension study. Efficacy data from these studies are summarized in the sections which follow. Data obtained from both the intent-to-treat (ITT) and per-protocol (PP) populations are presented to allow for a clearer evaluation of the efficacy than a narrower presentation of ITT data alone.
Subjects were considered eligible for enrollment if they were at least 18 years of age and had a serum calcium level of ≥8.4 and <9.8 mg/dL and a serum phosphorus level of ≥2.0 and <5.0 mg/dL. Exclusion criteria were spot urine calcium:creatinine ratio >0.2, nephrotic range proteinuria (>3 mg/mg creatinine), history of parathyroidectomy or renal transplantation, and the need for regular hemodialysis. Appropriate washout from prior use of PTH-lowering therapies, including nutritional vitamin D at daily doses above 1600 IU, was required prior to enrollment.
In all four multiple-dose studies, the active and placebo groups were similar in race, gender, ethnicity, age, height, weight, and body mass index. There were almost equal numbers of enrolled male and female subjects with almost two-thirds being white (including Hispanic or Latino). The percentage of blacks was high compared to the general population but in line with that expected in CKD due to higher rates of diabetes and hypertension among the black population [Citation38]. The mean ages of the subjects studied were in the range of 63–66 years. The most common causes of CKD across all groups were diabetes mellitus and hypertension; glomerulonephritis and polycystic kidney disease were the other less common causes. No differences were detected in either the ITT or PP populations between the active and placebo groups with regard to baseline demographics or serum calcium, serum phosphorus, PTH, and serum total 25-hydroxyvitamin D and 1,25-dihydroxyvitamin D.
4.2. Phase 2 study
The phase 2b study evaluated a 6-week course of three fixed daily bedtime doses of ERC capsules (30, 60, or 90 µg) or matching placebo using a randomized, double-blind design involving 78 subjects [Citation13]. The primary efficacy end points were the mean percent change in PTH from pretreatment baseline and the proportion of subjects that achieved mean serum 25-hydroxyvitamin D levels of ≥30 ng/mL at the end of treatment (EOT).
Daily treatment with ERC progressively reduced mean plasma PTH approximately in proportion to the administered dose from a baseline value of 140.3 pg/mL. The mean changes from baseline at EOT in the PP population were −20.9%, −32.8%, and −39.3% for the 30, 60, and 90 µg dose groups, respectively, compared with +20.5% and +13.2% in the placebo groups (). Differences in the observed mean percent decreases in PTH were significant for all three ERC dose groups compared to the corresponding placebo groups (p < 0.01).
Figure 6. Mean (±SE) percent change in PTH from baseline by treatment group at end of treatment (Phase 2b Study). Asterisks denote significant differences between ERC and placebo treatment at p < 0.05 (**) and p < 0.001 (***).
(Reprinted with permission from Sprague 2014, Copyright © 2015 Karger Publishers, Basel, Switzerland.).
The proportion of subjects achieving serum 25-hydroxyvitamin D ≥30 ng/mL at EOT was greater with 30, 60, and 90 µg of ERC compared with placebo (p < 0.0001) in both the ITT and PP populations. The response rates in both populations were 92.3%, 100.0%, and 100.0% compared to 7.1% and 0.0% in the placebo groups. The daily dose of 30 µg of ERC increased mean serum 25-hydroxyvitamin D at EOT to 37 ng/mL, just higher than the minimum adequate level (30 ng/mL), indicating that this was the minimum effective dose for correcting vitamin D insufficiency. This dose also reduced PTH from pretreatment baseline by at least 30% in approximately 40% of subjects. Based on these data, the 30 µg/day dose was selected as the starting dose for the subsequent pivotal phase 3 studies, and titration of the dose up to 60 µg/day was allowed, as needed, in order to sufficiently reduce PTH.
Mean serum 25-hydroxyvitamin D rose dose-proportionately with daily ERC. The daily dose of 60 µg increased serum 25-hydroxyvitamin D to a mean of 67 ng/mL well within the targeted range of 30–100 ng/mL for patients with stage 3 or 4 CKD. The daily dose of 90 µg raised mean serum 25-hydroxyvitamin D at EOT to 84.8 ng/mL, causing levels to exceed 100 ng/mL in a substantial proportion of subjects. Thus, 90 µg was considered too high for evaluation in the phase 3 studies. Serum levels of calcifediol did not reach steady state after 6 weeks of dosing. A summary of the phase 2b data appears in .
Table 1. Subject end-of-treatment characteristics for phase 2b study (per-protocol subjects).
4.3. Phase 3 studies
Two identical RCTs (Studies A and B) with multicenter, randomized, double-blind, placebo-controlled designs enrolled 429 subjects recruited from 89 US sites [Citation27]. Subjects were stratified by CKD stage (3 or 4) and were randomized in a 2:1 ratio to receive a once-daily 30-μg oral dose of ERC (or matching placebo) for 12 weeks at bedtime followed by an additional 14 weeks of treatment with once-daily bedtime doses of either 30 or 60 μg of ERC (or placebo). The dose was increased to 60 μg at the start of week 13 if PTH was >70 pg/mL (the upper limit of the laboratory reference range), serum total 25-hydroxyvitamin D was <65 ng/mL, and serum calcium was <9.8 mg/dL. A total of 213 subjects were randomized in Study A (72 placebo and 141 ERC), and 216 patients were randomized in Study B (72 placebo and 144 ERC). In the two pivotal studies combined, 222 subjects (51.7%) had stage 3 CKD (71 placebo and 151 ERC) and 207 subjects (48.3%) had stage 4 CKD (73 placebo and 134 ERC).
Subjects who completed either one of these two pivotal studies were eligible to enroll in a 26-week open-label extension study. A total of 354 subjects (83%) completed either one of the two pivotal phase 3 studies without a major protocol deviation and 298 (69%) entered the extension study. Of these 298 subjects, 195 had been treated with ERC in the preceding pivotal studies.
In the phase 3 extension study, subjects who had previously received 26 weeks of oral treatment with ERC continued to receive ERC at the same dose (either 30 or 60 µg) administered daily at bedtime. Subjects who had previously received 26 weeks of placebo treatment changed to a daily 30-μg bedtime dose of ERC. Dosing continued without the option of escalation for 12 weeks. After 12 weeks, the dose was increased to 60 μg, as necessary, in any subject receiving a dose of 30 µg/day to achieve a targeted 30% reduction in PTH provided that PTH was >70 pg/mL, serum total 25-hydroxyvitamin D was <65 ng/mL, and serum calcium was <9.8 mg/dL, using average values from the two earlier treatment weeks.
The sole primary efficacy end point was the number (n, %) of subjects in the ITT population that attained a mean decrease of ≥30% in PTH from pretreatment baseline in the efficacy assessment period (EAP), defined as the last 6 weeks of the 26-week treatment period. The secondary efficacy end points included the number (n, %) of subjects in the PP population achieving a mean 30% decrease in PTH from pretreatment baseline in the EAP and the number (n, %) of subjects in the ITT and PP populations achieving adequate serum total 25-hydroxyvitamin D (≥30 ng/mL) in the EAP. Key exploratory end points included changes in mean serum total 1,25-dihydroxyvitamin D, FGF23, and 24,25-dihydroxyvitamin D3 concentrations.
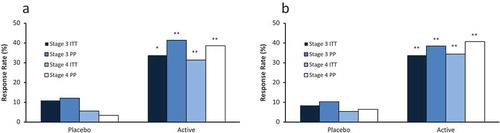
The primary efficacy end point was reached in both pivotal studies (). The proportion of subjects in the ITT population who achieved at least a 30% reduction in PTH in the EAP was greater with ERC than with placebo treatment in both studies irrespective of whether the CKD stages were combined or analyzed separately (p < 0.001). Response rates were similar for both CKD stages and were higher in the PP than in the ITT populations, primarily because subjects who terminated prematurely were deemed to be nonresponders irrespective of observed changes in PTH.
Figure 7. Response rates for PTH reduction of ≥30% from baseline by treatment group, CKD stage and analysis population in the efficacy assessment period (Phase 3 Pivotal Studies A and B). Asterisks denote significant differences between ERC and placebo treatment at p < 0.05 (*) and p < 0.01 (**).
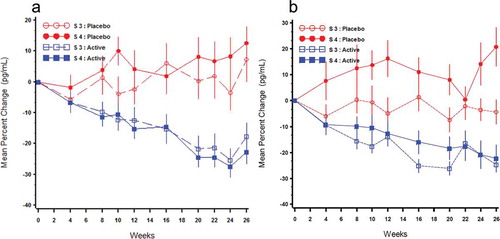
Mean PTH concentrations at baseline in both studies ranged from 125 to 138 pg/mL for stage 3 subjects and 156 to 169 pg/mL for stage 4 subjects. Daily treatment with ERC progressively suppressed mean PTH in both CKD stages (). In Study A, the mean changes from baseline for PP subjects treated with ERC were −13.9% after 12 weeks of treatment and −22.8% in the EAP (Weeks 20–26) compared with increases of 0.7% and 5.5% in subjects treated with placebo. In Study B, the mean changes from baseline for PP subjects treated with ERC were −13.4% after 12 weeks of treatment and −21.0% in the EAP compared with increases of 6.2% and 4.3% in subjects treated with placebo. Differences between the ERC and placebo treatment groups were all significant (p < 0.005) favoring treatment with ERC. The proportions of subjects treated with ERC who achieved a mean reduction in plasma PTH in the EAP of at least 10%, 20%, and 30% were determined to be 72.3%, 58.3%, and 39.7%, respectively, in the pooled PP population. The corresponding response rates in subjects treated with placebo were 27.3%, 17.4%, and 8.1%, respectively. These data showed that the majority of subjects treated with ERC experienced a PTH-lowering benefit and, based on regular monitoring of serum bone turnover markers, none showed evidence of adynamic bone disease.
Figure 8. Mean (±SE) percent change from baseline over time in PTH by treatment group and Stage 3 (S3) or Stage 4 (S4) in the per protocol population (Phase 3 Pivotal Studies A and B).
The proportions of subjects in the ITT and PP populations who achieved adequate serum total 25-hydroxyvitamin D levels (≥30 ng/mL) in the EAP were significantly greater with ERC than with placebo treatment in both studies when the CKD stages were combined or analyzed separately. Response rates were similar in both studies and for each CKD stage and approached maximum levels in the PP populations.
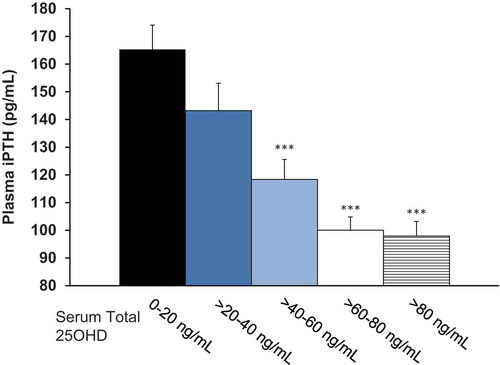
The relationship between mean serum total 25-hydroxyvitamin D concentrations in the EAP and the corresponding mean concentrations of plasma PTH for all subjects who completed treatment with either ER calcifediol or placebo is displayed in , which shows that PTH suppression increased as serum total 25-hydroxyvitamin D rose above 30 ng/mL.
Figure 9. Plasma PTH as a function of serum total 25-hydroxyvitamin D (25OHD) in the efficacy assessment period (Pooled Data from Phase 3 Pivotal Studies). Asterisks denote significant differences from 0-20 ng/mL group at p < 0.001 and bars indicate standard error.
Mean serum total 1,25-dihydroxyvitamin D levels increased significantly and progressively with ERC versus placebo treatment regardless of CKD stage. Serum levels of FGF23 in subjects treated for 26 weeks with ERC were unchanged and serum levels of 24,25-dihydroxyvitamin D3 were only modestly elevated (versus placebo) consistent with the correction of vitamin D insufficiency, indicating that treatment with 30–60 µg of ERC avoided overexpression of CYP24A1, a factor implicated in the development of resistance to vitamin D therapies.
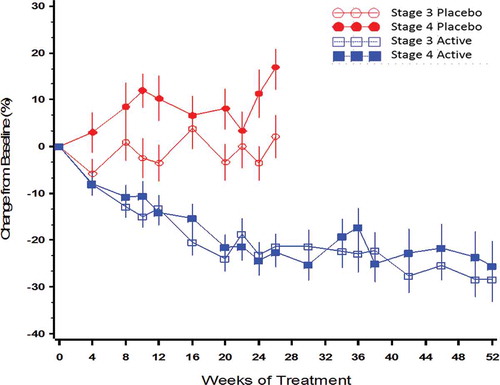
Data from all three phase 3 studies supported the conclusion that daily ERC treatment progressively suppressed mean PTH equivalently in both stage 3 and stage 4 CKD and that the extent of suppression increased with duration of treatment (). The proportion of subjects in the combined PP population achieving a reduction in PTH of ≥30% from baseline was 22% after 12 weeks on 30 µg, 40% after 26 weeks of treatment on either 30 or 60 µg, and 50% after 52 weeks on either 30 or 60 µg compared with <8% for placebo (p < 0.001).
Figure 10. Mean (±SE) percent change from baseline over time in PTH by treatment group and CKD stage in the per protocol population (combined data from Phase 3 pivotal and extension studies).
Population PK/PD modeling demonstrated that body size, age, race, gender, eGFR, and diabetes had no significant influence on the serum total 25-hydroxyvitamin D elevation and PTH reduction observed with ERC treatment. As expected, eGFR was found to be inversely related to baseline PTH and positively related to baseline total 1,25-dihydroxyvitamin D. However, eGFR was unrelated to changes from baseline for PTH, serum total 25-hydroxyvitamin D, or serum total 1,25-dihydroxyvitamin D. A summary of the phase 3 data appears in .
Table 2. Baseline and end-of-treatment parameters from phase 3 pivotal (Studies A and B) and extension trials (per-protocol subjects).
5. Safety and tolerability
5.1. Background
The safety profile of vitamin D compounds is well understood, and the major safety-related concerns are hypercalcemia, hyperphosphatemia, and oversuppression of PTH. The available data show that calcifediol has a good safety profile with no unique safety concerns beyond those noted above for the vitamin D class. compares the key characteristics of ERC to those of other vitamin D products used to treat SHPT in stage 3 to 4 CKD.
Table 3. Comparison of effects on blood bone and mineral parameters of ERC versus other vitamin D therapies.
5.2. Overview of safety data
The safety of ERC for the intended indication has been demonstrated primarily in the four multiple-dose studies and is supported by four additional single-dose clinical pharmacology studies. All four of the multiple-dose primary safety studies were conducted in subjects with SHPT, CKD, and vitamin D insufficiency and were designed to monitor subjects carefully for (a) potential adverse effects associated with vitamin D therapy, namely hypercalcemia, hyperphosphatemia, and hypercalciuria; (b) possible oversuppression of PTH; and (c) potential acceleration of CKD progression.
5.3. Tolerability
The majority of subjects enrolled in the multiple-dose studies completed treatment. Over 82% of subjects receiving ERC in the two pivotal phase 3 studies completed the 26-week treatment period. Comparable proportions of subjects in each treatment group (ERC vs. placebo) and CKD stage terminated early. Of the subjects who did not complete treatment, the most frequently reported reasons were withdrawn consent (5.6%) followed by discontinuations due to a serious treatment-emergent adverse event (TEAE) (3.0%) and lost to follow-up (2.8%).
5.4. Treatment-emergent adverse events
Approximately 70% of subjects in the phase 3 studies experienced at least one TEAE, and the incidence of TEAEs was comparable between treatment groups and CKD stages. In the two pivotal studies, the proportion of TEAEs judged related to study drug was slightly higher among subjects treated with ERC (12.6%) than those treated with placebo (9.0%) but was modest in both groups; the incidence of related TEAEs was similar in the open-label extension study (10.7% for 26 weeks and 10.8% for 52 weeks). The most frequently reported event related to study drug was diarrhea which occurred in 2.8% of placebo and 1.8% of ERC subjects. The incidence of severe TEAEs was <12% overall in any treatment group. There were no late-appearing TEAEs detected in subjects treated up to 52 weeks in the extension study.
No deaths were reported during the single-dose studies or the phase 2b study. Twelve subjects (1/144 placebo [0.7%] and 11/388 ERC [2.8%]) died during the phase 3 studies; none of the deaths was judged related to study drug. No serious TEAEs were reported in the single-dose studies. In the phase 2b study, three ERC subjects and one placebo subject experienced a serious TEAE.
The safety of ERC was examined in subpopulations based on race, gender, age, ethnicity, and the presence or absence of diabetes mellitus in the pooled data from the pivotal phase 3 studies (due to reduced power to evaluate each study individually). The TEAE profiles were comparable between treatment groups and CKD stages regardless of the subpopulation. The TEAE profiles were also comparable between treatment groups and CKD stages regardless of whether or not subjects used vitamin D supplements or phosphate binders.
The ERC phase 3 program titrated subjects to a PTH target in the normal range. Slightly fewer subjects achieving normal PTH values experienced a TEAE. To examine the safety of occasional excursions of serum total 25-hydroxyvitamin D levels ≥100 ng/mL, TEAE profiles were compared between ERC subjects who had an excursion (n = 45) and those who did not (n = 240). Slightly fewer subjects with excursions in 25-hydroxyvitamin D levels ≥100 ng/mL experienced a severe (6.7% versus 10.4%) or serious (17.8% versus 18.3%) TEAE, but slightly more of these subjects experienced at least one TEAE of any severity (73.3% versus 66.3%). However, the number of subjects with excursions was small.
5.5. Serum calcium and phosphorus
Mean serum calcium increased slightly (0.1 mg/dL) with ERC treatment in the two pivotal studies compared with placebo treatment (p < 0.001). Six subjects in the ERC group experienced two consecutive serum calcium levels >10.3 mg/dL (vs. upper limit of normal of 10.5 mg/dL). The elevations were not related to dose, serum total 25-hydroxyvitamin D or 1,25-dihydroxyvitamin D level, or use of elemental calcium or phosphate binder, supporting an etiology related to an unmeasured extrinsic (diet) or intrinsic (intestinal transport) factor. Mean serum phosphorus levels also increased slightly more (0.1 mg/dL) with ERC treatment than with placebo treatment (p = ns), and this effect was more apparent in subjects with stage 4 CKD. Stage 4 CKD subjects had higher mean serum phosphorus levels at baseline, which increased over time in both treatment groups likely as a result of progression of kidney disease. ERC treatment had no significant effect on serum FGF23.
5.6. Urine calcium
Subjects were monitored for hypercalciuria because of its possible adverse effect on renal arteriolar vasoconstriction and progressive calcification with loss of function. Across the phase 3 pivotal and extension studies, no significant effects of ERC treatment were detected on spot urinary calcium:creatinine ratio. Thirteen ERC subjects had ratios >0.2; all were transient except for one subject who had a ratio >0.2 before receiving ERC which remained elevated throughout 52 weeks of treatment. These data indicated a lack of a true drug effect and suggested that the episodic instances likely were related to fluctuations in dietary calcium intake since the spot samples were not collected during the fasting state.
5.7. Renal function
In the pivotal studies, a higher incidence of transient increases in serum creatinine was observed in subjects treated with ERC (4.9%) versus placebo (1.4%). The increases in serum creatinine were deemed unrelated to study drug and resolved without changes to study drug and without specific treatment other than standard of care for the underlying disorder in all but one case. No differences in mean eGFR, blood urea nitrogen, or serum creatinine were detected between ERC and placebo treatment groups for either CKD stage.
6. Regulatory affairs
ERC is only approved in the US at this time.
7. Conclusion
Data from two adequate and well-controlled phase 3 studies have demonstrated that daily bedtime administration of 30–60 μg of ERC is safe and effective in treating SHPT in adults with stage 3 or 4 CKD and vitamin D insufficiency. These 26-week RCTs, with identical randomized, double-blind, and placebo-controlled designs, each demonstrated that ERC effectively corrected vitamin D insufficiency and reduced mean plasma PTH by at least 30% from pretreatment baseline in a greater proportion of subjects than matching placebo (p < 0.0001), using a prespecified analysis. The efficacy of ERC was unaffected by CKD stage and was more pronounced with longer duration of treatment. ERC was well tolerated, had minimal effect on serum calcium and phosphorus, and was free of significant adverse effects. Based on these data, ERC has recently been approved for marketing in the US.
8. Expert commentary
Data from three prospective RCTs with ERC showed that the magnitude of plasma PTH suppression in patients with stage 3 or 4 CKD was continuously and directly related to increases in serum total 25-hydroxyvitamin D above 30 ng/mL. Further, they showed that serum levels of 25-hydroxyvitamin D and 1,25-dihydroxyvitamin D were continuously and directly related. These findings support the conclusion that ERC lowered elevated PTH by raising and maintaining serum total 25-hydroxyvitamin D and that the mechanism for PTH suppression involved elevation of serum and/or intracellular total 1,25-dihydroxyvitamin D.
It remains unknown if the conversion of 25-hydroxyvitamin D into 1,25-dihydroxyvitamin D in patients with stage 3 or 4 CKD occurred primarily in the kidney or elsewhere. The pivotal studies showed that ERC suppressed PTH to the same degree in both stage 3 and stage 4 CKD, a finding which is at odds with conventional wisdom that 25-hydroxyvitamin D is less likely to be converted into 1,25-dihydroxyvitamin D as CKD advances, due to declining expression of CYP27B1 in the failing kidneys. This finding indicates that (a) there is adequate renal CYP27B1 activity in predialysis patients to activate 25-hydroxyvitamin D and/or that (b) 25-hydroxyvitamin D is activated by CYP27B1 expressed outside the kidneys. It is well established that CYP27B1 is found in the parathyroid glands and in many other extrarenal tissues [Citation39], presumably for local hormone production. Further, it has been demonstrated that serum levels of 1,25-dihydroxyvitamin D rise in response to administered calcifediol in anephric patients [Citation40]. It is plausible, therefore, that ERC raises serum total 25-hydroxyvitamin D to high enough levels to enable sufficient extrarenal 1,25-dihydroxyvitamin D production for PTH control.
Irrespective of where 25-hydroxyvitamin D is activated, there remains a pressing need to determine the optimal levels of serum total 25-hydroxyvitamin D for PTH control in patients with stage 3 or 4 CKD. Data from the four prospective clinical studies with ERC suggest that serum total 25-hydroxyvitamin D should be raised substantially above 30 ng/mL, the level currently considered to be adequate in clinical practice guidelines applicable to CKD. Cross-sectional data from another recent study [Citation41] also suggested that higher 25-hydroxyvitamin D levels are required for SHPT control as CKD advances, based on the observed continuous inverse relationship between PTH and serum total 25-hydroxyvitamin D rising well above 30 ng/mL.
Data obtained with ERC show that gradual elevation of serum total 25-hydroxyvitamin D within the targeted range of 30–100 ng/mL has minimal effect on serum levels of calcium and phosphorus and is free of significant adverse effects. The threshold of toxicity for serum total 25-hydroxyvitamin D has been postulated by others to be 100 [Citation42], 150 [Citation43], and 250 ng/mL [Citation44], but supportive data are sparse. It has also been postulated that toxicity depends on more on the rate at which serum total 25-hydroxyvitamin D is elevated during repletion therapy than on the absolute exposure achieved [Citation28].
The PTH reductions observed with ERC compared favorably to those previously observed in predialysis patients during RCTs examining treatment with VDRAs, when considered with concomitant changes in serum calcium and phosphorus. In the PRIMO trial [Citation45], paricalcitol, administered orally at 2 µg/day, lowered mean PTH from a baseline level of approximately 130 pg/mL to the normal range within 8 weeks and maintained it normal for another 40 weeks of treatment. No PTH reduction was observed in the parallel placebo group. Mean serum calcium and phosphorus rose with paricalcitol treatment by 0.57 mg/dL (p < 0.001) and 0.19 mg/dL (p = 0.05), respectively, versus placebo. Nearly 23% of subjects experienced hypercalcemia, defined as two consecutive measurements above 10.5 mg/dL, on paricalcitol versus 0.9% on placebo (p < 0.001). In the OPERA Trial [Citation46], paricalcitol, administered orally at 1 µg/day, reduced median PTH by 86 pg/mL (55%) from a baseline level of 156 pg/mL while placebo treatment increased PTH by 21 pg/mL (16%) from a baseline level of 129 pg/mL. Mean serum calcium rose with paricalcitol treatment but not with placebo, and 43% of subjects on paricalcitol experienced hypercalcemia, defined as serum calcium above 10.2 mg/dL versus 3% on placebo (p < 0.001). In phase 3 trials, paricalcitol produced a mean decrease of 45% in PTH after 24 weeks compared with a mean increase of 14% with placebo and raised serum calcium and phosphorus by 0.2 and 0.1 mg/dL, respectively [Citation47]. Hypercalcemia, defined as two consecutive serum calcium determinations above 10.5 mg/dL, was observed in 2% of subjects receiving paricalcitol versus 0% on placebo. Doxercalciferol, at an average oral dose of up to 1.6 µg/day, reduced mean PTH by 46% after 24 weeks of treatment versus 2% with placebo [Citation48], mean serum calcium rose by 0.4 and 0.1 mg/dL, and mean serum phosphorus rose by 0.3 and 0.0 mg/dL, respectively. No differences in the rates of hypercalcemia or hyperphosphatemia were noted between the treatment groups. Alfacalcidol treatment (0.25–1.0 µg/day) over 2 years produced no significant reduction in PTH relative to placebo [Citation49]. In the PACE study [Citation50], oral calcitriol (0.25 µg/day) and paricalcitol (1.0 µg/day) reduced mean PTH by 46% and 52%, respectively, from pretreatment baseline levels of 209 and 176 pg/mL over 24 weeks of treatment and increased serum calcium and phosphorus by 0.3–0.4 mg/dL (p < 0.05).
The FDA approval of ERC is timely in view of the recently revised Clinical Practice Guideline for CKD-MBD [Citation21]. The revised guideline highlights the limited effectiveness of nutritional vitamin D for suppressing elevated PTH in CKD and recommends against routine use of VDRAs for PTH suppression due to the increased risk of hypercalcemia, which increases the risk of vascular calcification. ERC offers health-care professionals a new treatment option that has been shown effective and safe in controlling PTH without meaningfully perturbing calcium and phosphorus homeostasis.
9. Five-year view
The current standard of care for SHPT in CKD is early initiation of vitamin D supplementation followed by a switch to (or addition of) VDRA therapy (usually calcitriol) after PTH increases to unacceptable levels. Vitamin D supplementation alone has not been shown to correct SHPT in RCTs, but its widespread use is driven by low cost, easy access, a good safety profile, and, until recently, the absence of a better repletion therapy. Simply put, health-care professionals view vitamin D supplements as harmless and potentially helpful.
A recent meta-analysis of RCTs evaluating vitamin D supplements contended that vitamin D supplementation may inappropriately delay the institution of more effective VDRA therapy, thereby allowing SHPT to become more established and difficult to treat [Citation17]. VDRAs effectively control PTH but at the risk of increasing serum calcium and phosphorus, increasing the risk of hypercalcemia and hyperphosphatemia, especially when used in combination with vitamin D supplements. Hypercalcemia and hyperphosphatemia are key drivers of vascular calcification, the leading cause of morbidity and mortality in CKD [Citation19]. The revised KDIGO clinical practice guideline for CKD-MBD [Citation21] recommends against routine use of VDRAs in CKD stages 3 and 4.
Early, effective, and safe treatment of SHPT with ERC could substantially improve CKD outcomes. This new therapy enables health-care professionals to eradicate vitamin D insufficiency and to control SHPT at its onset, which could decrease the risk of severe SHPT and hyperplasia of the parathyroid glands. Over time, ERC is likely to become a mainstay in the armamentarium of SHPT therapies and may appropriately delay institution of VDRA therapy until dialysis. Achieving better SHPT control with early, effective ERC therapy could lower the VDRA dose required, thereby reducing the associated risk of vascular calcification, resulting in healthier bones at the time of transplantations and contributing to reduced MBD and related fracture risk.
Key issues
Extended-release calcifediol (ERC) was recently approved as Rayaldee® by the US FDA for the treatment of secondary hyperparathyroidism (SHPT) in adults with stage 3 or 4 chronic kidney disease (CKD) and vitamin D insufficiency.
ERC addresses a pressing need for a new, improved treatment for SHPT in patients with stage 3–4 CKD.
Calcifediol (25-hydroxyvitamin D3) is the natural precursor (or prohormone) of calcitriol, the endogenous vitamin D hormone.
ERC gradually releases calcifediol and thereby avoids the rapid increases in serum calcifediol and calcitriol seen with immediate-release (IR) formulations.
A head-to-head comparison of ERC vs. IR calcifediol showed that ERC produced much greater and more prolonged suppression of plasma PTH in CKD patients.
Data from two adequate and well-controlled phase 3 studies have demonstrated that daily bedtime administration of 30–60 μg of ERC is safe and effective in treating SHPT in adults with stage 3 or 4 CKD and vitamin D insufficiency.
ERC offers healthcare professionals a new treatment option that has been shown effective in both correcting vitamin D insufficiency and controlling PTH without meaningfully perturbing calcium and phosphorus homeostasis.
Information resources
Additional information on ERC can be found at http://rayaldee.com and in the following refereed articles: Sprague 2014 [Citation13], Petkovich 2015 [Citation28], and Sprague 2016 [Citation27].
Declaration of interest
SM Sprague is a consultant for OPKO Health, Inc. SA Strugnell and CW Bishop are employees of OPKO Health, Inc. The authors have no other relevant affiliations or financial involvement with any organization or entity with a financial interest in or financial conflict with the subject matter or materials discussed in the manuscript apart from those disclosed.
Additional information
Funding
References
- Levin A, Bakris GL, Molitch M, et al. Prevalence of abnormal serum vitamin D, PTH, calcium, and phosphorus in patients with chronic kidney disease: results of the study to evaluate early kidney disease. Kidney Int. 2007;71:31–38.
- Nigwekar SU, Tamez H, Thadhani RI. Vitamin D and chronic kidney disease-mineral bone disease (CKD-MBD). Bonekey Rep. 2014;3:498.
- Coresh J, Selvin E, Stevens LA, et al. Prevalence of chronic kidney disease in the United States. JAMA. 2007;298:2038–2047.
- Nicola LD, Zoccali C. Chronic kidney disease prevalence in the general population: heterogeneity and concerns. Nephrol Dial Transplant. 2016;31:331–335.
- Levey AS, Eckardt KU, Tsukamoto Y, et al. Definition and classification of chronic kidney disease: a position statement from Kidney Disease: Improving Global Outcomes (KDIGO). Kidney Int. 2005;67:2089–2100.
- LaClair RE, Hellman RN, Karp SL, et al. Prevalence of calcidiol deficiency in CKD: a cross-sectional study across latitudes in the United States. Am J Kidney Dis. 2005;45:1026–1033.
- Wolf M, Shah A, Gutierrez O, et al. Vitamin D levels and early mortality among incident hemodialysis patients. Kidney Int. 2007;72:1004–1013.
- National Kidney Foundation Kidney Disease Outcomes Quality Initiative (K/DOQI) clinical practice guidelines for bone metabolism and disease in chronic kidney disease. Am J Kidney Dis. 2003;42:S84–S89.
- Kidney Disease Improving Global Outcomes (KDIGO) clinical practice guideline for the diagnosis, evaluation, prevention, and treatment of Chronic Kidney Disease-Mineral and Bone Disorder (CKD-MBD). Kidney Int Suppl. 2009;S22–S31.
- Holick MF, Binkley NC, Bischoff-Ferrari HA, et al. Evaluation, treatment, and prevention of vitamin D deficiency: an Endocrine Society clinical practice guideline. J Clin Endocrinol Metab. 2011;96:1911–1930.
- Ross A, Manson J, Abrams S, et al. The 2011 report on dietary reference intakes for calcium and vitamin D from the Institute of Medicine: what clinicians need to know. J Clin Endocrinol Metab. 2011;96:53–58.
- Helvig CF, Cuerrier D, Hosfield CM, et al. Dysregulation of renal vitamin D metabolism in the uremic rat. Kidney Int. 2010;78:463–472.
- Sprague SM, Silva AL, Al-Saghir F, et al. Modified-release calcifediol effectively controls secondary hyperparathyroidism associated with vitamin D insufficiency in chronic kidney disease. Am J Nephrol. 2014;40:535–545.
- Fernandez-Juarez G, Luno J, Barrio V, et al. 25 (OH) vitamin D levels and renal disease progression in patients with type 2 diabetic nephropathy and blockade of the renin-angiotensin system. Clin J Am Soc Nephrol. 2013;8:1870–1876.
- Ravani P, Malberti F, Tripepi G, et al. Vitamin D levels and patient outcome in chronic kidney disease. Kidney Int. 2009;75:88–95.
- Cunningham J, Locatelli F, Rodriguez M. Secondary hyperparathyroidism: pathogenesis, disease progression, and therapeutic options. Clin J Am Soc Nephrol. 2011;913–921.
- Agarwal R, Pi G. Con: nutritional vitamin D replacement in chronic kidney disease and end-stage renal disease. Nephrol Dial Transplant. 2016;31:706–713.
- Kalantar-Zadeh K, Kovesdy CP. Clinical outcomes with active versus nutritional vitamin D compounds in chronic kidney disease. Clin J Am Soc Nephrol. 2009;4:1529–1539.
- de Boer IH, Thadhani R. Vitamin D deficiency: consequence or cause of CKD? Clin J Am Soc Nephrol. 2013;8:1844–1846.
- Paloian NJ, Giachelli CM. A current understanding of vascular calcification in CKD. Am J Physiol Renal Physiol. 2014;307:F891–F900.
- Kidney Disease Improving Global Outcomes (KDIGO) 2017 clinical practice guideline update for the diagnosis, evaluation, prevention and treatment of chronic kidney disease – mineral and bone disorder (CKD-MBD). Kidney Int Suppl. 2017;7:S1–S59.
- Chonchol M, Locatelli F, Abboud HE, et al. A randomized, double-blind, placebo-controlled study to assess the efficacy and safety of cinacalcet HCl in participants with CKD not receiving dialysis. Am J Kidney Dis. 2009;53:197–207.
- Haddad JG Jr., Rojanasathit S. Acute administration of 25-hydroxycholecalciferol in man. J Clin Endocrinol Metab. 1976;42:284–290.
- Bordier PJ, Marie PJ, Arnaud CD. Evolution of renal osteodystrophy: correlation of bone histomorphometry and serum mineral and immunoreactive parathyroid hormone values before and after treatment with calcium carbonate or 25-hydroxycholecalciferol. Kidney Int Suppl. 1975 Jan;(2):S102–112.
- Letteri JM, Kleinman LM, Ellis KN, et al. Effects of 25-hydroxycholecalciferol on calcium metabolism in chronic renal failure. Adv Exp Med Biol. 1977;81:591–601.
- Fournier A, Idrissi A, Sebert JL, et al. Preventing renal bone disease in moderate renal failure with CaCO3 and 25(OH) vitamin D3. Kidney Int Suppl. 1988;24:S178–179.
- Sprague SM, Crawford PW, Melnick JZ, et al. Use of extended-release calcifediol to treat secondary hyperparathyroidism in stages 3 and 4 chronic kidney disease. Am J Nephrol. 2016;44:316–325.
- Petkovich M, Melnick J, White J, et al. Modified-release oral calcifediol corrects vitamin D insufficiency with minimal CYP24A1 upregulation. J Steroid Biochem Mol Biol. 2015;148:283–289.
- Bikle DD. Clinical counterpoint: vitamin D: new actions, new analogs, new therapeutic potential. Endocr Rev. 1992;13:765–784.
- Bikle DD. Vitamin D metabolism, mechanism of action, and clinical applications. Chem Biol. 2014;21:319–329.
- DeLuca HF. Overview of general physiologic features and functions of vitamin D. Am J Clin Nutr. 2004;80:1689S–1696S.
- Jones G, Strugnell SA, DeLuca HF. Current understanding of the molecular actions of vitamin D. Physiol Rev. 1998;78:1193–1231.
- Arnaud SB, Goldsmith RS, Lambert PW, et al. 25-Hydroxyvitamin D3: evidence of an enterohepatic circulation in man. Proc Soc Exp Biol Med. 1975;149:570–572.
- Compston JE, Merrett AL, Ledger JE, et al. Faecal tritium excretion after intravenous administration of 3H-25-hydroxyvitamin D3 in control subjects and in patients with malabsorption. Gut. 1982;23:310–315.
- Ledger JE, Watson GJ, Compston JE. Biliary excretion of radioactivity after intravenous administration of [3H]25-hydroxyvitamin D3 in man. Dig Dis Sci. 1986;31:361–368.
- Avioli LV, Birge S, Lee SW, et al. The metabolic fate of vitamin D3-3H in chronic renal failure. J Clin Invest. 1968;47:2239–2252.
- Dreisbach AW, Lertora JJ. The effect of chronic renal failure on drug metabolism and transport. Expert Opin Drug Metab Toxicol. 2008;4:1065–1074.
- Freedman BI. End-stage renal failure in African Americans: insights in kidney disease susceptibility. Nephrol Dial Transplant. 2002;17:198–200.
- Adams JS, Rafison B, Witzel S, et al. Regulation of the extrarenal CYP27B1-hydroxylase. J Steroid Biochem Mol Biol. 2014;144:22–27.
- Dusso A, Finch J, Delmez J, et al. Extrarenal production of calcitriol. Kidney Int. 1990;38(29):S36–S40.
- Ennis JL, Worcester EM, Coe FL. Sprague SM. Current recommended 25-hydroxyvitamin D targets for chronic kidney disease management may be too low. Nephrol. 2016;29:63–70.
- Hollis BW. Circulating 25-hydroxyvitamin D levels indicative of vitamin D sufficiency: implications for establishing a new effective dietary intake recommendation for vitamin D. J Nutr. 2005;135:317–322.
- Holick MF. Vitamin D for health and in chronic kidney disease. Sem Dial. 2005;18:266–275.
- Jones G. The pharmacokinetics of vitamin D toxicity. Am J Clin Nutr. 2008;88:582S–586S.
- Thadhani R, Appelbaum E, Pritchett Y, et al. Vitamin D therapy and cardiac structure and function in patients with chronic kidney disease: the PRIMO randomized controlled trial. J Am Med Assoc. 2012;307:674–684.
- Wang AY-M, Fang F, Chan J, et al. Effect of paricalcitol on left ventricular mass and function in CKD: the OPERA trial. J Am Soc Nephrol. 2014;25:175–186.
- Coyne D, Acharya M, Qiu P, et al. Paricalcitol capsule for the treatment of secondary hyperparathyroidism in stages 3 and 4 CKD. Am J Kidney Dis. 2006;47:263–276.
- Coburn JW, Maung HM, Elangovan L, et al. Doxercalciferol safely suppresses PTH levels in patients with secondary hyperparathyroidisim associated with chronic kidney disease stages 3 and 4. Am J Kidney Dis. 2004;43:877–890.
- Hamdy NAT, Kanis JA, Beneton MNC, et al. Effect of alfacalcidol on natural course of renal bone disease in mild to moderate renal failure. Brit Med J. 1995;310:358–363.
- Coyne D, Goldberg S, Faber M, et al. A randomized multicenter trial of paricalcitol versus calcitriol for secondary hyperparathyroidism in stages 3-4 CKD. Clin J Am Soc Nephrol. 2014;9:1620–1626.