
ABSTRACT
We examined four species of sea pen (Anthoptilum grandiflorum, Halipteris finmarchica, Pennatula aculeata and Pennatula grandis) collected from the Gulf of St. Lawrence and mouth of the Laurentian Channel, eastern Canada. An exponential length–weight relationship was found for all four species, where growth in weight was progressively greater than growth in length with increasing colony size. Halipteris finmarchica, P. grandis and P. aculeata presented the better allometric fits, explaining over 80% of the variance. In addition, a count of growth increments visible in transverse sections in 86 A. grandiflorum and 80 P. aculeata samples was made. Presumed ages ranged between 5 and 28 years for A. grandiflorum and 2 and 21 years for P. aculeata. Radiocarbon assays were inconclusive and could not be used to confirm these ages; further age validation is required. Radial growth of the rod is slow during the first years, increasing at intermediate sizes of the colony and slowing down again for large colonies. Similar results were obtained from the relationship between colony length and number of growth increments where a logistic model was the best fit to the data. On average Spearman’s rank correlations showed 11% of shared variance between sea pen length or weight and environmental variables. Bottom temperature and salinity, depth and summer primary production were significantly correlated to sea pen size for most species.
SUBJECT EDITOR:
Introduction
Sea pens or pennatulaceans (Phylum Cnidaria, Order Pennatulacea) are colonial marine octocorals. Their colonial body is initiated by a single large primary polyp that usually anchors into soft sediment by a peduncle that forms a rachis extending towards the distal end (Figure S1). This single polyp buds to form secondary feeding and reproductive polyps (autozoids) and water-intake polyps (siphonozoids) and in some species, polyp-bearing leaves that are added to the base of the frond proximal to the peduncle (Antcliffe & Brasier Citation2008). Sea pens are passive suspension feeders and most have a mineralized central axial rod along the length of the colony, which along with internal sclerites provides rigidity so that the feeding polyps are optimally oriented in the water column. Sea pens are globally distributed from intertidal sand or mud flats to abyssal plains and hadal trenches, primarily in soft bottoms (Williams Citation2011), although a few species can inhabit hard bottoms by a sucker-like expansion of the proximal end of the peduncle (Williams & Alderslade Citation2011). Morphological diversity in the Pennatulacea is high and includes plumose, umbellate, clavate, foliate, capitate, digitiform, flagelliform and vermiform growth forms (Williams Citation2011).
Under suitable conditions, sea pens can form dense aggregations over large areas known as sea pen fields (Kenchington et al. Citation2014). These fields provide important structure in low-relief sand and mud habitats where there is little physical habitat complexity, creating biogenic habitat for suprabenthic and benthic invertebrates (Humes Citation1978; Fujita & Ohta Citation1988; Nygren & Pleijel Citation2010; Baillon et al. Citation2014a; De Clippele et al. Citation2015) and demersal fish (Malecha et al. Citation2005). Sea pens can also be a food source for some invertebrates (Birkeland Citation1974; Garcia-Matucheski & Muniain Citation2011). Sea pen fields can alter near-bottom water current flow, thereby retaining nutrients and entraining plankton and organic particles near the sediment (Tissot et al. Citation2006).
Due to their formation of biogenic habitat and poor recovery after fishing disturbance (Greathead et al. Citation2005; Troffe et al. Citation2005; Heifetz et al. Citation2009; Malecha & Stone Citation2009), sea pen concentrations are considered Vulnerable Marine Ecosystems (VMEs) (FAO Citation2009) in the North-west Atlantic, and the Northwest Atlantic Fisheries Organization (NAFO) has closed several areas to bottom-contact fishing gear on Flemish Cap to protect the sea pens there (NAFO Citation2017). In Canada, sea pen fields are considered Ecological or Biological Significant Areas (EBSAs; Kenchington Citation2014), as well as Significant Benthic Areas (DFO Citation2017) that require special management consideration. In the North-east Atlantic they are also listed in the OSPAR list of threatened and/or declining species and habitats (OSPAR Citation2008).
In the Gulf of St. Lawrence, eastern Canada (), sea pen concentrations extending over tens of kilometres have been identified by means of a kernel density analysis of catch records from trawl survey data (Kenchington et al. Citation2016b). Sea pen fields are present in patches along the Laurentian Channel at depths below 200 m, and the species known to form these concentrations are Anthoptilum grandiflorum (Verrill, 1879), Halipteris finmarchica (Sars, 1851), Pennatula aculeata Danielssen, 1860 and Pennatula grandis Ehrenberg, 1834. These fields contain the highest densities of sea pens in Atlantic Canada and the Eastern Arctic with individual trawls of 1 km length recording over 100 kg of sea pens (Kenchington et al. Citation2016b). Species distribution modelling (Kenchington et al. Citation2016a; Murillo et al. Citation2016a) has shown that there are large areas of suitable habitat along the Laurentian, Anticosti and Esquiman Channels (), with highest biomass in the Laurentian Channel (Murillo et al. Citation2016a). In adjacent international waters, sea pens form a major, regional-scale faunal group on the upper slopes of the Grand Bank (< 620 m) and Flemish Cap (< 500 m), typified by the sea urchin Phormosoma placenta Thomson, 1872, and the sea pens A. grandiflorum and Funiculina quadrangularis (Pallas, 1766) (Murillo et al. Citation2016b), although the biomass of catches there are approximately one order of magnitude less than those recorded from the Gulf of St. Lawrence (Murillo et al. Citation2011).
Figure 1. Map showing the location of trawl sets where sea pens were collected (Tables SI–SIII). The depth contour is 200 m. The polygons indicate high concentrations of sea pens (Sea Pen Significant Benthic Areas (SBA); Kenchington et al. Citation2016a). NGSL = Northern Gulf of St. Lawrence; SGSL = Southern Gulf of St. Lawrence; GEAC = Groundfish Enterprise Allocation Council; LEIM = Beam trawl survey; AC = Anticosti Channel; EC = Esquiman Channel; LC = Laurentian Channel.
Despite the global occurrence and conservation status of sea pens, little is known of their biology and ecology, and their vulnerability to fishing and other pressures has been assessed under a precautionary approach. Information on longevity, growth rates, population structure and reproduction of sea pens is necessary to evaluate their ability to recolonize and re-establish habitats after perturbation and to quantitatively assess the significant adverse impacts that fishing and other human activities can have on these VMEs (UNGA Citation2006). In particular, information on age and growth is often used to estimate natural mortality or total mortality, which are key components in the calculation of important population and demographic parameters, such as population growth rates and generation times.
Sea pen catchability from trawl gear and other traditional sampling methods, such as dredges or grabs, is very low (Troffe et al. Citation2005; Doyle et al. Citation2011; Kenchington et al. Citation2011), and therefore their abundance and biomass are underestimated using these sampling methods. Recently, alternative tools such as underwater imagery from remotely operated vehicles (ROVs) and towed sleds have been used to provide a better understanding of their numerical importance, to validate modelled distributions and to establish in situ monitoring (NAFO Citation2016; Rooper et al. Citation2017). Reliable age-length keys would greatly enhance the value of such imagery by enabling in situ estimates of sea pen population demography, and through length–weight relationships (e.g. Bird & Prairie Citation1985; Winters & Wheeler Citation1994; Kimmerer et al. Citation2005) their biomass could be estimated in order to understand the ecological function that sea pen fields play in bathyal and deep-sea ecosystems. In particular, the relationship between the visible portions of the sea pens (above the peduncle) and total length is needed, as imagery is unable to capture total length.
Here we examined length–biomass (wet weight) relationships for four species of sea pen present in the Gulf of St. Lawrence and the mouth of the Laurentian Channel, and the population size structure of sea pens from selected stations in the Gulf. We measured peduncle length and length and width of the axial rod in A. grandiflorum and P. aculeata, and estimated the length of peduncle that is buried in the former species. In addition, we attempted to estimate the age and radial growth by counting growth increments in cross-sections of the axial rod in A. grandiflorum and P. aculeata, validate the estimated age for P. aculeata through radiocarbon analysis, and provide a growth model for both species.
Material and methods
Study area and sample collection
The Gulf of St. Lawrence is a semi-enclosed sea that opens to the Atlantic Ocean through the Strait of Belle Isle and Cabot Strait (). Three deep channels cross the northern portion of the Gulf: the Laurentian Channel (>300 m deep), which connects the Atlantic Ocean to the St. Lawrence Estuary, and the Anticosti and Esquiman Channels (>200 m deep), which branch off northwards from the Laurentian Channel. The Gulf receives large freshwater runoff from eastern North America, mainly through the St. Lawrence River (Bourgault & Koutitonsky Citation1999), and it receives cold and saline Labrador Shelf Waters through the Strait of Belle Isle. A mixture of Labrador and Slope Water entering the Laurentian Channel from the continental shelf with temperature greater than 4°C and salinity higher than 33–34 constitutes the deep layer (Lauzier & Trites Citation1958). The Gulf of St. Lawrence and Estuary is one of the largest estuarine/marine ecosystems in the world (Dufour & Ouellet Citation2007).
Specimens of four sea pen species — the flagelliform Anthoptilum grandiflorum and Halipteris finmarchica, and the plumose Pennatula aculeata and Pennatula grandis — were collected from the Gulf of St. Lawrence and the Laurentian Channel during Department of Fisheries and Oceans, Canada (DFO) multispecies research trawl surveys and a Groundfish Enterprise Allocation Council (GEAC) Unit 2 survey in 2011 (, Table SI). These surveys sampled different areas of the Gulf of St. Lawrence and Laurentian Channel using different types of trawl gear: the northern Gulf of St. Lawrence (NGSL) survey sampled the northern part of the Gulf using a Campelen 1800 trawl equipped with a rockhopper footgear and 12.7 mm mesh lining in the codend (Archambault et al. Citation2012) and sea pens were collected at most of the stations along the channels; the southern Gulf of St. Lawrence survey (SGSL) sampled the southern part of the Gulf using a Western IIA trawl with no rockhopper and 19 mm mesh lining in the codend (Savoie et al. Citation2012), but sea pens were only collected along the southern edge of the Laurentian Channel overlapping with the NGSL; and the GEAC Unit 2 survey sampled the opening of the Laurentian Fan at the mouth of the Laurentian Channel with an Engel 170 trawl gear with 30 mm mesh lining in the codend (Kulka & Atkinson Citation2016). All surveys followed a stratified random sampling design based on depth and geographic region.
A total of 3266 specimens from 130 trawl sets were examined to establish the relationship between length and weight for each sea pen species (), with 2311 colonies of the four species collected in 2011 and 955 colonies of P. aculeata from two trawl sets separated by less than 10 km collected in 2015. These last P. aculeata samples were caught with a 3-m wide beam trawl equipped with heavy tickler chains and 17 mm mesh in the codend (LEIM in ). In addition, A. grandiflorum and P. aculeata samples for ageing were collected from 2001 to 2011, with most samples collected in 2001, 2002 and 2011 (Tables SII and SIII). Samples were frozen in a −20°C freezer upon collection and remained frozen until processing.
Table I. Numbers (No.) of trawl sets and specimens of sea pens by species from 130 trawl sets used to establish the length–weight relationships.
The validity of the growth increments as age indicators in P. aculeata was assessed on a specimen (Pa058, Table SIII) obtained after considerable searching by Dr Pierre Brunel (Institut Québécois de la Biodiversité (IQBIO), care of Département de Sciences Biologiques, Université de Montréal). This specimen was collected in the Gulf of St. Lawrence off Rimouski, northern Quebec on 12 July 1972; therefore, it was determined to be a good candidate for 14C analysis since its growth sequence would be expected to span the period of increasing radiocarbon concentrations (1958–1965). The specimen was initially placed in formalin at sea but was transferred to 70% ethanol with 4% glycerine within a few weeks of collection. Another specimen collected in 2011 (Pa009, Table SIII), frozen before being processed, was used as a control.
Morphometric relationships
The total length (straightened out for measurement in A. grandiflorum and measured to the apex of the distal leaf in P. aculeata and P. grandis, Figure S1a) and wet weight of the four sea pen species were measured to the nearest mm and nearest 0.01 g, respectively, from the thawed samples. Scatterplots of length and weight were created for each sea pen species. Length–weight relationships were expressed by the standard allometric equation:(1)
where W is the colony wet weight in grams, L is the colony length in mm, a is the intercept and b represents the rate of increase (i.e. slope). Samples with missing tissue were not considered in the length–weight relationships.
The mean values of colony length and weight of each sea pen species per trawl set of the 2011 surveys (Table SI) were plotted and the Spearman’s rank correlation between these values and 62 environmental variables derived from various sources (Beazley et al. Citation2016, Citation2017; Guijarro et al. Citation2016) was calculated. Differences between mean values of colony length and weight of each sea pen species in each survey (NGSL, SGSL and GEAC Unit 2) were tested using the non-parametric Kruskal–Wallis test between groups and when significant differences were detected the Mann–Whitney U test between pairs of groups was run to identify the groups responsible for the differences. These surveys represent areas with different physical characteristics within the Gulf of St. Lawrence; in particular, the GEAC Unit 2 survey covers areas where surface and bottom salinities are higher than elsewhere due to the reduced influence of freshwater outflow from the St. Lawrence River (Richaud et al. Citation2016). As noted above they also represent different trawl configurations and mesh sizes. Consequently, differences in mean values among and between surveys could be due to both environmental and catchability factors. To address the catchability issue to the extent possible, we identified a common area in the Laurentian Channel sampled by both the NGSL and SGSL surveys (). Mann–Whitney U tests between these surveys in the common area were run for each species. Trawl sets included in the common area are indicated in Table SI.
Additional morphometric data were collected for each individual of A. grandiflorum and P. aculeata collected for ageing. Morphometric measurements included total length, peduncle length, estimated peduncle length from basal tip to substrate surface (for A. grandiflorum only, as no physical mark is evident in P. aculeata, Figure S1b), and after dissection, length and width (measured at the location of the maximum diameter) of the axial rod. Total weight, tissue weight and axial rod weight were also recorded (Tables SII and SIII). Regressions between total length and length without peduncle and between total peduncle length and estimated peduncle length from basal tip to substrate surface in A. grandiflorum (peduncle buried in sediment) were calculated. The Pearson correlation between the proportion (in %) of peduncle length with respect to the total length of the colony was computed for both species and between the proportion (in %) of peduncle length with respect to the peduncle buried in sediment for A. grandiflorum.
The length frequency distributions from seven trawl sets containing more than 100 colonies of the same species were plotted; three for A. grandiflorum, two for P. aculeata (one of them includes the two adjacent trawl sets collected in 2015 where the samples were combined), and two for P. grandis (Table SI). Five of these sets were located inside Sea Pen Significant Benthic Areas (Kenchington et al. Citation2016a), making them good candidates for the study of the population size structure of the sea pen fields from the Gulf of St. Lawrence. Measurements were grouped into size classes of 10 mm for A. grandiflorum and 5 mm for P. aculeata and P. grandis. For this analysis samples with missing tissue but complete length were included.
Ageing
A total of 129 samples for each of A. grandiflorum and P. aculeata were processed. Of these, 86 A. grandiflorum and 80 P. aculeata were aged using presumed annual growth increments, while increment width was measured in a subset of 48 and 64, respectively. Not all samples were candidates for ageing and measuring as some were damaged during processing while others had growth increments that were not concentric. The non-concentric growth increments may have been the result of uneven sectioning or strong unidirectional currents causing asymmetric growth.
Preparation of sections for age determination
A 20-mm long section of the axial rod of each sea pen was taken at the maximum diameter of the rod, and allowed to dry at room temperature for 2–4 weeks. Once dry, each rod section was placed in a 2-ml screw top plastic vial with a small amount of duct seal compound on the bottom to secure the rod in a vertical position. A hydrophilic embedding resin (LR White) was then added and the vials were sealed. The vials were placed in an oven at 60°C to cure the resin. The vials were cut transversely using a Buehler Isomet low speed saw fitted with paired diamond blades, producing a 3 mm-thick cross-section of the axial rod embedded in resin. The section was then affixed to a standard microscope slide using epoxy resin and held in place by a press until the epoxy cured (1–2 days). The samples were ground to a section thickness of 350 μm on a Buehler Petro thin sectioning system and further ground using a Meta Serv 3000 variable speed grinder/polisher, using 150 µm and 30 µm grit discs. The samples were then polished using 0.6 µm alumina micropolish cream with a micropolish cloth.
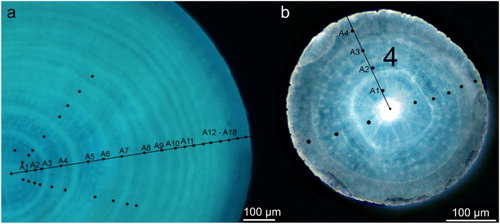
The prepared sections were photographed at 1280 × 1024 resolution under a Nikon E800 Eclipse microscope equipped with a Nikon DS-Ri1 camera of 12 bit per channel output for 36 bit colour images. The magnifications used were between 40× and 100×. Although the images were taken using transmitted light, it was determined that the UV filter (X) gave better definition for some of the sections so both images were captured. The images were imported into PhotoShop CS2, where putative growth increments visualized as rings were marked. When necessary the images were digitally enhanced for grey scale and sharpness using the Adjustment levels tool and Unsharp Mask filter. In order to estimate the radial growth, the distance between growth increments was measured using Image Pro Plus version 5.1. Identification of growth increments was facilitated by the light/dark couplets. The sea pens were difficult to age because different growth increment counts could be obtained in different areas of the same section as shown in by the black dots, and therefore age confidence was ranked as poor, satisfactory, good, or very good for each section (Tables SII and SIII).
Figure 2. Cross-section under ultraviolet (UV) light (100× magnification). a, Anthoptilum grandiflorum; b, Pennatula aculeata. The putative growth increments visualized as rings are marked by black dots.
Age validation
The onset of nuclear testing in the late 1950s resulted in a marked and widespread increase in Δ14C in marine dissolved inorganic carbon (DIC) which is easily detected in all marine carbonates growing in surface waters during the 1960s (Druffel Citation1989; Campana & Jones Citation1998), and has been used successfully to determine skeletal age and growth in the gorgonian coral Primnoa resedaeformis (Gunnerus, 1763) (Sherwood et al. Citation2005), among others. To assign dates of formation to an unknown sample, it is necessary that the Δ14C of the unknown sample be compared with a Δ14C chronology based on known-age material (a reference chronology). To match the water mass characteristics of the sea pen habitat, we used a reference chronology for the North-west Atlantic Ocean which is representative of all calcified growth bands analysed to date (Campana et al. Citation2008). This chronology would be expected to show Δ14C values comparable to those of the sea pens, as it has for deep water corals in the region (Sherwood et al. Citation2008).
Three samples were isolated from each sea pen using 1-mm thick transverse sections of the sea pen rod, taken approximately at the location of the maximum rod diameter. All sections were prepared with a single cut using paired blades separated by a spacer on an Isomet low-speed diamond-bladed saw. Sections were digitally photographed at 2048 × 2048 resolution under a binocular microscope at 16–40× magnification using reflected light while immersed in ethanol. Age interpretation was based on images enhanced for contrast using Adobe Photoshop CS2 following the procedure detailed above.
Sea pen cores representing what was assumed to be the first 5–15 years of life were isolated as a solid piece with a Merchantek computer-controlled micromilling machine using 300-µm diameter steel cutting bits and burrs. Attempts to mill out individual growth bands were unsuccessful, due to the low density of the sea pen material. Therefore, core material was obtained from 2–17 transverse sections and then combined. This procedure of obtaining material from multiple sections per sea pen was necessary to maximize the amount of sample material available for assay (2 mg minimum) from each sea pen. An additional sample was micromilled from the outer half of the section from specimen Pa058 so as to represent the more recent growth history. The date of sample formation was calculated as the year of sea pen collection minus the age span of the animal from the edge of the rod to the midpoint of the range of growth increments present in the extracted core. The sample was weighed to the nearest 0.1 mg in preparation for 14C assay with accelerator mass spectrometry (AMS). AMS assays also provided δ13C (0/00) values, which were used to correct for isotopic fractionation effects and provide information on the source of the carbon. Radiocarbon values were subsequently reported as Δ14C, which is the per mil (0/00) deviation of the sample from the radiocarbon concentration of nineteenth century wood, corrected for sample decay prior to 1950 according to methods outlined by Stuiver & Polach (Citation1977). The mean standard deviation of the individual radiocarbon assays was about 50/00.
Growth models
Age-length data for A. grandiflorum and P. aculeata were fitted using the ‘grofit’ package (Kahm et al. Citation2010) from the statistical computing software R (R Development Core Team Citation2015). Three parametric models (logistic, Gompertz and Richards; Table SIV) were considered to estimate the growth parameters (λ-lag phase, μ-maximum growth rate and A-maximum growth). Confidence intervals for all derived parameters were estimated by bootstrap and cross-validation techniques. The model with lowest Akaike Information Criterion (AIC) (Akaike Citation1973) was considered the best fit to the data.
Results
Morphometric relationships
For 3 of the 4 species, mean colony length was larger in the samples from the mouth of the Laurentian Channel (GEAC Unit 2 survey) and the differences between the GEAC survey and the surveys with the smallest mean colony length were in the order of 70–110 mm (Figure S2, Table SV). Overall and pairwise comparisons of mean colony length in surveys were all significantly different (Table SV). The larger mean colony lengths in the GEAC survey were at least in part due to the lack of small colonies, with minimum colony size in that survey being greater by about 90–100 mm in P. aculeata, 200–220 mm in P. grandis and 200–260 mm in A. grandiflorum than in the two other surveys (Table SV). In the case of H. finmarchica, only one specimen was collected in the GEAC Unit 2 survey, and this was between 800 and 1000 mm larger than the mean length of the samples collected in the other surveys. However, there were no obvious geographic trends in species length within the Gulf of St. Lawrence (Figure S2). Halipteris finmarchica was the largest species studied, ranging between 60 and 1400 mm (, Table SV), followed by A. grandiflorum (range 30–855 mm), P. grandis (range 31–641 mm) and P. aculeata (range 26–260 mm).
Figure 3. Length (L)–weight (W) relationship for each sea pen species studied.
Mean colony weight presented a similar pattern to mean colony length, and for all the species the largest mean values were found at the mouth of the Laurentian Channel in the GEAC Unit 2 survey (Figure S3, Table SVI), although significant differences were found only for A. grandiflorum and P. aculeata. In this case, P. grandis presented the largest mean weights in all the surveys, although A. grandiflorum was the heaviest species studied (), with weight values ranging between 0.1 and 113.2 g. Pennatula grandis was the second heaviest species, ranging between 0.1 and 84 g, followed by H. finmarchica (range 0.1–37.7 g) and P. aculeata (range 0.1–12.3 g).
When only the samples obtained from the common area in the NGSL and SGSL surveys were compared, differences between surveys were found in mean colony length for A. grandiflorum and P. aculeata and in mean weight for P. aculeata (Tables SV and SVI). In the three cases, values were greater in the north than in the south survey.
The allometric equation was a better fit of the relationship between length and weight than was the linear equation for each of the four species (, ). This difference was greater in P. grandis and A. grandiflorum, where the r2 of the allometric relationship was 20% higher than the values obtained with the linear relationship. Halipteris finmarchica, P. grandis and P. aculeata presented the better allometric fits, explaining over 80% of the variance.
Table II. Length(L)–weight(W) relationship for each sea pen species.
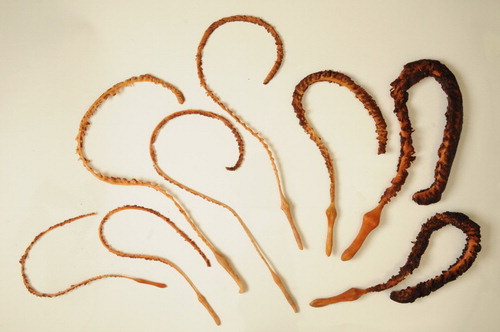
The plumose P. aculeata and P. grandis were heavier at length than the flagelliform A. grandiflorum and H. finmarchica (). Six samples of A. grandiflorum over 60 g (a) presented distinctively heavier colonies for their length than the other similarly long colonies. Three of these samples were collected in one set from the NGSL survey (TEL2011008110). These colonies presented an unusually thick appearance compared with other colonies of the same length (). Removing these six heavier colonies from the data set prior to fitting the regression only improved the r2 value by one hundredth.
Figure 4. Samples of Anthoptilum grandiflorum from the NGSL survey showing different morphology at similar length of 400–600 mm. Two unusual thicker and heavier colonies are shown at the right of the picture.
Bottom temperature and salinity, depth and summer primary production were significantly correlated to length or weight of most species. On average Spearman’s rank correlations showed 11% of shared variance between sea pen length or weight and environmental variables, with the maximum being 30%. All significant correlation coefficients with mean colony length or weight for each sea pen species were less than 0.55 (Table SVII), and the mean correlation coefficient was 0.34. Mean colony length and weight of A. grandiflorum were positively correlated with different metrics of bottom and surface temperature and salinity, depth, and maximum layer depth, whereas they were negatively correlated with chlorophyll a and primary production. Only the colony length of H. finmarchica was negatively correlated with summer primary production mean and minimum (and these were the highest correlations, Table SVII). In the case of P. aculeata, the mean colony length was positively correlated with different metrics of bottom temperature and salinity, and depth, whereas it was negatively correlated with summer primary production. Colony weight followed a similar pattern, although in this case it was also positively correlated with spring and annual primary production and negatively with slope. Mean colony length of P. grandis was positively correlated with summer maximum layer depth and surface temperature average minimum, and it was negatively correlated with summer chlorophyll a minimum. Mean colony weight was only positively correlated with different metrics of bottom temperature and salinity.
In A. grandiflorum and P. aculeata the r2 of the regression between the total length and length without the peduncle was close to 1 (Figure S4). The peduncle in P. aculeata represented a mean (± SD) of 43% (± 5) of the total length, ranging between 33% and 57%, whereas in A. grandiflorum it only represented 18% (± 4) and ranged between 11% and 30%. This proportion decreased significantly (P < 0.001) with increasing length for both species, more so in A. grandiflorum (Pearson correlation, r = −0.87) than in P. aculeata (r = −0.36).
The r2 of the regression between the estimated length of peduncle buried in sediment and the total peduncle length in A. grandiflorum was also close to 1 (Figure S5) and the proportion of peduncle buried in sediment ranged between 70% and 90% with a mean (± SD) of 80% (± 4). This proportion increased significantly (P = 0.016) with increasing length (Pearson correlation, r = 0.27).
Length analysis
Length frequency distributions for the selected trawl sets were, except in one case, skewed to the right, with no or few small colonies (). The length of A. grandiflorum from the selected trawl sets containing more than 100 colonies ranged between 30 and 718 mm (a–c). The smallest colonies appeared in trawl sets TEL2011194069 and TEL2011194111 from the SGSL survey (a and 5b) with a mean length of 373 and 404 mm, respectively. Colonies collected in the trawl set TEL2011008011 of the NGSL survey were larger than 300 mm and presented a mean length of 576 mm (c). The previous comparison of average lengths from a common area (Table SV) indicates that at least some of this difference could be attributed to the different types of survey gear.
Figure 5. Frequency histograms of length classes for selected trawl sets in the Gulf Region. a–c, Anthoptilum grandiflorum; d and e, Pennatula aculeata; f and g, Pennatula grandis. N, number of colonies. Survey Trawl Code set is indicated at the upper right corner of each panel: TEL/LEIM = Vessel; 2011/2015 = year; 194/008 = mission number/XXX = set number. a–d and g occur in sea pen Significant Benthic Areas (SBAs).
The length of the colonies of P. aculeata ranged between 36 and 237 mm in the SGSL survey trawl set with a mean value of 83 mm (d). The sharp cut-off in the abundance of sea pens at 36 mm in this trawl set could be caused by gear selectivity, where smaller colonies would not be retained. Data obtained in 2015 from the two combined trawl sets represented a large sample with 955 records, where the colonies ranged from 29 to 181 mm with a mean value of 108 mm (e).
In the case of P. grandis, two trawl sets were studied (f and 5 g). Both trawl sets presented similar length distributions ranging from 76 to 528 mm, mean values of 339 and 358 mm and a few small colonies. In the SGSL trawl set, these small colonies formed a distinct cluster.
Ageing
Colony length of the samples used for ageing ranged between 61 and 765 mm for A. grandiflorum and between 17 and 309 mm for Pennatula aculeata. Presumed ages varied between 5 to 28 years for A. grandiflorum and 2 to 21 years for P. aculeata, although ages of up to 63 years were possible if the less prominent growth increments were counted (). For both species only 10% of the aged sections were considered poor, with most being considered good or very good in A. grandiflorum (52%) and at least satisfactory in P. aculeata (90%).
The radiocarbon assays were highly depleted relative to the North-west Atlantic reference chronology (), despite the fact that other deep-sea corals fit this chronology well. Although the presumed pre-bomb (before 1958) samples were considerably more depleted than the presumed post-bomb sample (as would be expected), the two pre-bomb radiocarbon values of −285 and −325 were well below what might be expected of any living organism in the North Atlantic. The core value of −104 observed for sample Pa009, collected in 2011, was realistic for a pre-bomb signature, but this sample should have been post-bomb based on the presumed age from growth increment counts and collection date. Therefore, the trends of radiocarbon with presumed year of formation were correct, but the absolute values were perplexing. In contrast, the observed δ13C mean value of −15.3 was exactly that expected of metabolic carbon at depth (Nielsen et al. Citation2016).
Table III. Colony characteristics and radiocarbon assay results for three specimens of Pennatula aculeata.
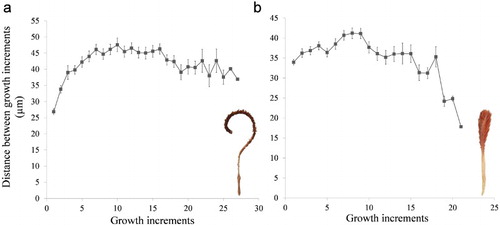
Distance between successive growth increments ranged between 26.9 and 47.6 µm for A. grandiflorum and between 17.8 and 41.2 µm for P. aculeata with a mean (± SE) of 41.8 ± 4.6 µm and 34.5 ± 5.9 µm, respectively. In A. grandiflorum, the distance was at a minimum during the first early growth increments, increasing until increment 7, where the distance between growth increments remained relatively constant until increment 16, when growth started to slightly decrease (a). In the case of P. aculeata (b) the distance between successive growth increments had a mean (± SE) of 38 ± 2 µm during the first 11 increments, reaching a maximum between increments 7 and 9. Afterwards the increase was lower with a mean (± SE) of 31 ± 6 µm between growth increments 12 and 21, reaching the minimum increase at the last growth increment counted. The axial rod presented a linear relationship with sea pen length for A. grandiflorum (r2 = 0.83) and exponential for P. aculeata (r2 = 0.84) (Figure S6). For the latter, the exponential fit was a 6% improvement over a linear fit, although both explained a high proportion of the variance.
Figure 6. Average (± SE) distance (µm) between successive growth increments. a, Anthoptilum grandiflorum; b, Pennatula aculeata.
Growth model
Assuming that the growth increments were formed annually and interpreted correctly, the best growth model to fit A. grandiflorum and P. aculeata was the logistic model (, ). The model would estimate a maximum length (A) of 649 mm and maximum growth rate (μ) of 43 mm length year−1 for A. grandiflorum and 402 mm and 19 mm length year−1, respectively, for P. aculeata. Gompertz models gave a slightly larger maximum length for A. grandiflorum but almost doubled the logistic model maximum for P. aculeata. No appropriate description of the growth curve was provided by the Richards model for P. aculeata.
Figure 7. Relationship between colony length (mm) and number of growth increments following a logistic (black line), Gompertz (red line) and Richards model (blue line). a, Anthoptilum grandiflorum; b, Pennatula aculeata.
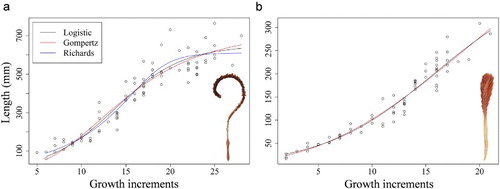
Table IV. Growth parameters estimated for Anthoptilum grandiflorum and Pennatula aculeata through Gompertz, logistic and Richards models.
Comparing the length frequency histograms () with the growth model for each species (), the mean colony length of A. grandiflorum observed in the SGSL survey (a and 5b) could correspond to colonies 15–16 years old, whereas mean colony length in the NGSL survey (d) would correspond to older animals of ∼21 years. The colonies smaller than 100 mm observed in the SGSL survey would be younger than 8 years old, indicating some recent recruitment in these areas. For P. aculeata, the mean colony length observed in the SGSL survey (d) would correspond to colonies younger than 9 years old, whereas in the LEIM survey the colonies would be between 10 and 11 years old.
Discussion
All sea pen species studied to date are gonochoric, with separate sexes at the colony level, with a population sex ratio of 1:1. They appear likely to be broadcast spawners (Chia & Crawford Citation1973; Tyler et al. Citation1995; Soong Citation2005; Edwards & Moore Citation2008; Pires et al. Citation2009; Baillon et al. Citation2014b, Citation2015), and produce large lecithotrophic larvae (Chia & Crawford Citation1973; Edwards & Moore Citation2008, Citation2009; Baillon et al. Citation2015). The species in our study likely present different reproductive strategies: A. grandiflorum and H. finmarchica have shown annual spawning (Baillon et al. Citation2014b, Citation2015), whereas P. aculeata is probably a continuous spawner (Eckelbarger et al. Citation1998). No information on reproduction is available for P. grandis.
Even less is known about the recruitment dynamics of sea pens. Corals present patchy distributions across similar environmental conditions rather than occurring continuously over large areas of seemingly suitable habitat (e.g. Beazley Citation2008; Gonzalez-Mirelis & Lindegarth Citation2012). Recruitment in Ptilosarcus gurneyi (Gray, 1860) occurs either annually or every few years but was described as being highly clumped, spatially unpredictable and patchy, creating 20–200 m length-patches of discrete size groups that could be observed within the boundaries of the fields (Birkeland Citation1974). Large inter-annual differences in recruitment have also been observed in Renilla koellikeri Pfeffer, 1886, a shallow-living sea pen from the coast of California (Davis & VanBlaricom Citation1978). The size frequency distributions observed herein suggest that recruitment occurs in multiyear pulses, with intervening multiyear periods of limited or null recruitment. These observations could also indicate an initial fast growth with accumulation of older (larger) colonies, although this would contradict the results obtained from the growth models for A. grandiflorum and P. aculeata () and other octocorals (Cordes et al. Citation2001). Our results could indicate low levels of population recruitment, and/or high mortality of young colonies that could be more vulnerable to predators. It is less likely that small sea pens occur on different bottoms than those represented by the trawl sets selected to produce the length frequency distributions; however, a patchy recruitment could have meant that sampled areas were not recruited to over the past decade by chance. A longer time frame of collections, ground-truthing with underwater cameras and more length frequency distributions from different areas would be needed in order to resolve this question.
Our study used different types of trawl gear to sample the sea pens and significant intra-specific differences in morphometry among surveys were observed, even when a common area was delimited. These results reinforce the conclusion that trawls are not good sampling tools for estimating true population size distributions of sea pens due to catchability issues (Kenchington et al. Citation2011). Nevertheless, the average colony lengths found at the mouth of the Laurentian Channel (LC) were similar to those reported in Baillon et al. (Citation2016) for the same region and species despite differences in trawl gear (i.e. different mesh lining in the codend); however, this similarity could be spurious. We have stronger evidence that different length and biomass distributions found between areas reflect local population differences related to the environmental conditions, considering that individual size and animal growth are related to food availability and environmental conditions, such as water movements (Sebens Citation1984, Citation1987). Based on the significant correlations found, temperature, salinity, depth, primary production and chlorophyll a account for on average ∼11% of the variation (maximum of 30%) in mean colony length and weight. This is consistent with the results of random forest species distribution models in this region (Murillo et al. Citation2016a) that found that sea pen fields formed by mixed species assemblages had bottom salinity as the top predictor for presence/absence and spring primary production and temperature as top predictors for biomass in the SGSL and NGSL respectively.
Data on the age structure of populations would help elucidate the recruitment dynamics and population demographics of sea pens. The few published studies on sea pen age and growth were based on marking/tagging field studies and/or growth increment counts of the skeletal structure. Growth increment or ring counts are the most prevalent source of age data (Birkeland Citation1974; Wilson et al. Citation2002; de Moura Neves et al. Citation2015), and radiometric techniques (e.g. 210Pb dating), radiocarbon dating and trace element analyses have all been attempted in order to validate the assumption of an annual periodicity of growth rings, with no success. Only Birkeland (Citation1974) following the in situ growth of P. gurneyi newly recruited to cleared plots was able to demonstrate unequivocally that early growth rings (to Age 3) were formed annually, similar to other octocorals and antipatharians (Andrews et al. Citation2002; Risk et al. Citation2002; Sherwood & Edinger Citation2009).
Some studies have made cross-inference of annual ring formation between sea pens and gorgonian corals (e.g. Wilson et al. Citation2002). However, this assumption is not valid. Sea pens are a sister taxon of the gorgonian family Ellisellidae (McFadden et al. Citation2006) which explains the similarity between the axis structure (Bayer Citation1955) and radial growth process (Lewis et al. Citation1992) described for both taxa. However, this structure in sea pens differs from that of other gorgonian octocorals in which Sherwood (Citation2002) identified three growth zones: a central rod similar to the axial rod in pennatulids, a ‘horny axis’ made of calcite and the protein gorgonin, and an outer calcite cortex. Ring formation in the horny cortex of gorgonians corals is caused by changes in the ratio of gorgonin:calcite resulting in light and dark band couplets (Risk et al. Citation2002). Validation of ageing in non-Ellisellidae octocorals cannot be assumed to apply to sea pens. In absence of validation data from ellisellids and sea pens we concur with Narvaez et al. (Citation2016), who caution against interpreting growth rings as annual. This is reinforced by our observations of the presence of lighter rings in some sections that if counted could triple the maximum age recorded.
In sea pens the extracellular matrix (ECM) of the axial rod is composed of collagen fibres (Tillet et al. Citation1996) which provide structural support and influence a number of biochemical processes including cellular proliferation and differentiation. Ledger & Franc (Citation1978) examined the ECM in the axial rod of the sea pen Veretillum cynomorium (Pallas, 1766) and confirmed that it was formed of a matrix of collagen fibres embedded in columns of high magnesium calcite. The radius of this axial rod increases as calcite forms, producing lobed nodules which ultimately fuse and form the core of the axis. Wilson et al. (Citation2002) proposed that radial growth differs above and below the sediment interface, with the lower sections radiating out through production of a ‘rough matrix’ and upper sections showing smooth concentric ring formation. The nature of the ring formation in sea pens is not clear, but according to Franc et al. (Citation1974) it is related to the parallel alignment of terminal expansions of certain epithelial cells, ‘cellules à cheminée’, described in V. cynomorium, and that are equivalent to the ‘striated plate cells’ of the epithelium surrounding the gorgonian axis (Bouligand Citation1968).
Interpretation and enumeration of growth bands in calcified structures is a common technique for ageing fishes, sharks and marine mammals (e.g. Campana and Stewart Citation2014; Christiansen et al. Citation2016; Dwyer et al. Citation2016), as well as marine invertebrates including corals, bivalves and recently crustaceans (e.g. Andrews et al. Citation2002; Peharda et al. Citation2007; Kilada et al. Citation2012). The bomb radiocarbon technique for age validation widely used in fish (e.g. Campana & Jones Citation1998; Campana et al. Citation2008) has also been successfully used for different corals in the north Atlantic (Sherwood et al. Citation2005; Sherwood & Edinger Citation2009). However, this technique is best applied to growth increments formed during the 1958–1967 period of rapidly increasing radiocarbon concentrations, which requires samples collected prior to the 1990s for specimens less than 30 years old. In this study, a sample of P. aculeata (Pa058), 16 years old when it was collected in 1972, according to the number of growth increments, was available for age validation. This specimen should have been a good candidate for radiocarbon dating. Although the gradient in radiocarbon between core and edge was consistent with bomb effects, the absolute values were too depleted to be explicable in terms of the radiocarbon in either DIC or DOC in the water. It is difficult to explain these results, other than to conclude that the growth of the sea pens is neither radial nor longitudinal, or that the extended period in 70% ethanol (which is mildly acidic) may have decalcified the sample and somehow affected the results (although the control sample which was only frozen did not conform to expectation either). In addition, the low density and the δ13C assays indicated that the sea pen’s axial rod is more likely to be composed of organic matter, rather than calcium carbonate or hydroxyapatite, as would be expected, which leaves open the possibility that the radiocarbon derived from organic matter in very old surrounding sediments would confound the radiocarbon values.
In this study, radiocarbon assays were not helpful in confirming the age of the sea pens. Other authors have used the trace element composition in the axis of sea pens for age validation (de Moura Neves et al. Citation2015), finding that the number of rings and the number of peaks in trace element ratios were related, but they were not able to demonstrate that the external environment was linked to the ratio values and therefore these results can provide a correlated cycle but not a validated age. Presuming that the growth increments were formed annually, the maximum ages obtained in A. grandiflorum and P. aculeata would fall within previously published ranges for pennatulids of between 15 and 50 years (Birkeland Citation1974; Wilson et al. Citation2002). However, neither of these studies validated age either, at least not past Age 3. Indeed, Wilson et al. (Citation2002) found comparable results to us, in that the radiometric signal was confused, suggestive of either metabolic mixing or non-radial growth. Consequently, without validation, it is not possible to determine when the growth increments are formed and more research focused on in situ monitoring or other means of producing validated age studies should be carried out (for a review of age validation methods see Campana (Citation2001)). Our review of the known growth of sea pens discussed above identified knowledge gaps related to ring formation in these species. Detailed growth studies at the cellular level with associated biochemical analysis of the ECM could reveal novel growth mechanisms which would explain the anomalous results found herein and by Wilson et al. (Citation2002).
The analyses of the growth increments related to colony length and the axial rod width showed slower growth for the smaller colonies, increasing at intermediate sizes and slowing down again for large colonies. This is similar to other octocorals, with colonies having a slow initial growth followed by an exponential increase and plateau to an asymptotic size (Cordes et al. Citation2001; Wilson et al. Citation2002). This growth pattern has been related to the feeding rate relative to effective colony surface area (McFadden Citation1991; Cordes et al. Citation2001). For passive suspension feeders such as sea pens, an energetically determined optimal size derived by maximizing the difference between energy intake and cost has been proposed (Sebens Citation1979). When a sea pen colony becomes taller it is increasingly subject to bending because current velocity increases with distance from the sea floor, moving up through the boundary layer. Bending will cause competition between feeding polyps which could explain why the tallest species have no or only very short leaves (thus less drag), except for P. grandis that can become taller than P. aculeata but is also more robust at any size. The positive exponential relationship found for P. aculeata indicated that rod diameter growth is initially relatively faster than rod length growth. This would provide greater support for a plumose species which due to its drag may require more rigidity than a flagelliform species such as A. grandiflorum.
The logistic and Gompertz models have been used previously to study the growth of octocorals (Velimorov Citation1975; Cordes et al. Citation2001). In this study, the logistic model also offered the best fit to the data, although it underestimated the maximum length in both species, by more than 100 mm in the case of A. grandiflorum. The Gompertz model estimated greater total length for both species. However, due to the lack of age validation, the growth models proposed should be interpreted with caution.
Our study has yielded new information on the morphometry of sea pens. The peduncle length:colony length ratio was greater in P. aculeata than in A. grandiflorum, as observed by Baillon et al. (Citation2016). We found that this ratio decreased significantly for both species with increasing colony length, being more pronounced in A. grandiflorum. This contrasts with Baillon et al. (Citation2016), who did not observe variation of the proportion of peduncle length with colony length for P. aculeata. Our results support the conclusions from Baillon et al. (Citation2016) that long sea pens do not need to be associated with long peduncles once they are wide enough to support the colony weight.
All four sea pens showed an exponential length–weight relationship, where growth in weight is progressively greater than growth in length with increasing colony size (more evident in P. grandis). This is consistent with recent reports of the early growth of octocorals (Rooper et al. Citation2017).
We were able to confirm a very clear relationship between total length and peduncle length for A. grandiflorum and P. aculeata, and with proportion of peduncle length buried in sediment (for A. grandiflorum), potentially allowing total length to be inferred from underwater imagery which shows only the sea pen rachis extending above the sediment. Further, there is a similar strong relationship between length and weight noted above, allowing for conversion to biomass. However, there remains the challenge of estimating colony length with precision from underwater pictures (S. de Mendonça, Dalhousie University, Halifax, Canada, pers. comm.), which must be resolved before this information can be used to convert above sediment length to whole colony biomass from in situ video or images.
Future research should focus on controlled monitoring of fixed stations with underwater cameras in order to evaluate sea pen recoverability after perturbation directly. Long-term tagging experiments might be the best source of age validation in light of experiences to date.
Supplemental Material: Morphometry and growth of sea pen species from dense habitats in the Gulf of St. Lawrence, eastern Canada
Download MS Word (4 MB)Acknowledgements
We thank Warren Joyce of Fisheries and Oceans, Canada at the Bedford Institute of Oceanography for technical assistance in preparing the samples for radiocarbon assay. We acknowledge Lindsay Beazley and Jae Choi for their comments on early versions of the manuscript.
Disclosure Statement
No potential conflict of interest was reported by the authors.
Additional information
Funding
Related Research Data
References
- Akaike H. 1973. Information theory and an extension of the maximum likelihood principle. In: Csáki F, Petrov BN, editors. Second International Symposium on Information Theory. Budapest: Akadémiai Kiadó, p 267–281.
- Andrews AH, Cordes EE, Mahoney MM, Munk K, Coale KH, Cailliet GM, Heifetz J. 2002. Age, growth and radiometric age validation of a deep-sea, habitat-forming gorgonian (Primnoa resedaeformis) from the Gulf of Alaska. Hydrobiologia 471:101–110. doi: 10.1023/A:1016501320206
- Antcliffe JB, Brasier MD. 2008. Charnia at 50: developmental models for Ediacaran fronds. Palaeontology 51:11–26. doi: 10.1111/j.1475-4983.2007.00738.x
- Archambault D, Bourdages H, Bernier B, Fréchet A, Gauthier J, Grégoire F, et al. 2012. Preliminary results from the groundfish and shrimp multidisciplinary survey in August 2011 in the Estuary and northern Gulf of St. Lawrence. DFO Canadian Science Advisory Secretariat Research Document 2011/112. 97 pages.
- Baillon S, English M, Hamel J-F, Mercier A. 2016. Comparative biometry and isotopy of three dominant pennatulacean corals in the Northwest Atlantic. Acta Zoologica 97:475–493. doi: 10.1111/azo.12141
- Baillon S, Hamel J-F, Mercier A. 2014a. Diversity, distribution and nature of faunal associations with deep-sea pennatulacean corals in the northwest Atlantic. PLoS One 9(11):e111519. 16 pages. doi: 10.1371/journal.pone.0111519
- Baillon S, Hamel J-F, Mercier A. 2015. Protracted oogenesis and annual reproductive periodicity in the deep-sea pennatulacean Halipteris finmarchica (Anthozoa, Octocorallia). Marine Ecology 36:1364–1378. doi: 10.1111/maec.12236
- Baillon S, Hamel J-F, Wareham VE, Mercier A. 2014b. Seasonality in reproduction of the deep-water pennatulacean coral Anthoptilum grandiflorum. Marine Biology 161:29–43. doi: 10.1007/s00227-013-2311-8
- Bayer FM. 1955. Contributions to the nomenclature, systematics, and morphology of the Octocorallia. Proceedings of the United States National Museum 105:207–220. doi: 10.5479/si.00963801.105-3357.207
- Beazley L. 2008. Reproductive strategies as the determinant of spatial structure of deep-water corals of the Northeast Channel. Honours Thesis. Halifax, NS: Dalhousie University, Biology Department. 69 pages.
- Beazley L, Guijarro J, Lirette C, Wang Z, Kenchington E. 2017. Characteristics of environmental data layers for use in species distribution modelling in the maritimes region. Canadian Technical Report of Fisheries and Aquatic Sciences 3212. 327 pages.
- Beazley L, Lirette C, Sabaniel J, Wang Z, Knudby A, Kenchington E. 2016. Characteristics of environmental data layers for use in species distribution modelling in the Gulf of St. Lawrence. Canadian Technical Report of Fisheries and Aquatic Sciences 3154. 357 pages.
- Bird DF, Prairie YT. 1985. Practical guidelines for the use of zooplankton length–weight regression equations. Journal of Plankton Research 7:955–960. doi: 10.1093/plankt/7.6.955
- Birkeland C. 1974. Interactions between a sea pen and seven of its predators. Ecological Monographs 44:211–232. doi: 10.2307/1942312
- Bouligand Y. 1968. Sur une catégorie de cellules très particulières chez les gorgones (Coelentérés Octocoralliaires). Vie et Milieu A 19:59–69.
- Bourgault D, Koutitonsky VG. 1999. Real-time monitoring of the freshwater discharge at the head of the St. Lawrence Estuary. Atmosphere-Ocean 37:203–220. doi: 10.1080/07055900.1999.9649626
- Campana SE. 2001. Accuracy, precision and quality control in age determination, including a review of the use and abuse of age validation methods. Journal of Fish Biology 59:197–242. doi: 10.1111/j.1095-8649.2001.tb00127.x
- Campana SE, Casselman JM, Jones CM. 2008. Bomb radiocarbon chronologies in the Arctic, with implications for the age validation of lake trout (Salvelinus namaycush) and other Arctic species. Canadian Journal of Fisheries and Aquatic Sciences 65:733–743. doi: 10.1139/f08-012
- Campana SE, Jones CM. 1998. Radiocarbon from nuclear testing applied to age validation of black drum, Pogonias cromis. Fishery Bulletin 96:185–192.
- Campana SE, Stewart REA. 2014. Bomb dating, age validation and quality control of age determinations of monodontids and other marine mammals. North Atlantic Marine Mammal Commission Scientific Publications 10. 16 pages. doi:http://doi.org/10.7557/3.2987
- Chia FS, Crawford BJ. 1973. Some observations on gametogenesis, larval development and substratum selection of the sea pen Ptilosarcus guerneyi. Marine Biology 23:73–82. doi: 10.1007/BF00394113
- Christiansen HM, Campana ST, Fisk AT, Cliff G, Wintner SP, Dudley SFJ, et al. 2016. Using bomb radiocarbon to estimate age and growth of the white shark, Carcharodon carcharias, from the southwestern Indian Ocean. Marine Biology 163:e144. 13 pages. doi: 10.1007/s00227-016-2916-9
- Cordes EE, Nybakken JW, VanDykhuizen G. 2001. Reproduction and growth of Anthomastus ritteri (Octocorallia: Alcyonacea) from Monterey Bay, California, USA. Marine Biology 138:491–501. doi: 10.1007/s002270000470
- Davis N, VanBlaricom GR. 1978. Spatial and temporal heterogeneity in a sand bottom epifaunal community of invertebrates in shallow water. Limnology and Oceanography 23:417–427. doi: 10.4319/lo.1978.23.3.0417
- De Clippele LH, Buhl-Mortensen P, Buhl-Mortensen L. 2015. Fauna associated with cold water gorgonians and sea pens. Continental Shelf Research 105:67–78. doi: 10.1016/j.csr.2015.06.007
- de Moura Neves B, Edinger E, Layne GD, Wareham VE. 2015. Decadal longevity and slow growth rates in the deep-water sea pen Halipteris finmarchica (Sars, 1851) (Octocorallia: Pennatulacea): implications for vulnerability and recovery from anthropogenic disturbance. Hydrobiologia 759:147–170. doi: 10.1007/s10750-015-2229-x
- DFO. 2017. Delineation of significant areas of coldwater corals and sponge-dominated communities in Canada's Atlantic and eastern arctic marine waters and their overlap with fishing activity. DFO Canadian Science Advisory Secretariat Science Advisory Report 2017/007. 45 pages.
- Doyle J, Lordan C, Fitzgerald R, O’Connor S, Fee D, Nolan C, Hayes J. 2011. Celtic Sea Nephrops grounds 2011 UWTV survey report. Galway, Ireland: The Marine Institute, Fisheries Science Services. 28 pages.
- Druffel ERM. 1989. Decade time scale variability of ventilation in the North Atlantic: high-precision measurements of bomb radiocarbon in banded corals. Journal of Geophysical Research 94:3271–3285. doi: 10.1029/JC094iC03p03271
- Dufour R, Ouellet P. 2007. Estuary and Gulf of St. Lawrence marine ecosystem overview and assessment report. Canadian Technical Report of Fisheries and Aquatic Sciences 2744E. 112 pages.
- Dwyer KS, Treble MA, Campana SE. 2016. Age and growth of Greenland halibut (Reinhardtius hippoglossoides) in the Northwest Atlantic: a changing perception based on bomb radiocarbon analyses. Fisheries Research 179:342–350. doi: 10.1016/j.fishres.2016.01.016
- Eckelbarger KJ, Tyler PA, Langton RW. 1998. Gonadal morphology and gametogenesis in the sea pen Pennatula aculeata (Anthozoa: Pennatulacea) from the Gulf of Maine. Marine Biology 132:677–690. doi: 10.1007/s002270050432
- Edwards DCB, Moore CG. 2008. Reproduction in the sea pen Pennatula phosphorea (Anthozoa: Pennatulacea) from the west coast of Scotland. Marine Biology 155:303–314. doi: 10.1007/s00227-008-1028-6
- Edwards DCB, Moore CG. 2009. Reproduction in the sea pen Funiculina quadrangularis (Anthozoa: Pennatulacea) from the west coast of Scotland. Estuarine, Coastal and Shelf Science 82:161–168. doi: 10.1016/j.ecss.2009.01.006
- FAO. 2009. Report of the technical consultation on international guidelines for the management of deep-sea fisheries in the high seas. Rome, 4–8 February and 25–29 August 2008. FAO Fisheries and Aquaculture Report No. 881. 87 pages.
- Franc S, Huc A, Chassagne G. 1974. Etude ultrastructurale et physico-chimique de l’axe squelettique de Veretillum cynomorium Pall. (Cnidaire, Anthozoaire): cellules, calcite, collagène. Journal de Microscopie 21:93–110.
- Fujita T, Ohta S. 1988. Photographic observations of the life style of a deep-sea ophiuroid Asteronyx loveni (Echinodermata). Deep Sea Research A 35:2029–2043. doi: 10.1016/0198-0149(88)90123-9
- García-Matucheski S, Muniain C. 2011. Predation by the nudibranch Tritonia odhneri (Opisthobranchia: Tritoniidae) on octocorals from the South Atlantic Ocean. Marine Biodiversity 41:287–297. doi: 10.1007/s12526-010-0063-y
- Gonzalez-Mirelis G, Lindegarth M. 2012. Predicting the distribution of out-of-reach biotopes with decision trees in a Swedish marine protected area. Ecological Applications 22:2248–2264. doi: 10.1890/11-1608.1
- Greathead CF, Donnan DW, Mair JM. 2005. Impact of Nephrops sp. trawling on the distribution of the sea pen Virgularia mirabilis, Pennatula phosphorea and Funiculina quadrangularis in Scottish waters. Fisheries Research Services Internal Report No. 02/05. Aberdeen, UK. 18 pages.
- Guijarro J, Beazley L, Lirette C, Wang Z, Kenchington E. 2016. Characteristics of environmental data layers for use in species distribution modelling in the Newfoundland and Labrador region. Canadian Technical Report of Fisheries and Aquatic Sciences 3187. 325 pages.
- Heifetz J, Stone RP, Shotwell SK. 2009. Damage and disturbance to coral and sponge habitat of the Aleutian Archipelago. Marine Ecology Progress Series 397:295–303. doi: 10.3354/meps08304
- Humes AG. 1978. Lichomolgid copepods (Cyclopoida), with two new species of Doridicola, from sea pens (Pennatulacea) in Madagascar. Transactions of the American Microscopical Society 97:524–539. doi: 10.2307/3226168
- Kahm M, Hasenbrink G, Lichtenberg-Fraté H, Ludwig J, Kschischo M. 2010. grofit: fitting biological growth curves with R. Journal of Statistical Software 33:1–21. doi: 10.18637/jss.v033.i07
- Kenchington E. 2014. A general overview of benthic ecological or biological significant areas (EBSAs) in the maritimes region. Canadian Technical Report of Fisheries and Aquatic Sciences 3072. 45 pages.
- Kenchington E, Beazley L, Lirette C, Murillo FJ, Guijarro J, Wareham V, et al. 2016a. Delineation of coral and sponge significant benthic areas in Eastern Canada using Kernel Density Analyses and Species Distribution Models. DFO Canadian Science Advisory Secretariat Science Advisory Report 2016/093. 178 pages.
- Kenchington E, Lirette C, Murillo FJ, Beazley L, Guijarro J, Wareham V, et al. 2016b. Kernel density analyses of coral and sponge catches from research vessel survey data for use in identification of significant benthic areas. Canadian Technical Report of Fisheries and Aquatic Sciences 3167. 207 pages.
- Kenchington E, Murillo FJ, Cogswell A, Lirette C. 2011. Development of encounter protocols and assessment of significant adverse impact by bottom trawling for sponge grounds and sea pen fields in the NAFO Regulatory Area. NAFO Scientifc Council Report 11/75 Serial No N6005. 51 pages.
- Kenchington E, Murillo FJ, Lirette C, Sacau M, Koen-Alonso M, Kenny A, et al. 2014. Kernel density surface modelling as a means to identify significant concentrations of vulnerable marine ecosystem indicators. PLoS One 9:e109365. 14 pages. doi: 10.1371/journal.pone.0109365
- Kilada R, Sainte-Marie B, Rochette R, Davis N, Vanier C, Campana S. 2012. Direct determination of age in shrimps, crabs, and lobsters. Canadian Journal of Fisheries and Aquatic Sciences 69:1728–1733. doi: 10.1139/cjfas-2012-0254
- Kimmerer W, Avent SR, Bollens SM, Feyrer F, Grimaldo LF, Moyle PB, et al. 2005. Variability in length–weight relationships used to estimate biomass of estuarine fish from survey data. Transactions of the American Fisheries Society 134:481–495. doi: 10.1577/T04-042.1
- Kulka DW, Atkinson DB. 2016. Redfish catch results from the summer 2009, 2011 and 2014 surveys in Unit 2. DFO Canadian Science Advisory Secretariat Science Advisory Report 2016/016. 32 pages.
- Lauzier LM, Trites RW. 1958. The deep waters in the Laurentian Channel. Journal of the Fisheries Research Board of Canada 15:1247–1257. doi: 10.1139/f58-068
- Ledger PW, Franc S. 1978. Calcification of the collagenous axial skeleton of Veretillum cynomorium Pall. (Cnidaria: Pennatulacea). Cell and Tissue Research 192:249–266. doi: 10.1007/BF00220743
- Lewis JC, Barnowski TF, Telesnicki GJ. 1992. Characteristics of carbonates of gorgonian axes (Coelenterata, Octocorallia). The Biological Bulletin 183:278–296. doi: 10.2307/1542215
- Malecha PW, Stone RP. 2009. Response of the sea whip Halipteris willemoesi to simulated trawl disturbance and its vulnerability to subsequent predation. Marine Ecology Progress Series 388:197–206. doi: 10.3354/meps08145
- Malecha PW, Stone RP, Heifetz J. 2005. Living substrate in Alaska: distribution, abundance and species associations. In: Barnes PW, Tomas JP, editors. Benthic Habitats and the Effects of Fishing. American Fisheries Society Symposium 41. Bethesda, MD: American Fisheries Society, p 289–299.
- McFadden CS. 1991. A comparative demographic analysis of clonal reproduction in a temperate soft coral. Ecology 72:1849–1866. doi: 10.2307/1940983
- McFadden CS, France SC, Sánchez, JA, Alderslade P. 2006. A molecular phylogenetic analysis of Octocorallia (Cnidaria: Anthozoa) based on mitochondrial protein-coding sequences. Molecular Phylogenetics and Evolution 41:513–527. doi: 10.1016/j.ympev.2006.06.010
- Murillo FJ, Durán Muñoz P, Altuna A, Serrano A. 2011. Distribution of deep-water corals of the Flemish Cap, Flemish Pass, and the Grand Banks of Newfoundland (Northwest Atlantic Ocean): interaction with fishing activities. ICES Journal of Marine Science 68:319–332. doi: 10.1093/icesjms/fsq071
- Murillo FJ, Kenchington E, Beazley L, Lirette C, Knudby A, Guijarro J, et al. 2016a. Distribution modelling of sea pens, sponges, stalked tunicates and soft corals from research vessel survey data in the Gulf of St. Lawrence for use in the identification of significant benthic areas. Canadian Technical Report of Fisheries and Aquatic Sciences 3170. 132 pages.
- Murillo FJ, Serrano A, Kenchington E, Mora J. 2016b. Epibenthic assemblages of the Tail of the Grand Bank and Flemish Cap (northwest Atlantic) in relation to environmental parameters and trawling intensity. Deep Sea Research I 109:99–122. doi: 10.1016/j.dsr.2015.08.006
- NAFO. 2016. Report of the 9th meeting of the NAFO Scientific Council Working Group on Ecosystem Science and Assessment (WG-ESA). 8-17 November 2016, Lisbon, Portugal. NAFO Scientific Council Summary Document 16/21, Serial No N6655. 105 pages.
- NAFO. 2017. Conservation and enforcement measures. NAFO/Fisheries Commission Document 17/01, Serial No N6638. 188 pages.
- Narvaez CA, Johnson LE, Sainte-Marie B. 2016. Growth bands are an unreliable indicator of sea urchin age: evidence from the laboratory and the literature. Limnology and Oceanography: Methods 14:527–541. doi: 10.1002/lom3.10110
- Nielsen J, Hedeholm RB, Heinemeier J, Bushnell PG, Christiansen JS, Olsen J, et al. 2016. Eye lens radiocarbon reveals centuries of longevity in the Greenland shark (Somniosus microcephalus). Science 353:702–704. doi: 10.1126/science.aaf1703
- Nygren A, Pleijel F. 2010. Redescription of Imajimaea draculai—a rare syllid polychaete associated with the sea pen Funiculina quadrangularis. Journal of the Marine Biological Association of the United Kingdom 90:1441–1448. doi: 10.1017/S0025315409991536
- OSPAR Commision. 2008. OSPAR list of threatened and/or declining species and habitats. Reference Number: 2008–6. https://www.ospar.org/work-areas/bdc/species-habitats/list-of-threatened-declining-species-habitats (accessed 4 July 2017).
- Peharda M, Richardson CA, Mladineo I, Šestanovic S, Popović Z, Bolotin J, Vrgoč N. 2007. Age, growth and population structure of Modiolus barbatus from the Adriatic. Marine Biology 151:629–638. doi: 10.1007/s00227-006-0501-3
- Pires DO, Castro CB, Silva JC. 2009. Reproductive biology of the deep-sea pennatulacean Anthoptilum murrayi (Cnidaria, Octocorallia). Marine Ecology Progress Series 397:103–112. doi: 10.3354/meps08322
- R Development Core Team. 2015. R: A language and environment for statistical computing. Vienna: R Foundation for Statistical Computing. https://www.R-project.org/ (accessed 4 July 2017).
- Richaud B, Kwon Y-O, Joyce TM, Fratantoni PS, Lentz SJ. 2016. Surface and bottom temperature and salinity climatology along the continental shelf off the Canadian and U.S. east coasts. Continental Shelf Research 124:165–181. doi: 10.1016/j.csr.2016.06.005
- Risk MJ, Heikoop JM, Snow MG, Beukens R. 2002. Lifespans and growth patterns of two deep-sea corals: Primnoa resedaeformis and Desmophyllum cristagalli. Hydrobiologia 471:125–131. doi: 10.1023/A:1016557405185
- Rooper CN, Wilborn R, Goddard P, Williams K, Towler R, Hoff GR. 2017. Validation of deep-sea coral and sponge distribution models in the Aleutian Islands, Alaska. ICES Journal of Marine Science 75(1):199–209. doi: 10.1093/icesjms/fsx087
- Savoie L, Morin R, Surette T, Benoît HP, LeBlanc C. 2012. Preliminary results from the September 2010 and 2011 bottom-trawl survey of the southern Gulf of St. Lawrence. DFO Canadian Science Advisory Secretariat Science Advisory Report 2012/067. 68 pages.
- Sebens KP. 1979. The energetics of asexual reproduction and colony formation in benthic marine invertebrates. American Zoologist 19:683–699. doi: 10.1093/icb/19.3.683
- Sebens KP. 1984. Water flow and coral colony size: interhabitat comparisons of the octocoral Alcyonium siderium. Proceedings of the National Academy of Sciences 81:5473–5477. doi: 10.1073/pnas.81.17.5473
- Sebens KP. 1987. The ecology of indeterminate growth in animals. Annual Review of Ecology and Systematics 18:371–407. doi: 10.1146/annurev.es.18.110187.002103
- Sherwood OA. 2002. The deep-sea gorgonian coral Primnoa resedaeformis as an oceanographic monitor. MSc Thesis. Hamilton, ON: McMaster University, Geology Department. 65 pages.
- Sherwood OA, Edinger EN. 2009. Ages and growth rates of some deep-sea gorgonian and antipatharian corals of Newfoundland and Labrador. Canadian Journal of Fisheries and Aquatic Sciences 66:142–152. doi: 10.1139/F08-195
- Sherwood OA, Jamieson RE, Edinger EN, Wareham VE. 2008. Stable C and N isotopic composition of cold-water corals from the Newfoundland and Labrador continental slope: examination of trophic, depth and spatial effects. Deep Sea Research I 55:1392–1402. doi: 10.1016/j.dsr.2008.05.013
- Sherwood OA, Scott DB, Risk MJ, Guilderson TP. 2005. Radiocarbon evidence for annual growth rings in the deep-sea octocoral Primnoa resedaeformis. Marine Ecology Progress Series 301:129–134. doi: 10.3354/meps301129
- Soong K. 2005. Reproduction and colony integration of the sea pen Virgularia juncea. Marine Biology 146:1103–1109. doi: 10.1007/s00227-004-1509-1
- Stuiver M, Polach HA. 1977. Discussion reporting of 14C data. Radiocarbon 19:355–363. doi: 10.1017/S0033822200003672
- Tillet E, Franc JM, Franc S, Garrone R. 1996. The evolution of fibrillar collagens: A sea-pen collagen shares common features with vertebrate type V collagen. Comparative Biochemistry and Physiology B 113:239–246. doi: 10.1016/0305-0491(95)02014-4
- Tissot BN, Yoklavich MM, Love MS, York K, Amend M. 2006. Benthic invertebrates that form habitat structures on deep banks off southern California, with special reference to deep sea corals. Fishery Bulletin 104:167–181.
- Troffe PM, Levings CD, Piercey GBE, Keong V. 2005. Fishing gear effects and ecology of the sea whip (Halipteris willemoesi (Cnidaria: Octocorallia: Pennatulacea)) in British Columbia, Canada: preliminary observations. Aquatic Conservation: Marine and Freshwater Ecosystems 15:523–533. doi: 10.1002/aqc.685
- Tyler PA, Bronsdon SK, Young CM, Rice AL. 1995. Ecology and gametogenic biology of the genus Umbellula (Pennatulacea) in the North Atlantic Ocean. Internationale Revue der Gesamten Hydrobiologie und Hydrographie 80:187–199. doi: 10.1002/iroh.19950800207
- UNGA. 2006. Resolution adopted by the General Assembly 61/105. Sustainable fisheries, including through the 1995 agreement for the implementation of the provisions of the United Nations Convention on the Law of the Sea of 10 December 1982 relating to the conservation and management of straddling fish stocks and highly migratory fish stocks, and related instruments. Ref.: A/Res/61/105. http://www.un.org/Docs/journal/asp/ws.asp?m = A/RES/61/105 (accessed on 4 July 2017).
- Velimirov B. 1975. Wachstum und Altersbestimmung der Gorgonie Eunicella cavolinii. Oecologia 19:259–272. doi: 10.1007/BF00345309
- Williams GC. 2011. The global diversity of sea pens (Cnidaria: Octocorallia: Pennatulacea). PLoS One 6(7):e22747. 11 pages. doi: 10.1371/journal.pone.0022747
- Williams GC, Alderslade P. 2011. Three new species of pennatulacean octocorals with the ability to attach to rocky substrata (Cnidaria: Anthozoa: Pennatulacea). Zootaxa 3001:33–48.
- Wilson MT, Andrews AH, Brown AL, Cordes EE. 2002. Axial rod growth and age estimation of the sea pen, Halipteris willemoesi Kölliker. Hydrobiologia 471:133–142. doi: 10.1023/A:1016509506094
- Winters GH, Wheeler JP. 1994. Length-specific weight as a measure of growth success of adult Atlantic herring (Clupea harengus). Canadian Journal of Fisheries and Aquatic Sciences 51:1169–1179. doi: 10.1139/f94-116