
 ?Mathematical formulae have been encoded as MathML and are displayed in this HTML version using MathJax in order to improve their display. Uncheck the box to turn MathJax off. This feature requires Javascript. Click on a formula to zoom.
ABSTRACT
To explore ecosystem dynamics and functions it is vital to obtain knowledge on predator–prey relations. Harbour seals are piscivorous predators that can come into conflict with fisheries. Recently, as the Skagerrak and Kattegat population of harbour seals has increased, claims have emerged that seals are depleting coastal cod populations. The diet of harbour seals in Norwegian Skagerrak was investigated based on otolith identification from scats. The overall seal diet included 20 different fish species/groups. The most important prey (combined index Qi) were haddock/pollack/saithe (32.7%), genus Trisopterus (Norway pout/poor cod/bib, 12.5%), plaice (12.4%) and herring (10.0%). Plaice also had the largest biomass (24.1%). Gadoids and pleuronectids comprised 88.6% of the diet (combined index Qi) and 87.1% in terms of biomass. Cod constituted 0.7% (combined index Qi) of the overall diet and 2.3% in terms of biomass. Fish length estimates showed that seals generally prefer small fish below minimum allowed landing size. Estimated total amount of fish consumed was 315 tons per year and was dominated by non-commercial species. Annual cod consumption was an estimated 7.1 tons, representing 5% of annual cod landings, suggesting that competition between local fisheries and harbour seals is limited.
Introduction
An important part of understanding ecosystem dynamics and functions lies in knowledge of relationships between predators and prey (e.g. Pierce and Boyle Citation1991; Staniland Citation2002; Graham et al. Citation2011; Riemer et al. Citation2011; Ford et al. Citation2016). These relationships can be better understood by mapping the diet composition of predators, which is necessary for sustainable management of ecosystems (Ford et al. Citation2016).
Because diets are not always readily discernible for species in the wild, one can use several available methods to obtain information on the subject. The most common method used to identify the prey of pinnipeds consists of the identification of otoliths and other prey remains (e.g. cephalopod beaks, fish bones, crustacean exoskeletons) in faeces or digestive tracts. Genetic analyses of faeces, stomach and intestinal contents are also used. Such analyses are especially useful for identifying prey remains when otoliths are not available or greatly eroded (e.g. salmonids) (Jobling and Breiby Citation1986; Kvitrud et al. Citation2005; Parsons et al. Citation2005; Matejusová et al. Citation2008). Genetic analyses can also be used to distinguish between closely related species that are impossible to separate based on eroded otoliths alone (Matejusová et al. Citation2008). Other available methods for inferring the diet of marine species include fatty acid analysis of predator adipose tissues (e.g. Iverson et al. Citation2004) and stable isotope analysis of predator tissues (e.g. Tverin et al. Citation2019).
Harbour seals (Phoca vitulina, Linnaeus, 1758) are mainly piscivorous predators (e.g. Bromaghin et al. Citation2012; Ydesen et al. Citation2014). They inhabit coastal areas around the northern Pacific and Atlantic oceans (Teilmann and Galatius Citation2018). Between foraging trips harbour seals return to specific haul-out sites to socialize and rest with conspecifics, a behaviour called central place foraging (Geiger et al. Citation2013; Luxa and Acevedo-Gutiérrez Citation2013). Generally, seals spend most of their time hauled out during daytime and low tide, while most foraging trips take place at night (Thompson et al. Citation1989; Thompson and Miller Citation1990; Bjørge et al. Citation1995; Ramasco et al. Citation2014). Except for females with pups who seemingly prefer secluded haul-out sites for pupping, choice of haul-out site seems to be related to proximity to feeding grounds (Thompson et al. Citation1996).
Several studies of harbour seal diet show that they are generalists with a diverse diet, preying on e.g. clupeoids, gadoids, sandeels (Ammodytidae), sculpins and flatfish (e.g. Pierce et al. Citation1991; Tollit and Thompson Citation1996; Bromaghin et al. Citation2012; Lance et al. Citation2012; Geiger et al. Citation2013; Luxa and Acevedo-Gutiérrez Citation2013). They vary their diets according to season and geographical location, seemingly to prefer the regionally and seasonally most abundant of both benthic and pelagic species (e.g. Bromaghin et al. Citation2012; Lance et al. Citation2012; Geiger et al. Citation2013; Luxa and Acevedo-Gutiérrez Citation2013; Schwarz et al. Citation2018). In some areas, seals seem to favour a small number of prey species but also supplement their diet with other species (Lance et al. Citation2012). Changes in foraging grounds between seasons have been observed, apparently due to winter prey changing its geographical distribution (Pierce et al. Citation1991; Thompson et al. Citation1991, Citation1996).
Trends in harbour seal diet observed in other parts of the world have also been seen in Norway, where they have a varied diet of smaller individuals of both schooling fish and benthic species (Olsen and Bjørge Citation1995), such as gadoids, clupeoids, flatfishes, sandeels and sculpins (Olsen and Bjørge Citation1995; Berg et al. Citation2002; Bjørge et al. Citation2002a; Andersen et al. Citation2004; Ramasco et al. Citation2017). Regional and temporal variations in diet have been observed, e.g. seals feeding on herring (Clupea harengus, Linnaeus, 1758) when the species becomes seasonally available (Olsen and Bjørge Citation1995; Berg et al. Citation2002; Ramasco et al. Citation2017).
Harbour seals also prey on commercially important fish species (e.g. Frost and Lowry Citation1986; Graham et al. Citation2011; Bromaghin et al. Citation2012; Spitz et al. Citation2015), potentially creating conflicts between seals and humans. These interactions can be divided into direct and indirect interactions. Operational interactions are direct interactions that involve seals e.g. wrecking fishing gear, feeding on entangled fish or becoming entangled in gillnets (e.g. Bjørge et al. Citation2002b). Indirect interactions may involve seals and humans competing for the same species (Wickens et al. Citation1992; Bjørge et al. Citation2002a).
The population of harbour seals in Skagerrak and Kattegat has increased in recent years (Reijnders et al. Citation2010). The estimated population size in the Norwegian Skagerrak (Østfold, Vestfold, Telemark, Aust-Agder and Vest-Agder counties) shows an increase from 350 animals in 1996–1999 to 880 in 2016–2018 (Nilssen and Bjørge Citation2018). The present study investigated the diet of harbour seals along the Norwegian Skagerrak coast, based on the identification of fish otoliths from seal scats collected in Telemark and Aust-Agder. Annual prey consumption was also estimated in order to elaborate on the role of seals in possible conflicts with fisheries.
Materials and methods
A total of 121 harbour seal scat samples were collected between June 2015 and August 2016 from six haul-out sites (; ) on the Norwegian Skagerrak coast (Telemark and Aust-Agder counties). The sampling sites were small islands and rocks available to the seals mostly during low tide. Some sites were in sheltered areas (Ødegårdskilen, Gjesskjæra, Risør and Askerøy), while others were more exposed to waves (Knallaren and Ryvingen). Samples were collected in plastic bags and stored at −18°C until further processing.
Figure 1. Harbour seal scat sampling locations in red. Kragerø is located in the county of Telemark, while Risør, Tvedestrand and Grimstad are located in Aust-Agder.
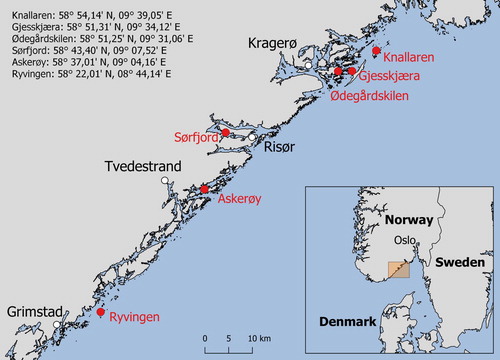
Table I. Number of samples and number of otoliths per site. The location ‘Kragerø’ consists of Knallaren, Ødegårdskilen and Gjesskjæra.
Thawed samples were rinsed with water through nested mesh sieves of 2.0, 1.0 and 0.5 mm. Residue from each sieve was put in a water basin and otoliths were collected and stored in 80% ethanol until they were dried, measured (length and width) with a ruler and sorted by length and side (left/right). Otoliths were then identified to the lowest possible taxon based on Härkönen (Citation1986). This involved pooling data into groups of species that could not be reliably distinguished: ‘haddock (Melanogrammus aeglefinus, Linnaeus, 1758)/pollack (Pollachius pollachius, Linnaeus, 1758)/saithe (Pollachius virens, Linnaeus, 1758)’, ‘genus Trisopterus’ containing Norway pout (Trisopterus esmarkii, Nilsson, 1855), poor cod (Trisopterus minutus, Linnaeus, 1758) and bib (Trisopterus luscus, Linnaeus, 1758) and the third group ‘long rough dab (Hippoglossoides platessoides, Fabricius, 1780)/witch (Glyptocephalus cynoglossus, Linnaeus, 1758)’. Data from families with few species and individuals (Cottidae, Labridae, Gobiidae and Bothidae) were also pooled together at family level and grouped in ‘other prey’. The groups ‘unidentified Gadidae’ and ‘unidentified Pleuronectidae’ refer to Gadidae and Pleuronectidae otoliths which were too degraded or otherwise not possible to reliably identify to species.
Minimum number of individuals (MNI) (Orr et al. Citation2003) was counted from the side (left/right) with the greatest number of otoliths from each species/group. Results are presented using four feeding indices, (i) frequency of occurrence (FO
i), (ii) relative frequency (NUM
i) (Hyslop Citation1980), (iii) percentage biomass (PB
i) and (iv) a combined index (Q
i) (Haug et al. Citation2007):where si is the number of samples containing species i and st is the total number of samples;
where n
i is the total number of prey category i in all samples and nt is the total number of individuals in all prey categories;
where mi is the total mass (kg) of prey category i calculated using regressions (Härkönen Citation1986) and mt is the total mass (kg) of individuals in all prey categories.
where FOi is frequency of occurrence, PBi is percentage biomass, and p is the number of prey groups. The combined index (Qi) balances out the importance of smaller prey occurring frequently in the diet vs. larger prey occurring less frequently (Nilssen et al. Citation2019).
Samples from Kragerø and Risør were collected in August 2016 and classified as ‘Kragerø summer’ and ‘Risør summer’. ‘Grimstad spring’ contains data collected in March 2016. Extended data collection in Tvedestrand made it sensible to pool results according to seasons. ‘Tvedestrand winter-spring’ contains data from February to May 2016, while ‘Tvedestrand summer-autumn’ contains data collected in June 2015, September 2015 and August 2016.
Fish length and weight were calculated using regressions between otolith length or width based on Härkönen (Citation1986). No corrections for otolith degradation were made. For the groups haddock/pollack/saithe, genus Trisopterus, and long rough dab/witch, we used regressions for the most likely species for each otolith, before combining the results in the respective groups. For Gadidae, flatfish (Pleuronectidae and Bothidae), Cottidae, Labridae and Gobiidae otoliths with uncertain identification, the regression for the assumed species was used. If species was unidentified, the regression for the most abundant species in the respective location was used.
Annual consumption of fish by harbour seals was calculated using data on daily fish consumption in harbour seals (Bjørge et al. Citation2002a) and numbers from the latest seal counts in Telemark and Aust-Agder (Nilssen and Bjørge Citation2018), combined with the diet distribution found in the present study. Bjørge et al. (Citation2002a) calculated mean daily per capita consumption to be 1.6, 3.4, 3.8, 5.7 and 5.5 kg of fish for pups, juvenile females, juvenile males, adult females and adult males, respectively. Because data on seal age and sex were not available in the present study, an average value of 4 kg as a mean daily per capita consumption for a generic harbour seal was used.
Harbour seal abundance in Aust-Agder and Telemark has been estimated to be 41 and 175 individuals, respectively (Nilssen and Bjørge Citation2018). When assuming that the available diet samples were representative for the diet throughout the year, total annual prey consumption for each county (Telemark and Aust-Agder) was calculated by multiplying 4 kg with 365 days per year and the seal numbers estimated in each county. Percentage biomass (PB i) was used to distribute annual prey consumption to various fish species and groups.
Estimated annual prey consumption was later compared with total fisheries landings in the same region using available landings statistics from the Norwegian Directorate of Fisheries (FD Citation2018).
Results
Diet composition
Of the 121 scat samples collected, 27 (22%) contained no otoliths. A total of 757 otoliths from the six sampling locations were identified to the lowest possible taxonomic level (). A total of 11 fish species and nine pooled groups were identified to either family or species in the same family with similar otoliths but impossible to identify to species due to degradation. Prey items occurring most frequently (FO i) in the samples were genus Trisopterus, i.e. Norway pout/poor cod/bib (33.9%), haddock/pollack/saithe (29.8%) and whiting (Merlangius merlangus, Linnaeus, 1758) (25.6%) ().
Table II. Frequency of occurrence (FOi), relative frequency (NUMi), percentage biomass (PBi) and combined index (Qi) for all species and pooled groups. The group ‘other prey’ include the following: Labridae: goldsinny wrasse (Ctenolabrus rupestris, Linnaeus, 1758), cuckoo wrasse (Labrus mixtus, Linnaeus, 1758), ballan wrasse (Labrus bergylta, Ascanius, 1767) and unidentified species from the Labridae family; Gobiidae: black goby (Gobius niger, Linnaeus, 1758), painted goby (Pomatoschistus pictus, Malm, 1865), common goby (Pomatoschistus microps, Krøyer, 1838), Fries’s goby (Lesuerigobius friesii, Malm, 1874) and unidentified species from the Gobiidae family; and Bothidae: Norwegian topknot (Phrynorhombus norvegicus, Günther, 1862) and unidentified species from the Bothidae family.
The most common species and groups in terms of relative frequency (NUM i) were genus Trisopterus (27.3%), long rough dab/witch (13.7%) and whiting (12.7%). Gadoids and flatfishes (families Pleuronectidae) comprised 59.3% and 27.9% of the diet, respectively. Cod (Gadus morhua, Linnaeus, 1758) was only present in 5.8% of the samples (FO i) and represented less than 1% of the diet (NUM i) ().
In terms of reconstructed biomass (PB i), plaice (Pleuronectes platessa, Linnaeus, 1758) was the most represented species, accounting for 24.1% of the diet, followed by haddock/pollack/saithe (19.3%), and herring (11.1%) (). Pleuronectidae and Gadidae (both identified and unidentified) accounted for the majority of the biomass consumed, 49.7% and 37.4%, respectively. Cod constituted 2.3% of the total biomass consumed.
Overall, the most important prey in the harbour seal diet, according to the combined index (Q i) were haddock/pollack/saithe (32.7%), genus Trisopterus (12.5%) and plaice (12.4%) (). Comparing biomass (PB i) to combined index (Q i) showed that the importance of herring, cod, blue whiting (Micromesistius poutassou, Risso, 1827), four-bearded rockling (Enchelyopus cimbrius, Linnaeus, 1766), hake (Merluccius merluccius, Linnaeus, 1758), mackerel (Scomber scombrus, Linnaeus, 1758), plaice, flounder (Platichthys flesus, Linnaeus, 1758), dab (Limanda limanda, Linnaeus, 1758) and lemon sole (Microstomus kitt, Walbaum, 1792) as prey decreased when using combined index (Q i), while the importance of haddock/pollack/saithe, whiting, genus Trisopterus and long rough dab/witch increased ().
Regional and seasonal patterns in diet
Samples were obtained at three locations during summer (Kragerø, Risør and Tvedestrand) and two locations in spring (Tvedestrand and Grimstad). In samples collected during summer in Kragerø, gadoids were the most important prey group (NUM i), comprising 57.6% of the diet, followed by flatfishes (Pleuronectidae) (38.1%). According to combined index (Q i) the most important prey in Kragerø was plaice (55.3%), followed by haddock/pollack/saithe (24.2%) and dab (7.0%) (). In terms of biomass, pleuronectids were the most consumed (69.2%), followed by gadoids (29.3%). Plaice was the most biomass consumed species (52.0%), followed by haddock/pollack/saithe (19.0%), dab (9.5%) and long rough dab/witch (5.3%).
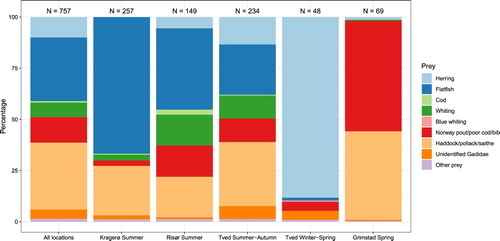
Figure 2. Combined index (Qi) for all species and species groups in harbour seal scat samples in all locations, Kragerø (summer), Risør (summer), Tvedestrand (summer-autumn and winter-spring) and Grimstad (spring). ‘Norway pout/poor cod/bib’ refer to genus Trisopterus. ‘Other prey’ includes four-bearded rockling, hake, mackerel, Cottidae, Labridae, Gobiidae and Bothidae. ‘Flatfish’ includes plaice, flounder, dab, lemon sole, long rough dab/witch and unidentified Pleuronectidae.
In Risør also, gadoids (NUMi = 52.3%) and pleuronectids (40.9%) dominated in the diet. Long rough dab/witch (30.2%) was the most common prey group, followed by whiting (18.8%) and genus Trisopterus (16.8%). In terms of biomass, gadoids and pleuronectids accounted for 48.2% and 38.5% of the diet accounted for 48.2% and 38.5% of the diet respectively. Long rough dab/witch (21.1%), haddock/pollack/saithe (16.6%), whiting (12.6%) and lemon sole (11.2%) were the species/species groups with the largest biomass consumed. The most important prey according to combined index (Q i) were long rough dab/witch (28.8%), haddock/pollack/saithe (19.8%) and genus Trisopterus (15.3%) ().
In Tvedestrand, species richness was high during summer and autumn (19 species/groups), compared with spring (10 species/groups). As in Kragerø and Risør, in terms of relative numerical frequency (NUM i) gadoids made up the main portion of the diet (61.1%), followed by flatfishes (20.9%). The most common species/species groups were genus Trisopterus (26.1%), whiting (16.7%) and haddock/pollack/saithe (11.5%). Cod, whiting, four-bearded rockling, hake, mackerel, plaice, dab and lemon sole were present in the diet during summer-autumn, but absent in other seasons. In terms of biomass, gadoids and pleuronectids accounted for 42.9% and 41.5% of the diet of the diet respectively. Haddock/pollack/saithe (21.1%) had the largest biomass, followed by lemon sole (16.7%), unidentified pleuronectids (14.7%) and herring (13.5%). According to combined index (Q i) haddock/pollack/saithe was the most important prey (31.3%), followed by lemon sole (14.4%) and herring (13.4%) ().
In winter-spring, the seal diet changed at Tvedestrand. Only 10 species/species groups were present, where gadoids (haddock/pollack/saithe, blue whiting, genus Trisopterus and unidentified gadoids) in terms of relative numerical frequency (NUM i) contributed 50%, pleuronectids 6.3% and all other species/groups 43.8%. The most common species in the diet was herring (35.4%), followed by genus Trisopterus (27.1%) and unidentified gadoids (18.8%). Whiting contributed significantly (16.7%) to the diet in summer-autumn but was absent in winter-spring. In terms of biomass, gadoids and pleuronectids accounted for 18.6% and 4.8% of the diet respectively. Herring had the largest biomass consumed (75.5%), followed by genus Trisopterus (7.6%) and unidentified gadoids (7.5%). The most important prey according to combined index (Q i) was herring (88.2%), genus Trisopterus (4.5%) and unidentified gadoids (4.4%) ().
Samples from Grimstad were collected during spring. Only seven species/species groups were found: herring, cod, haddock/pollack/saithe, whiting, genus Trisopterus, unidentified gadoids and labrids. The latter is incorporated in ‘other prey’ for biomass estimates. Gadoids made up 97.1% (NUM i) of the diet. Genus Trisopterus was the most common species group (82.6%), while haddock/pollack/saithe and unidentified gadoids made up 5.8% each. In terms of biomass, gadoids and herring comprising 92.7%, and 5.5% of the diet respectively. Haddock/pollack/saithe had the highest biomass consumed (44.9%), followed by genus Trisopterus (44.8%) and herring (5.5%). According to combined index (Q i) the most important prey was genus Trisopterus (54.0%), haddock/pollack/saithe (43.3%) and herring (1.3%) ().
Fish length and weight
Fish lengths and weights were calculated for all species in the seal diet. Overall fish length ranged from 12 mm (bib) to 548 mm (pollack) (). Average lengths varied from 95 mm (Norway pout) (115 mm for genus Trisopterus as a whole) to 315 mm (flounder) ().
Figure 3. Length (mm) and weight (g) distribution (median, 25% and 75% quartiles) for fish species found in the harbour seal diet. Red lines indicate minimum allowed landing size (Lovdata Citation2005). Grey numbers indicate outliers. Black numbers on right side indicate number of otoliths. (Color online)
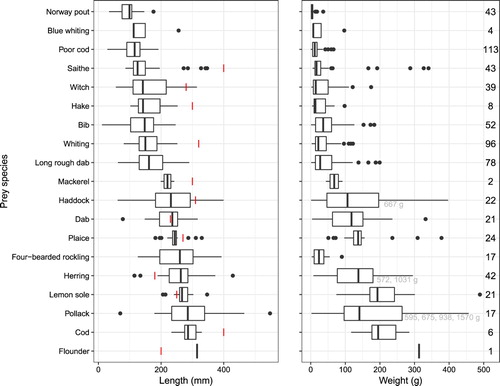
Average fish lengths were smaller than minimum allowed landing size (MS) for cod, haddock, saithe, whiting, hake, mackerel, plaice and dab, and higher than MS for herring, flounder and lemon sole based on fisheries regulations in Norwegian waters (Lovdata Citation2005). All cod, whiting, hake and mackerel found in the samples were below MS, while flounder was above MS. MS was within total length range for herring (93% of individuals larger than MS), haddock (22%), saithe (7%), plaice (17%), dab (52%) and lemon sole (81%) ().
Overall fish weights in the seal diet () varied from 0.3 g (Norway pout) to 1569.6 g (pollack). Average weights ranged from 6 g (Norway pout) (20 g for genus Trisopterus as a whole) to 322 g (pollack) (145 g for haddock/pollack/saithe as a whole). Gadoid weights varied from 0.3 to 1570 g, pleuronectid weights from 1.5 to 489 g ().
Annual prey consumption
The estimated total annual consumption (all numbers rounded) was 315 tons of fish for all the harbour seals in Telemark and Aust-Agder (). The most consumed species/groups were plaice (76 tons total for both counties), haddock/pollack/saithe (61 tons), herring (35 tons), long rough dab/witch (23 tons) and lemon sole (22 tons) (). Estimated total annual consumption of cod in Telemark and Aust-Agder was 7 tons, which amounts to ∼5% of the annual cod landings by commercial fisheries in the region ().
Table III. Annual fish consumption by harbour seals in Telemark and Aust-Agder. Annual commercial fisheries landings of cod, haddock, saithe and mackerel (FD Citation2018), and annual consumption of these species by harbour seals as percentages of commercial fisheries landings (in parentheses) are also given. All amounts in tons. Biomass for Cottidae, Labridae, Gobiidae and Bothidae is summarized in ‘other prey’. *Pollack not included, as it is not a target species for local fisheries.
Discussion
Methods used
Estimation of diet composition in seals using otoliths and other hard remains in faecal samples is not an unbiased method. Not all prey species are easily detected in scat samples, and scat samples only reflect the diet during a small window of time, specifically the time between two bowel movements (Bromaghin et al. Citation2012). Seals foraging far from land might defecate before returning to their haul-out site (Staniland Citation2002). Seals may sometimes only consume soft parts of fish (‘belly biting’), i.e. not the head with otoliths, leaving no discernible traces in the scat (Orr et al. Citation2004). However, in harbour seals, which have been found to prey mainly on small specimens (Ramasco Citation2008; Lance et al. Citation2012; Spitz et al. Citation2015; Ramasco et al. Citation2017), ‘belly-biting’ is not likely to occur. Fish lacking sagittal otoliths, e.g. dogfish, lampreys and skates will not be identified (Bigg and Fawcett Citation1985; Pierce and Boyle Citation1991). Small otoliths, crustacean remains, etc. might be ingested indirectly (secondary prey), through the stomach contents of fish eaten by seals. Remains from small invertebrates such as molluscs and crustaceans might be incorporated from the substratum (Pierce and Boyle Citation1991).
Grellier and Hammond (Citation2005) found that fish species with larger otoliths have a higher recovery rate than those with smaller otoliths. A possible reason for this is that smaller otoliths with a large surface-to-volume ratio may be completely digested before recovery (da Silva and Neilson Citation1985; Christiansen et al. Citation2005), resulting in overestimation of gadoids in the diet and underestimation of herring and other prey with fragile otoliths (Jobling Citation1987). A study measuring erosion times for herring and haddock otoliths in acid showed that herring otoliths could completely dissolve in only 6–7 hours, while haddock otoliths still retained 90% of their length after 5 hours immersion (Jobling and Breiby Citation1986). In their study, Grellier and Hammond (Citation2005) found that sandeel otolith recovery rates were higher when the species was present at the same time as herring, leading the authors to suspect that meal composition could affect otolith digestion rate.
An experiment performed on Antarctic fur seals (Arctocephalus gazella, Peters, 1875) showed that only ∼26% of otoliths from fish fed to seals were recovered in faeces (Staniland Citation2002). Missing otoliths were presumed eroded, fragmented or having remained in the stomach, showing that faecal sampling does not provide a complete assessment of the seal diet. Length and weight distributions estimated from otolith size are usually underestimated due to degradation of otoliths during the digestion process (Staniland Citation2002). Ethanol may also erode otoliths, and as otoliths in the present study were stored in 80% ethanol between extraction from scat samples and identification, this may have led to further underestimation of prey size and biomass, although to an uncertain degree.
In order to map the diet of e.g. pinnipeds as accurately as possible it would be preferential to combine scat sampling with other methods. Molecular genetic methods using different types of DNA and PCR techniques may be useful in estimating diet composition and identifying prey items not detected by other means. DNA analyses of harbour seal scats in Iceland identified a higher number of prey species compared with morphological identification (Granquist et al. Citation2018). However, these techniques may also identify DNA from secondary prey, thereby complicating interpretations of results.
Despite these issues, scat sampling is still a valid sampling method suitable for estimating the diet composition in harbour seals.
Estimation of annual prey consumption based on calculations of prey biomass also has its limitations and biases, after taking into consideration those of scat sampling and other diet estimation methods. Because there are several parameters to consider (e.g. population size, age groups, sex ratio, total consumption of each prey species, metabolic rate, energy density of prey and relative importance of each prey species; Nilssen et al. Citation2019), each with their own assumptions and limitations, no estimate will be completely accurate. As an example, in this study prey consumption is likely overestimated because seals may eat less per day than the assumed 4 kg during the pupping and moulting seasons. Still, methods used in the present study can result in an overview of annual prey consumption and relative importance of each prey species.
Feeding ecology
The present study shows that harbour seals in Aust-Agder and Telemark have a varied diet consisting of fish species from nine fish families: Clupeidae, Gadidae, Merluccidae, Cottidae, Labridae, Gobiidae, Scombridae, Bothidae and Pleuronectidae. This is consistent with findings in other areas (e.g. Rae Citation1973; Pierce et al. Citation1991; Bowen and Harrison Citation1994; Andersen et al. Citation2004; Herreman et al. Citation2009; Bromaghin et al. Citation2012; Luxa and Acevedo-Gutiérrez Citation2013; Scharff-Olsen et al. Citation2019). In a similar study in Østfold, eastern Skagerrak, genus Trisopterus dominated the harbour seal diet with 84.9% (NUM i) in 1990 and 52.7% in 1991. Sandeels constituted 21.9% (NUM i) of the diet in 1991. Other species and groups had only minor contributions to the diet (Olsen and Bjørge Citation1995). Diet studies of harbour seals in Skagerrak and Kattegat identified several of the same species as in the present study, where the most abundant species were cod, lemon sole, herring, sandeel sp., poor cod, long rough dab, whiting and Norway pout (Härkönen Citation1987; Aspholm et al. Citation1995). We found that gadoids were the most common prey in all locations and seasons, which was similar to those studies. Interestingly, the contribution of cod in the harbour seal diet was small in the present study. Genus Trisopterus was the most common prey in all areas except for Risør, where whiting dominated among the gadoids.
In terms of relative numerical frequency (NUM i), gadoids and flatfish dominated the diet and the most common species were Norway pout/poor cod/bib (genus Trisopterus), long rough dab/witch and whiting. The distribution is different from frequency of occurrence (FO i). The most common species group remains genus Trisopterus. However, the following species/species groups in descending order are haddock/pollack/saithe, whiting and unidentified gadoids. These species and groups occurred often in the samples but were not necessarily preyed upon in large numbers. FO i was higher than NUM i in all but one species, four-bearded rockling, suggesting that harbour seals in the study area did not specialize on a few selected fish species. Rather, as has been reported in previously mentioned studies (Pierce et al. Citation1991; Tollit and Thompson Citation1996; Bromaghin et al. Citation2012; Lance et al. Citation2012; Geiger et al. Citation2013; Luxa and Acevedo-Gutiérrez Citation2013), their diet appears to be diverse and varied, with high species richness. The switch to a large proportion of herring in winter-spring at Tvedestrand (NUMi = 35.4%) may indicate a preference for herring when this species becomes available in the area. As herring is an energy-rich species, this switch in diet could be part of the seals’ strategy to meet energy requirements during the winter months. Alternatively, it supports the theory that harbour seals are opportunists that feed on the available and most abundant species in different seasons. Such switches in diet are found in other areas, e.g. in the Danish Limfjord (Andersen et al. Citation2007), Moray Firth (Pierce et al. Citation1991; Thompson et al. Citation1991), the Salish Sea (Luxa and Acevedo-Gutiérrez Citation2013), the San Juan Islands (Lance et al. Citation2012), Oregon (Brown and Mate Citation1983), St. Andrews Bay (Sharples et al. Citation2009) and the Porsangerfjord (Ramasco et al. Citation2017).
Härkönen (Citation1987) found mackerel to constitute only a very small part of the harbour seal diet in Skagerrak and Kattegat, even though it is a commercially important species in this area, which is similar to findings in the present study where only two individuals of mackerel were identified in the diet. Härkönen (Citation1987) suggested that the species was either avoided by harbour seals or that they were simply not able to catch them; possibly the energetic cost is higher than the gain. This could suggest that harbour seals select their prey and are not simply opportunists. Mackerel otoliths also have a high surface-to-volume ratio and could therefore be less represented in scat samples (da Silva and Neilson Citation1985) due to a high degree of erosion.
Sandeels were not identified as a part of the harbour seal diet in the present study, as they have been in others (e.g. Härkönen Citation1987; Sharples et al. Citation2009; Granquist et al. Citation2018).
A study comparing stomach contents and faeces as indicators of harbour seal diet in Alaska found fragmented parts of salmonids in seal stomachs, suggesting that ‘belly biting’ occurred (Pitcher Citation1980). However, a more recent study on grey seals (Halichoerus grypus, Fabricius, 1791) found no cod DNA in seal stomachs where they did not also find cod otoliths, suggesting that ‘belly-biting’ is uncommon in the studied area (Stenson et al. Citation2013). Harbour seals prefer smaller prey (Ramasco Citation2008; Lance et al. Citation2012; Spitz et al. Citation2015; Ramasco et al. Citation2017), which they tend to swallow whole, therefore it is unlikely that ‘belly-biting’ is present in this species.
Harbour seal prey consumption and fisheries
Total fish lengths were estimated from otolith measurements and ranged from 12 mm (bib) to 548 mm (pollack) with averages ranging from 95 mm (Norway pout) to 315 mm (flounder). For more than half the species measured (herring, haddock, saithe, plaice, dab and lemon sole), MS (minimum allowed landing size) was within the calculated length range. In three of these species (herring, dab and lemon sole) more than 50% of individuals were larger than MS. However, even the largest individuals consumed of cod, whiting, hake and mackerel were smaller than the MS. For these species, it was shown that harbour seals prefer smaller fish than the sizes exploited by fisheries.
Other studies have also shown a preference for smaller fish in harbour seals (Ramasco Citation2008; Lance et al. Citation2012; Spitz et al. Citation2015; Ramasco et al. Citation2017). Fish taken by harbour seals in Limfjord, Denmark, were smaller than the specimens taken by fisheries, suggesting minimal competition between seals and fisheries (Andersen et al. Citation2007). However, harbour seals did consume large individuals of herring, at the same sizes that were targeted by the fishery, but the amount consumed by the seals was six times lower than the fishery take (Andersen et al. Citation2007).
Studies on grey seal diet have found that they prey on fish of varying sizes. A study in eastern Canada reported a mean prey length of 20.4 cm and the majority of prey were <35 cm (Hammill et al. Citation2007), while in the Baltic median fish length was 19.8 cm and ∼70% of estimated prey size was 15–25 cm (Lundström et al. Citation2007). However, a recent study on grey seals along the Norwegian coast found their diet consisting generally of small gadoids (mean 10–15 cm), which generally reflects the fish fauna in the researched area. The estimated grey seal consumption of cod was 2598 tons, ∼6–7% and 0.5–1% of the annual catches for coastal cod and Northeast Arctic cod, respectively (Nilssen et al. Citation2019). These numbers show that any direct competition between grey seals and fisheries in Norway is likely happening at a very low level.
No salmonids were identified in the harbour seal diet in the present study. In US and Scottish waters, salmonid remains were found in only 5–10% of harbour seal samples using molecular genetic techniques (Orr et al. Citation2004; Kvitrud et al. Citation2005; Matejusová et al. Citation2008). A study in Iceland found no salmonids in scat samples using molecular genetic methods, despite salmon being present in estuaries with harbour seals (Granquist et al. Citation2018). It has been suggested that lack of salmonids in the harbour seal diet could be due to low abundance compared with other prey species (Middlemas et al. Citation2006).
Harbour seals in Aust-Agder and Telemark consumed ∼315 tons fish per year, mostly non-commercial species (). The total annual amount of cod consumed by harbour seals in these counties was 7 tons, or 5% of the annual fisheries landings (). These numbers suggest that competition between local fisheries and harbour seals occurs at a relatively low level. Assuming all unidentified gadoids in the present study were cod, the annual consumption of this species would be ∼19 tons, or 14% of the annual cod landings by the commercial fisheries in that region. It should be noted that in addition to commercial fisheries, recreational fisheries also take cod, maybe as much as commercial landings in some areas (Kleiven et al. Citation2016). Therefore, the proportion of cod consumed by harbour seals relative to total landings by fisheries may be even lower. Our findings suggest that harbour seals do not constitute a serious direct competition with local fisheries along the Norwegian Skagerrak coast, and that predation by seals does not constitute an important factor in preventing the recovery of the depleted coastal cod stocks.
Acknowledgements
We are grateful to numerous colleagues at the Institute of Marine Research, Norway, and the University of Agder, Norway, for help in the field and lab. We also thank the Institute of Marine Research for financial and logistical support and Tvedestrand Municipality for logistical support.
Disclosure statement
No potential conflict of interest was reported by the author(s).
References
- Andersen SM, Lydersen C, Grahl-Nielsen O, Kovacs KM. 2004. Autumn diet of harbour seals (Phoca vitulina) at Prins Karls Forland, Svalbard, assessed via scat and fatty-acid analyses. Canadian Journal of Zoology. 82:1230–1245. doi: 10.1139/z04-093
- Andersen SM, Teilmann J, Harders PB, Hansen EH, Hjøllund D. 2007. Diet of harbour seals and great cormorants in Limfjord, Denmark: interspecific competition and interaction with fishery. ICES Journal of Marine Science. 64:1235–1245. doi: 10.1093/icesjms/fsm092
- Aspholm PE, Inne Ugland KI, Jødestøl KA, Berland B. 1995. Sealworm (Pseudoterranova decipiens) infection in common seals (Phoca vitulina) and potential intermediate fish hosts from the outer Oslofjord. International Journal for Parasitology. 25:367–373. doi: 10.1016/0020-7519(94)00133-9
- Berg I, Haug T, Nilssen KT. 2002. Harbour seal (Phoca vitulina) diet in Vesterålen, North Norway. Sarsia. 87:451–461. doi: 10.1080/0036482021000155735
- Bigg MA, Fawcett I. 1985. Two biases in diet determination of northern fur seals (Callorhinus ursinus). In: Beddington JR, Beverton RJH, Lavigne DM, editors. Marine mammals and fisheries. New York, NY: George Allen & Unwin Ltd; p. 284–291.
- Bjørge A, Bekkby T, Bakkestuen V, Framstad E. 2002a. Interactions between harbour seals, Phoca vitulina, and fisheries in complex coastal waters explored by combined Geographic Information System (GIS) and energetics modelling. ICES Journal of Marine Science. 59:29–42. doi: 10.1006/jmsc.2001.1137
- Bjørge A, Øien N, Hartvedt S, Bøthun G, Bekkby T. 2002b. Dispersal and bycatch mortality in gray, Halichoerus grypus, and harbor, Phoca vitulina, seals tagged at the Norwegian coast. Marine Mammal Science. 18:963–976. doi: 10.1111/j.1748-7692.2002.tb01085.x
- Bjørge A, Thompson D, Hammond P, Fedak M, Bryant E, Aarefjord H, Roen R, Olsen M. 1995. Habitat use and diving behaviour of harbour seals in a coastal archipelago in Norway. In: Blix AS, Walløe L, Ulltang Ø, editors. Whales, seals, fish and man. Tromsø: Elsevier Science; p. 211–223.
- Bowen WD, Harrison GD. 1994. Offshore diet of grey seals Halichoerus grypus near Sable Island, Canada. Marine Ecology Progress Series. 112:1–11. doi: 10.3354/meps112001
- Bromaghin JF, Lance MM, Elliott EW, Jeffries SJ, Acevedo-Gutiérrez A, Kennish JM. 2012. New insights into the diets of harbor seals (Phoca vitulina) in the Salish Sea revealed by analysis of fatty acid signatures. Fishery Bulletin. 111:13–26.
- Brown RF, Mate BR. 1983. Abundance, movements, and feeding habits of harbor seals, Phoca vitulina, at Netarts and Tillamoor Bays, Oregon. Fishery Bulletin. 81:291–301.
- Christiansen JS, Gamst Moen A-G, Hansen TH, Nilssen KT. 2005. Digestion of capelin, Mallotus villosus (Müller), herring, Clupea harengus L., and polar cod, Boreogadus saida (Lepechin), otoliths in a simulated seal stomach. ICES Journal of Marine Science. 62:86–92. doi: 10.1016/j.icesjms.2004.06.022
- da Silva J, Neilson JD. 1985. Limitations of using otoliths recovered in scats to estimate prey consumption in seals. Canadian Journal of Fisheries and Aquatic Sciences. 42:1439–1442. doi: 10.1139/f85-180
- Fiskeridirektoratet [Directorate of Fisheries], FD. 2018. Fangst fordelt på landingssted [Catch sorted by landing location], Norway: [accessed: 06.12.18]. https://www.fiskeridir.no/Yrkesfiske/Statistikk-yrkesfiske/Fangst-og-kvoter/Fangst/Fangst-fordelt-paa-landingssted.
- Ford MJ, Hempelmann J, Hanson MB, Ayres KL, Baird RW, Emmons CK, Lundin JI, Schorr GS, Wasser SK, Park LK. 2016. Estimation of a Killer Whale (Orcinus orca) population’s diet using sequencing analysis of DNA from feces. PLoS One. 11:14.
- Frost KJ, Lowry LF. 1986. Sizes of walleye pollock, Theragra chalcogramma, consumed by marine mammals in the Bering Sea. Fishery Bulletin. 84:192–197.
- Geiger GL, Atkinson S, Waite JN, Blundell GM, Carpenter JR, Wynne K. 2013. A new method to evaluate the nutritional composition of marine mammal diets from scats applied to harbor seals in the Gulf of Alaska. Journal of Experimental Marine Biology and Ecology. 449:118–128. doi: 10.1016/j.jembe.2013.09.005
- Graham IM, Harris RN, Matejusová I, Middlemas SJ. 2011. Do ‘rogue’ seals exist? Implications for seal conservation in the UK. Animal Conservation. 14:587–598. doi: 10.1111/j.1469-1795.2011.00469.x
- Granquist SM, Esparza-Salas R, Hauksson E, Karlsson O, Angerbjörn A. 2018. Fish consumption of harbour seals (Phoca vitulina) in north western Iceland assessed by DNA metabarcoding and morphological analysis. Polar Biology. 41:2199–2210. doi: 10.1007/s00300-018-2354-x
- Grellier K, Hammond PS. 2005. Feeding method affects otolith digestion in captive gray seals: implications for diet composition estimation. Marine Mammal Science. 21:296–306. doi: 10.1111/j.1748-7692.2005.tb01229.x
- Hammill MO, Stenson GB, Proust F, Carter P, McKinnon D. 2007. Feeding by grey seals in the Gulf of St. Lawrence and around Newfoundland. NAMMCO Scientific Publications. 6:135–152. doi: 10.7557/3.2729
- Härkönen T. 1986. Guide to the otoliths of the bony fishes of the north-east Atlantic. Denmark, Sweden: Danibu ApS. Biological Consultants, Hellerup.
- Härkönen T. 1987. Seasonal and regional variations in the feeding habits of the harbour seal, Phoca vitulina, in the Skagerrak and the Kattegat. Journal of Zoology. 213:535–543. doi: 10.1111/j.1469-7998.1987.tb03724.x
- Haug T, Nilssen KT, Lindblom L, Lindstrøm U. 2007. Diets of hooded seals (Cystophora cristata) in coastal waters and drift ice waters along the east coast of Greenland. Marine Biology Research. 3:123–133. doi: 10.1080/17451000701358531
- Herreman JK, Blundell GM, Ben-David M. 2009. Evidence of bottom-up control of diet driven by top-down processes in a declining harbor seal Phoca vitulina richardsi population. Marine Ecology Progress Series. 374:287–300. doi: 10.3354/meps07719
- Hyslop EJ. 1980. Stomach contents analysis - a review of methods and their application. Journal of Fish Biology. 17:411–429. doi: 10.1111/j.1095-8649.1980.tb02775.x
- Iverson SA, Field C, Don Bowen W, Blanchard W. 2004. Quantitative fatty acid signature analysis: a new method of estimating predator diets. Ecological Monographs. 74(2):211–235.
- Jobling M. 1987. Marine mammal faeces samples as indicators of prey importance - a source of error in bioenergetics studies. Sarsia. 72:255–260. doi: 10.1080/00364827.1987.10419722
- Jobling M, Breiby A. 1986. The use and abuse of fish otoliths in studies of feeding habits of marine piscivores. Sarsia. 71:265–274. doi: 10.1080/00364827.1986.10419696
- Kleiven AR, Fernandez-Chacon A, Nordahl J-H, Moland E, Heiberg Espeland S, Knutsen H, Moland Olsen E. 2016. Harvest pressure on coastal Atlantic cod (Gadus morhua) from recreational fishing relative to commercial fishing assessed from tag-recovery data. PLoS ONE. 11(3): e0149595. doi: 10.1371/journal.pone.0149595
- Kvitrud MA, Riemer SD, Brown RF, Bellinger MR, Banks MA. 2005. Pacific harbor seals (Phoca vitulina) and salmon: genetics present hard numbers for elucidating predator-prey dynamics. Marine Biology. 147:1459–1466. doi: 10.1007/s00227-005-0047-9
- Lance MM, Chang W-Y, Jeffries SJ, Pearson SF, Acevedo-Gutiérrez A. 2012. Harbor seal diet in the Northern Puget Sound: implications for the recovery of depressed fish stocks. Marine Ecology Progress Series. 464:257–271. doi: 10.3354/meps09880
- Lovdata: Forskrift om utøvelse av fisket i sjøen. [Norwegian Legislations and Regulations: Regulations on the Exercise of Fisheries in the Sea]. 2005. Oslo, Norway: Nærings- og fiskeridepartementet [Ministry of Trade, Industry and Fisheries], [accessed: autumn 2018] https://lovdata.no/dokument/SF/forskrift/2004-12-22-1878?q=Forskrift%20om%20ut%C3%B8velse%20av%20fisket.
- Lundström K, Hjerne O, Alexandersson K, Karlsson O. 2007. Estimation of grey seal (Halichoerus grypus) diet composition in the Baltic Sea. NAMMCO Scientific Publications. 6:177–196. doi: 10.7557/3.2733
- Luxa K, Acevedo-Gutiérrez A. 2013. Food habits of harbor seals (Phoca vitulina) in two estuaries in the central Salish Sea. Aquatic Mammals. 39:10–22. doi: 10.1578/AM.39.1.2013.10
- Matejusová I, Doig F, Middlemas SJ, Mackay S, Douglas A, Armstrong JD, Cunningham CO, Snow M. 2008. Using quantitative real-time PCR to detect salmonid prey in scats of grey Halichoerus grypus and harbour Phoca vitulina seals in Scotland - an experimental and field study. Journal of Applied Ecology. 45:632–640. doi: 10.1111/j.1365-2664.2007.01429.x
- Middlemas SJ, Barton TR, Armstrong JD, Thompson PM. 2006. Functional and aggregative responses of harbour seals to changes in salmonid abundance. Proceedings of the Royal Society B: Biological Sciences. 273:193–198. doi: 10.1098/rspb.2005.3215
- Nilssen KT, Bjørge A. 2018. Status for kystsel: Anbefaling av jaktkvoter for 2019 [Status of coastal seals: recommendation of hunting allowances for 2019]. Norway: Sjøpattedyrutvalget [Committee for Marine Mammals], Institute of Marine Research.
- Nilssen KT, Lindstrøm U, Westgaard JI, Lindblom L, Blencke T-R, Haug T. 2019. Diet and prey consumption of grey seals (Halichoerus grypus) in Norway. Marine Biology Research. 15(2):137–149. doi: 10.1080/17451000.2019.1605182
- Olsen M, Bjørge A. 1995. Seasonal and regional variations in the diet of harbour seals in Norwegian waters. In: Blix AS, Walløe L, Ulltang Ø, editors. Whales, seals and man. Amsterdam: Elsevier Science; p. 271–285.
- Orr AJ, Banks AS, Mellman S, Huber HR, Delong RL, Brown RF. 2004. Examination of the foraging habits of Pacific harbor seal (Phoca vitulina richardsi) to describe their use of the Umpqua River, Oregon, and their predation on salmonids. Fishery Bulletin. 102:108–117.
- Orr AJ, Laake JL, Dhruv MI, Banks AS, Delong RL, Huber HR. 2003. Comparison of processing pinniped scat samples using a washing machine and nested sieves. Wildlife Society Bulletin. 31:253–257.
- Parsons KM, Piertney SB, Middlemas SJ, Hammond PS, Armstrong JD. 2005. DNA-based identification of salmonid prey species in seal faeces. Journal of Zoology. 266:275–281. doi: 10.1017/S0952836905006904
- Pierce GJ, Boyle PR. 1991. A review of methods for diet analysis in piscivorous marine mammals. Oceanography and Marine Biology: An Annual Review. 29:409–486.
- Pierce GJ, Thompson PM, Miller A, Diack JSW, Miller D, Boyle PR. 1991. Seasonal variation in the diet of common seals (Phoca vitulina) in the Moray Firth area of Scotland. Journal of Zoology. 223:641–652. doi: 10.1111/j.1469-7998.1991.tb04393.x
- Pitcher KW. 1980. Stomach contents and feces as indicators of harbor seal, Phoca vitulina, foods in the Gulf of Alaska. Fishery Bulletin. 78:797–798.
- Rae BB. 1973. Further observations on the food of seals. Journal of Zoology. 169:287–297. doi: 10.1111/j.1469-7998.1973.tb04558.x
- Ramasco V. 2008. Habitat use and feeding behaviour of harbour seals (Phoca vitulina) in Vesterålen [master’s thesis]. Tromsø, Norway: The Arctic University of Norway.
- Ramasco V, Biuw M, Nilssen KT. 2014. Improving time budget estimates through the behavioural interpretation of dive bouts in harbour seals. Animal Behaviour. 94:117–134. doi: 10.1016/j.anbehav.2014.05.015
- Ramasco V, Lindström U, Nilssen KT. 2017. Selection and foraging response of harbour seals in an area of changing prey resources. Marine Ecology Progress Series. 581:199–214. doi: 10.3354/meps12285
- Reijnders PJH, Brasseur SMJM, Tougaard S, Siebert U, Borchardt T, Stede M. 2010. Population development and status of harbour seals (Phoca vitulina) in the Wadden Sea. NAMMCO Scientific Publications. 8:95–106. doi: 10.7557/3.2677
- Riemer SD, Wright BE, Brown RF. 2011. Food habits of Steller sea lions (Eumetopias jubatus) off Oregon and northern California, 1986-2007. Fishery Bulletin. 109:369–381.
- Scharff-Olsen C, Galatius A, Teilmann J, Dietz R, Andersen SM, Jarnit S, Kroner A-M, Bolt Botnen A, Lundström K, Møller PR, et al. 2019. Diet of seals in the Baltic Sea region: a synthesis of published and new data from 1968 to 2013. ICES Journal of Marine Science. 76:284–297. doi: 10.1093/icesjms/fsy159
- Schwarz D, Spitzer SM, Thomas AC, Kohnert CM, Keates TR, Acevedo-Gutiérrez A. 2018. Large-scale molecular diet analysis in a generalist marine mammal reveals male preference for prey of conservation concern. Ecology and Evolution. 8:9889–9905. doi: 10.1002/ece3.4474
- Sharples RJ, Arrizabalaga B, Hammond PS. 2009. Seals, sandeels and salmon: diet of harbour seals in St. Andrews Bay and the Tay Estuary, southeast Scotland. Marine Ecology Progress Series. 390:265–276. doi: 10.3354/meps08232
- Spitz J, Dupuis L, Becquet V, Dubief B, Trites A W. 2015. Diet of the harbour seal Phoca vitulina: implication for the flatfish nursery in the Bay of Somme (English Channel, France). Aquatic Living Resources. 28:11–19. doi: 10.1051/alr/2015001
- Staniland IJ. 2002. Investigating the biases in the use of hard prey remains to identify diet composition using Antarctic fur seals (Arctocephalus gazella) in captive feeding trials. Marine Mammal Science. 18:223–243. doi: 10.1111/j.1748-7692.2002.tb01030.x
- Stenson GB, Hammill MO, Flight J. 2013. Winter diet of grey seals in Cabot Strait. DFO Canadian Science Advisory Secretariat Research Document 2010/128. iv + 22 p.
- Teilmann J, Galatius A. 2018. Harbour seal Phoca vitulina. In: Würsig J, Thewissen JGM, Kovacs KM, editors. Encyclopedia of marine mammals. 3rd ed. San Diego, CA: Academic Press; p. 451–455.
- Thompson PM, Fedak MA, McConnell BJ, Nicholas KS. 1989. Seasonal and sex-related variation in the activity patterns of common seals (Phoca vitulina). Journal of Applied Ecology. 26:521–535. doi: 10.2307/2404078
- Thompson PM, McConnell BJ, Tollit DJ, Mackay A, Hunter C, Racey PA. 1996. Comparative distribution, movements and diet of harbour and grey seals from the Moray Firth, N.E. Scotland. Journal of Applied Ecology. 33:1572–1584. doi: 10.2307/2404795
- Thompson PM, Miller D. 1990. Summer foraging activity and movements of radio-tagged common seals (Phoca vitulina. L.) in the Moray Firth, Scotland. Journal of Applied Ecology. 27:492–501. doi: 10.2307/2404296
- Thompson PM, Pierce GJ, Hislop JRG, Miller D, Diack JSW. 1991. Winter foraging by common seals (Phoca vitulina) in relation to food availability in the Inner Moray Firth, N.E. Scotland. Journal of Animal Ecology. 60:283–294. doi: 10.2307/5460
- Tollit DJ, Thompson PM. 1996. Seasonal and between-year variations in the diet of harbour seals in the Moray Firth, Scotland. Canadian Journal of Zoology. 74:1110–1121. doi: 10.1139/z96-123
- Tverin M, Esparza-Salas R, Strömberg A, Tang P, Kokkonen I, Herrero A, Kauhala K, Karlsson O, Tiilikainen R, Vetemaa M, et al. 2019. Complementary methods assessing short and long-term prey of a marine top predator – applications to the grey seal-fishery conflict in the Baltic Sea. PLoS One. 14(1):e0208694. doi: 10.1371/journal.pone.0208694
- Wickens PA, Japp DW, Shelton PA, Kriel F, Goosen PC, Rose B, Augustyn CJ, Bross CAR, Penney AJ, Krohn RG. 1992. Seals and fisheries in South Africa – competition and conflict. South African Journal of Marine Science. 12:773–789. doi: 10.2989/02577619209504741
- Ydesen KS, Wisniewska DM, Hansen JD, Beedholm K, Johnson M, Madsen PT. 2014. What a jerk: prey engulfment revealed by the high-rate, super-cranial accelerometry on a harbour seal (Phoca vitulina). Journal of Experimental Biology. 217:2239–2243. doi: 10.1242/jeb.100016