
 ?Mathematical formulae have been encoded as MathML and are displayed in this HTML version using MathJax in order to improve their display. Uncheck the box to turn MathJax off. This feature requires Javascript. Click on a formula to zoom.
ABSTRACT
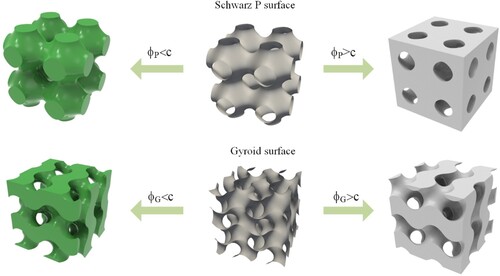
Based on the triply periodic minimal surface (TPMS), 3D auxetic structures are successfully implemented using a dual-period function. A series of shape-controllable, dual-period deformation functions are obtained by summarising the characteristics of periodic deformation functions and applying Bezier curve fitting methods. Then, with the geometry originating from the Schwarz primitive (P) of TPMS, the periodic shape transformation of TPMS is achieved using the dual-period deformation functions. The property (negative Poisson’s ratio) of the auxetic structure is investigated based on the control parameters (the TPMS c value, periodic function η, and deformation index γ). The auxetic structures can exhibit excellent 3D negative Poisson’s ratio properties, and the Poisson’s ratio can be effectively adjusted. Moreover, a heterostructure with positive and negative Poisson’s ratio structures is obtained and applied to a stem in the hip joint. The simulation proves that the heterostructure can effectively prevent the failure of the bone implant.
1. Introduction
Auxetic structures are a class of mechanical metamaterials with negative Poisson’s ratio (NPR) properties. Auxetic structures can expand laterally when stretched and contract laterally when compressed. Their unique deformation features make them attractive in medical implants (Liu et al. Citation2021) and soft robots (Liu et al. Citation2022b). Compared with traditional materials with a positive Poisson’s ratio (PPR), auxetic materials have better mechanical properties, such as high shear modulus (Kolken Citation2017), energy absorption (Zhang, Lu, and You Citation2020; Alomarah et al. Citation2020) and sound absorption (Li et al. Citation2023). Lakes was the first to create an artificial auxetic foam material in 1987 (Lakes Citation1987). Since then, various structures and design methods have been proposed, focusing on the design and performance of auxetic structures (Zhang et al. Citation2021). The NPR effect mainly stems from typical microstructural features, such as re-entrance, rotation, and chirality (Ren et al. Citation2018). However, the design of traditional auxetic materials relies on the designer’s intuition to some extent. In addition, the topology optimisation method can obtain NPR structures through the design domain of specific constraints (Gao et al. Citation2019). The auxetic effect may also occur after compressive buckling of the structure. The buckling mode with an orthogonal ellipse pattern has been exploited to design the 3D metamaterials with an NPR (Li et al. Citation2023; Babaee et al. Citation2013).
Most auxetic structures are obtained from periodic arrays of basic cells. These basic cells generally consist of trusses or shells, or are generated by Boolean operations on the basic geometry (Wang et al. Citation2020). However, this type of structural design method has weaknesses in controlling the shape and mechanical properties of the structure. TPMS, as a type of implicit surface with a complete mathematical representation, offers significant benefits over conventional modelling in terms of structural performance control and optimisation. The actual performance, such as porosity and volume-specific surface area, of TPMS can be directly controlled by adjusting the function parameters. In addition, the smooth surface and good connectivity of TPMS make it ideal for application in different disciplines, such as tissue engineering (Gorgin Karaji Citation2017) and heat sink design (Kaur and Singh Citation2021). Extensive research has been conducted on the mechanical properties of TPMS (Wang et al. Citation2021; Feng et al. Citation2022), where the elastic modulus and anisotropy are the performance indicators that are paid close attention to. However, only a few studies have focused on the NPR of TPMS. Soyarslan et al. (Soyarslan, Blümer, and Bargmann Citation2019) found that diamond structures can exhibit auxetic effects under certain circumstances. However, the effects are limited to a small relative density and special compressive strain range, and the value of Poisson’s ratio is unstable. Zheng et al. (Zheng, Guo, and Watanabe Citation2021) proposed a 3D auxetic structure derived from the P surface. The buckling-induced auxetic behaviour was evaluated by compression testing and finite element analysis. The developed method provides a new perspective for designing auxetic structures, and it can realise NPR by optimising the implicit equation of TPMS. As one of the best effective treatments in healthcare, total hip arthroplasty (THA) is widely performed to address the degeneration and failure of bones and joints (George and Kumar Citation2013; Pivec et al. Citation2012). In the hip implant design, porous structures are increasingly being employed to mimic primary bone properties (Wang et al. Citation2018; Barba, Alabort, and Reed Citation2019) better. Compared to truss structures, hip implants designed based on TPMS can exhibit better mechanical behaviour (Barba, Alabort, and Reed Citation2019; Kladovasilakis, Tsongas, and Tzetzis Citation2020). After the hip stem implant is implanted in bone, it will repeatedly be loaded under bending loads (Schmalzried et al. Citation2000), which will create tensile loading and compression on either side of the neutral axis of the implant. The tensile and compression loading will cause lateral deformation of the implant, retracts or compression. Structural deformation on different sides will lead to compression and stretching of the bone-implant interface. According to Hoffman’s criterion, implants are prone to failure under a tensile situation (Verdonschot and Huiskes Citation1996). Additionally, implant retraction allows wearing particles to enter the space between the implant and bone, triggering inflammation (Abu-Amer, Darwech, and Clohisy Citation2007). Kolken et al. (Kolken et al. Citation2018) proposed a hip joint composed of mixed meta-biomaterials with a PPR structure and NPR structure reasonably distributed. It is known that the NPR structure expands laterally when stretched axially, while the PPR structure expands laterally in axial compression. The implant can form compression on both sides of its interface with the surrounding bone, effectively improving implant–bone contact and potentially extending implant life. However, the structure requires excellent modelling ability in the design process.
In this work, the periodic function is used to perform periodic deformation based on TPMS, and an auxetic structure design method is proposed. With typical periodic functions, namely, trigonometric and sawtooth, the auxetic deformation formula, named dual period deformation function based on TPMS, is deduced. The auxetic structure design methods based on the P structure are then obtained. Furthermore, the periodic deformation functions are parameterised using spline curves (Bezier curves (Piegl and Tiller Citation1996)), and a series of periodic deformation functions with curvature variation is obtained by using the variation of their control points.
The design parameters that significantly impact structural performance, such as P-surface fundamental parameters, deformation degree, and deformation function, are highlighted. Moreover, the properties (Poisson’s ratio, strength, and anisotropy) of the structure are explored with the homogenisation method. With FEA and compression experiment, the deformation characteristics of the 3D auxetic structure during compression are observed and the influence of design parameters on the structural performance is discussed. Based on more than 50 sets of structural modelling and analysis, the mapping relationships between different design parameters and structural Poisson's ratio are obtained, which can be used as design reference and guidance for engineering applications.
A heterostructure with reasonably distributed NPR and PPR structures is also designed based on the practical application requirements of a hip joint. The heterostructure is made to be a part of the hip stem. Using the fusion transition algorithm - the sigmoid function method, the heterostructure is generated through the fusion of the P surface-based NPR structure and the G surface-based PPR structure. Experiments prove that the structure can effectively increase the contact area between the implant and bone during the deformation process and improve the service life of the implant.
2. Structure design method
2.1. TPMS solid structure generation
TPMS is a type of minimal surface with zero mean curvature, where the surface areas are minimised under the assigned boundaries. TPMS surfaces are of many types. This research involves P surface and G surface, and their functional formulas are as follows:
Schwarz P
(1)
Gyroid
In when , the surface mesh of the TPMS can be obtained. When
, the volume structure of the P structure can be obtained using the signed distance field technique. The G structure can be similarly obtained using a similar method.
Figure 1. Basic TPMS: Schwarz P structure and Gyroid structure.
2.2. Dual-period deformation function
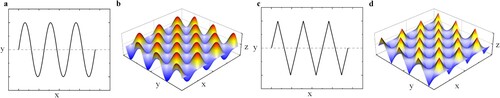
In the 2D case, the structure exhibits the NPR property when the buckling pattern of the orthogonal ellipse emerges during compression (Bertoldi et al. Citation2010). TPMS surfaces have 3D periodicity. A suitable class of periodic deformation functions is developed to guide the periodic deformation of the structure, resulting in an orthogonal elliptic pattern and guiding the negative Poisson's ratio deformation. In this study, trigonometric and sawtooth functions are discussed as deformable basis functions. The trigonometric function is shown in (a), and its expression is.
(3)
(3) where
is the period factor. The sawtooth function is shown in (c), and its expression is
(4)
(4) As shown in , the buckling mode of the orthogonal ellipse can show the property of NPR during compression (Zheng, Guo, and Watanabe Citation2021). In the two states of the structure before and after deformation, the coordinates change of random points on the structure satisfies the dual-period deformation function. The dual-period deformation function based on the trigonometric function is shown in (b), and its expression is.
(5)
(5) (d) shows the dual-period deformation function in the form of the sawtooth function, which is
(6)
(6)
Figure 2. Period functions: (a) trigonometric function, (b) dual-period deformation function based on the trigonometric function, (c) sawtooth function, and (d) dual-period deformation function based on the sawtooth function.
2.3. Bezier fitting period curve
Bezier curves were invented by the French engineer Pierre Bezier in 1962 for designing automobile bodies. Bezier curves are parametric polynomial curves defined by control points. Based on the approximation principle, these curves can effectively describe various mathematical curves by constructing a set of particular polynomial basis functions. Bezier curves are widely used in computer graphics and animations. A Bezier curve of degree n can be expressed as.
(7)
(7) where
is the control point and
is the Bernstein basis function whose polynomial expression is as follows:
(8)
(8) As shown in (a), in the case with the same amplitude and period, the cosine and sawtooth functions have three common points in half a period. If the period of the function is
and the amplitude is 1, then the three common points are as follows:
Figure 3. Bezier fitting curve: (a) three common points of different period functions, (b) two control points of the Bezier fitting curve, (c) period form of the Bezier fitting curve, (d) Bezier fitting curve with , (e) Bezier fitting curve with
, and (f) Bezier fitting curve with
.
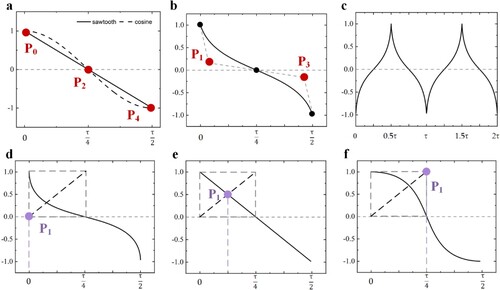
The maximum value of the function is at , and the minimum value of the function is at
.
is the zero point of the function. The control point is inserted at a suitable position between the three common points, and the Bezier curve is parametrically controlled by the change in the control point. Specifically, control point
is inserted between
and
, and
is inserted between
and
, as shown in (b). In addition, to ensure that the Bezier curve can always pass through
,
and point
are centrosymmetric relative to
.
where
is the bump index of the Bezier fitting curve,
. The bump index can measure the bump trend characteristics of the fitted curve in a quarter. Varied period curves can be obtained by adjusting the control points. As shown in ,e, and f, when
, the curve is concave in the quarter period. When
, the curve is similar to that of the sawtooth function, and when
, the curve is similar to that of the trigonometric function.
In the Bezier curve fitting process, after the control points are determined, the discrete points on the curve can be calculated with De Casteljau’s algorithm. Then, the periodic curves can be formed through the array of Bezier fitting curves, as shown in (c). The expression of the dual-period deformation function based on the Bezier fitting period curve is.
(9)
(9) where
is the Bezier fitting period curve similar to the cosine function and
is the Bezier fitting period curve similar to the sine function.
2.4. 3D auxetic deformation based on P surface
In different TPMS surfaces, the topological characteristics of the P surface are similar to the structure of the orthogonal arrangement, which has potential advantages in realising the auxetic effect. The P surface is selected as the basic structure of the deformation design method.
In the 2D deformation situation ((a)), the dual-period deformation function is applied to the implicit equations of the P-structure, resulting in a two-dimensional deformation of the structure. The 2D auxetic deformation method based on the P structure is obtained as.
(10)
(10) where L is the unit length of the P structure and equals
. In particular,
is defined as the deformation index that evaluates the degree of deformation relative to the original structure. To avoid extreme cases,
, and
is calculated as
(11)
(11) EquationEq. (10)
(10)
(10) shows only one kind of 2D auxetic deformation method. 2D deformation methods in different directions can be obtained by simply adjusting the equation.
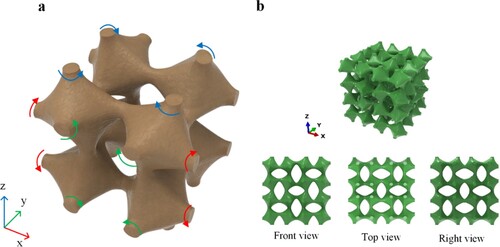
Figure 4. (a) 2D auxetic deformation method and evaluation of structural deformation degree, (b) orthographic views of the structure.
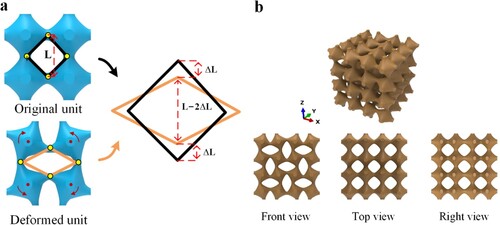
As shown in (b), compared with the original P structure, the current structure achieves 2D auxetic deformation under EquationEq. (10)(10)
(10) . The deformation effects are reflected from different model orientations. In the front view, a uniform orthogonal elliptical deformation pattern appears in the void portion of the model. In the top and right-side views, no noticeable change is observed relative to the original P structure.
Furthermore, based on EquationEq. (10)(10)
(10) , 3D auxetic deformation methods are obtained by extending the 2D deformation to the 3D situation. Here, we have two kinds of 3D auxetic deformation methods with different deformation characteristics: the 3D quasi-orthogonal auxetic deformation method based on the P structure (P-QA) and the 3D non-orthogonal auxetic deformation method based on the P structure (P-NA).
The deformation result of the P-QA structure is similar to the buckling modes of 3D perforated structure. (a) shows the deformed structure, where a single cell is rotated in three directions. The arrows of different colours represent the rotational deformation around that colour axis. The deformation patterns of the front and right views are orthogonal to each other, and the equation is.
(12)
(12) Under the action of the deformation algorithm, the P structure achieves uniform 3D deformation. As shown in (a), the orthogonal elliptical pattern can be observed in the different views of the P-QA structure. The 3D deformation results for the units of P-QA are similar to those of the buckling mode that can exhibit the 3D NPR property (Zheng, Guo, and Watanabe Citation2021). In particular, the case of the lower-left elliptical pattern is observed. In the front view, the ellipse's long axis is in the vertical direction; however, in the right view, the ellipse's long axis is in the horizontal direction. The front-view pattern is orthogonal to the right-view pattern.
Figure 5. P-QA structure design method: (a) 3D auxetic deformation mechanism, (b) orthographic views of the P-QA structure.
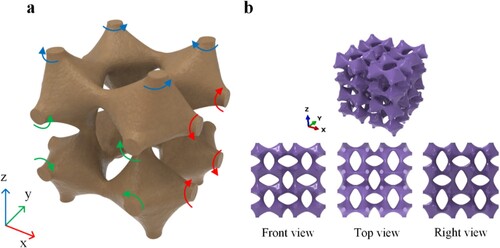
In addition, by altering EquationEq. (12)(12)
(12) , the obtained structure P-NA can achieve an effective 3D NPR effect, and the deformation patterns are similar in orthographic views. The equation is.
(13)
(13) As shown in (a), how the structure changes in three directions are apparent. When compared with (a), in one of the transverse axes, the two structural design approaches rotate in opposite directions (red axis). In the P-NA structure ((b)) generated by EquationEq. (13)
(13)
(13) , the patterns of the different views are the same. In the front view, the ellipse's long axis in the lower-left corner is in the vertical direction, similar to the pattern in the right view.
Figure 6. P-NA structure design method: (a) 3D auxetic deformation mechanism, (b) orthographic views of the P-NA structure.
Based on the above-mentioned methods and formulas, the proposed design method is realised by C++ code. The structure can be modelled as a STL mesh form. The structure is designed with 4 × 4 × 4 units and the size of the structure is 40mm×40mm×40 mm.
3. Structure analysis and fabrication
3.1. Numerical simulation
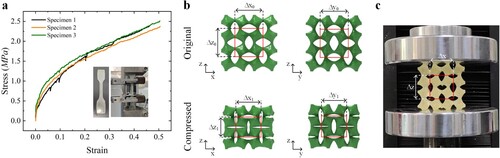
In the analysis process, the STL format file is imported into Hypermesh (Altair Engineering Inc., USA) for meshing. The mesh type is tetrahedral mesh(C3D4). The meshed structure is outputted to Abaqus for homogenisation and nonlinear buckling analyses. The Abaqus/Riks is used, and a Nonlinear geometry option is applied for nonlinear buckling analysis. All the translational and rotational degrees of freedom of the points on the bottom surface are constrained. A displacement control boundary is applied at the points on the top surface with all the rotational degrees of freedom are constrained. To avoid self-penetration, the universal contact is set to include all surface pairs of the structure itself. The static friction coefficient of the material is measured experimentally to be 0.3, and the kinetic friction coefficient is 0.33. In addition, after experimental measurement, the density of the flexible resin is 1.02 g/cm3, Young’s modulus is 3.48 MPa, and Poisson’s ratio is 0.41. (a) presents the stress–strain plots of the printed specimens. To improve simulation accuracy and shorten calculation efficiency, the mesh convergence study is conducted to determine a suitable mesh size. Three numerical simulations of P-QA structure with different mesh sizes (0.4, 0.5 and 0.6 mm under a total structure length of 40 mm) are simulated. The mesh size of 0.5 mm is employed for the subsequent numerical simulations.
Figure 7. (a) stress-strain plots of the printed specimens, (b) measurement of Poisson's ratio in varied directions, and (c) measurement of Poisson's ratio during compression.
3.2. Specimen and compression test
The manufacturing of the designed models is performed on a commercial Digital Light Projection (DLP) printer (MoonRay-D, Sprintray, Los Angeles, CA, USA). Flexible resin (eResin-Flex, Shenzhen eSUN Industrial Co., Ltd, China) is used to manufacture the structure. In detail, the sliced layer height is set to 50m, and the exposure time is set to 9 s per layer. After 3D printing, the structure is placed in a beaker containing ethanol for 1 min and placed in a UV lamp for 1 min.
A compression experiment is conducted on the manufactured samples using an electronic universal testing machine, and the compression speed is 1 mm/min. Real-time recording of the deformation process during the compression of the structure using Digital Image Correlation (DIC) equipment. The sampling frequency of the DIC device is set to 0.5 min/frame. The sample is sprayed to obtain a more uniform distribution of spots, which allows the DIC equipment to better capture structural deformation. In (b) and (c), the value of Poisson’s ratio in different directions is determined as follows:
(14)
(14)
(15)
(15) With the distance measurement function of the DIC device, the obtained deformation cloud data are sampled several times to obtain the Poisson's ratio data of the structure during the compression process.
4. Result and discussion
4.1. Simulation and verification of 3D auxetic properties
This section explores the auxetic property of the three structures (2D auxetic deformation structure, P-QA structure and P-NA structure). The three structures are modelled with 4 × 4 × 4 arrays with the same control parameters ( = 0.5, c = 30,
= 30), and the model size is 40 mm × 40 mm × 40 mm.
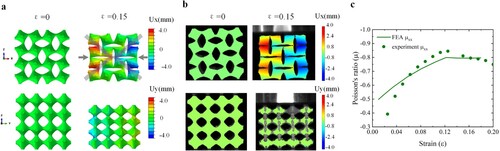
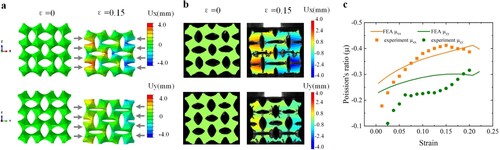
When the compression strain is 0 and 0.15, respectively, the compression simulation results of the structure with the DIC cloud results are shown in (a) and (b). The compression simulation results have a high deformation agreement with the DIC deformation cloud results. The structure has a significant 2D NPR deformation. On the XZ plane, the left side of the structure is deformed towards the X-positive direction. The negative displacement compression deformation occurs on the right side of the structure. Therefore, the structure shrinks toward the centre, reflecting NPR's property. On the ZY plane, no NPR effect is observed during the deformation process. Using the distance measurement tool in the DIC technique, the variation of Poisson's ratio of the structure is obtained, as shown in (c). In the X-direction, the simulated value of Poisson's ratio of the structure is similar to the experimental value, and the NPR effect of the structure is apparent.
Figure 8. 2D auxetic deformation structure: (a) compression simulation deformation results, (b) measurement of sample deformation during compression using the DIC technique, (c) Poisson's ratio of the structure during compression.
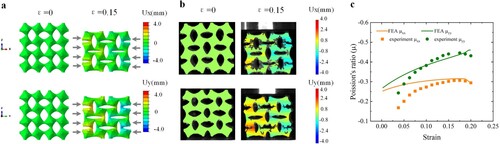
In (a) and (b), the simulation and experimental results of the P-QA structure during compression are shown, and the simulation and experimental diagrams are in good consistency. The different directions of the structure move toward the centre of the structure during compression, reflecting the prominent 3D auxetic property. In (c), the discrepancy between the experimental and simulated values is relatively large when the strain is slight due to the manufacturing accuracy and the measurement accuracy limitation. The experimental and simulated values tend to be the same with the increase of deformation.
Figure 9. P-QA structure: (a) compression simulation deformation results, (b) measurement of sample deformation during compression using the DIC technique, (c) Poisson's ratio of the structure during compression.
Likewise, during compressive deformation, in (a), the P-NA structure contract toward the centre in both x and y directions, and the deformation trend of the orthogonal ellipse continues in different views. The displacement results prove that the P-NA structure can exhibit the property of 3D NPR during compression. Comparing (a) with (b), the simulation results are relatively close to the experimental results. In (c), when the strain is greater than 0.1, the simulation results are in fine agreement with the experimental results in the Poisson's ratio curves in different directions.
Figure 10. P-NA structure: (a) compression simulation deformation results, (b) measurement of sample deformation during compression using the DIC technique, (c) Poisson's ratio of the structure during compression.
Next, the deformation process of the structure in compression is shown and used to investigate the negative Poisson's ratio deformation mechanism.
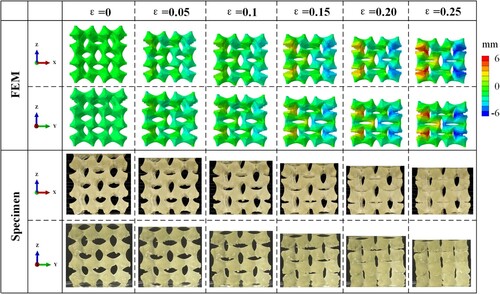
As shown in , the relationship between the experimental and simulation groups is apparent in the process of compression, and the results correspond. The changes in the long and short axes of the elliptical pores in different views can directly reflect the deformation characteristics of the structure. In the ZX direction, the strain varies from 0 to −0.25, and the simulated pattern is similar to the elliptical shape in the experimental pattern of the sample, proving that the simulation and experimental processes are basically consistent with the auxetic effect in the ZX direction. In the ZY direction, the strain changes from 0 to −0.25, and the elliptical pore patterns in the simulation and experiment processes exhibit high similarity, which proves that the analytical value in the ZY direction can also effectively predict the actual compression process. When the compressive strain exceeds 0.2, the structures contact each other, making it impossible to continue the orthogonal elliptic transformation.
Figure 11. Deformation process of the P-NA structure during compression.
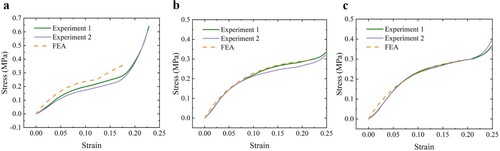
compares the simulation and experiment for the compression of the three structures. Several compression tests are conducted using the same sample to test the deformation recovery performance of the flexible resin material. In (a), (b) and (c), the two compression curves of the samples are similar, proving the excellent deformation recovery of the flexible resin. The samples can be applied cyclic loads without being damaged. When the structural strain exceeds 0.2, the internal contact of the structure causes a rapid increase in the stress value. In the comparison between the simulation and experiment, the simulated value is slightly larger than the experimental value in the 2D auxetic structure, and the curves of the two 3D auxetic structures (P-QA and P-NA) can match well. The simulation of the 3D case can reflect the experimental values, and the properties of the P-QA and P-NA structures are investigated next.
Figure 12. Stress-strain diagrams of varied auxetic structures: (a) 2D auxetic deformation structure, (b) P-QA structure, (c) P-NA structure.
4.2. Significant effect of deformation function on auxetic structure
Then, to qualitatively research the Poisson's ratio properties of the two structures P-QA and P-NA, nonlinear buckling analysis is used to study the Poisson's ratio during the deformation process, and the analysis results are verified by compression tests. Three structures with 4 × 4 × 4 units based on different dual-period deformation functions are designed and analyzed to explore the influence of different deformation functions on the Poisson’s ratios of structures during compression. For the three structures, the sine function (similar to ), sawtooth function (equivalent to
), and Bezier fitting function are used when
. In addition,
, and c = 0.7. Structures P-QA and P-NA are modelled and analyzed using the same parameters.
In , the values of Poisson's ratio curves are all below 0, indicating that the various deformation functions can achieve the 3D auxetic effect. When the sine function deforms structure P-QA, the value of Poisson’s ratio is around −0.2 during the entire compression process, and the value of Poisson’s ratio is stable. In addition, the values of Poisson’s ratio in different directions are relatively similar, and the numerical difference is within 0.1 ((a)). (b) and (c) indicate that when the sawtooth function and the Bezier fitting curve with are used for 3D deformation, the effect of the auxetic property is more evident than that in (a). In the ZX direction, Poisson’s ratio is maintained near −0.3. In the ZY direction, with the increase in strain, the value of Poisson’s ratio is reduced from −0.3 to −0.4 and −0.5. The Poisson’s ratio of the structure is unstable in the compression process, and its value in different directions is significant.
Figure 13. Poisson's ratio during compression of 3D auxetic structures: (a) structure P-QA with , (b) structure P-QA with
, (c) structure P-QA with
, (d) structure P-NA with
, (e) structure P-NA with
, and (f) structure P-NA with
.
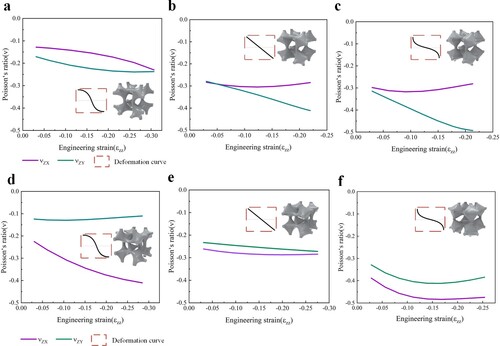
In (d), the deformation of the P-NA structure is based on a sine function. During the compression process, the difference between the values of Poisson’s ratio in the two directions is large. In the ZX direction, the Poisson’s ratio is as low as −0.4. In the ZY direction, the Poisson’s ratio fluctuates around −0.1, and the effect of the negative Poisson’s ratio is not apparent enough. When the structure is deformed based on the sawtooth function, the 3D auxetic effect is significantly improved during compression ((e)). (e) shows that the values of Poisson’s ratio in different directions are similar, and under the same strain, the difference in Poisson’s ratio between the two directions is within 0.03. When the strain increases from 0 to −0.25, the Poisson’s ratio in both directions is stable at around −0.25, which is close to a plateau. In (f), the structure is modelled based on the Bezier function (). Different directions exhibit the most obvious NPR effect, and the auxetic effects in different directions are close. After an initial strain (from 0 to −0.1), the value of Poisson’s ratio stabilises. The Poisson’s ratio in the ZX direction is maintained around −0.4, and the Poisson’s ratio in the ZY direction is maintained around −0.5. The Poisson’s ratios are relatively close, and the difference in the values of Poisson’s ratios between the two directions is between 0.05 and 0.1.
4.3. Shape and properties and of structure’s representative volume element
As shown in , in the 3D auxetic structure generated by the deformation algorithm, the 2 × 2 × 2 arrayed structure can be used as a representative volume element (RVE) of the overall structure.
Figure 14. Deformation results of structures with different values of control index of the Bezier fitting periodic function.
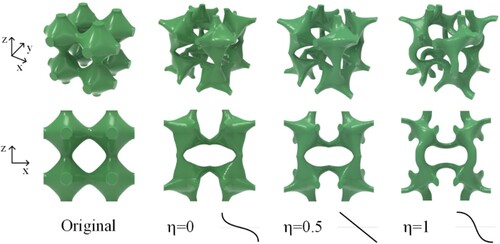
The effects of Bezier deformation functions with varied under large deformation are compared in . Relative to the original model, the volume of the structure is reduced, and the connections between the internal units are thinner. When
is small (
= 0,0.5), the model retains the morphological features well, but the surface has uneven areas and apparent creases in the connections. With the increase in
(
= 1), the original morphological characteristics are lost, but the surface of the model and the transition between units are smooth.
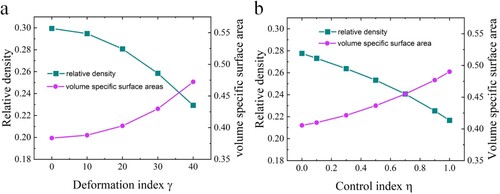
In (a), the deformation index increases from 0 to 40, the relative density decreases from 0.3–0.19, and the volume-specific surface area increases from 0.40–0.46. In (b), when the
values range from 0 to 1, the relative density decreases from 0.28–0.22, and the volume-specific surface area increases from 0.40–0.49. As
increases, the relative density of the structure decreases linearly, and the volume-specific surface area increases linearly. Similar conclusions can be obtained for
; as the
value increases, the relative density decreases linearly, and the specific surface area increases linearly. Then, the homogenisation analysis method (Steven Citation1997; Xie et al. Citation2013) is applied to explore the mechanical properties of the 3D auxetic structures P-QA and P-NA. In the following discussion, two kinds of structures with the same parameters are modelled.
Figure 15. Variation of the relative density and volume-specific surface area of structures with control parameters: (a) when the variable is deformation index and (b) when the variable is control index
.
In the series of figures in , the figures ((a), (b), (c), (g), (h)) reflect the mechanical properties of P-QA structure. In addition, the figures ((d), (e), (f)) reflect the mechanical properties of P-NA structure. The curves of the corresponding figures of the two structures P-QA and P-NA have relatively consistent trends and slopes, indicating that their mechanical properties have a high similarity. In a and d, deformation index is increased from −40 to 40 at interval 10, and parameters c = 0.7,
= 0.5. As
increases, the Poisson’s ratio decreases from 0.1 to −0.35, and the decrease is linear. When
is greater than 10, the structure exhibits the NPR property. When
is around 0, no obvious auxetic properties are observed. In terms of the strength of the structure, the relative elastic modulus decreases linearly as
increases. The strength is the highest when
is 0. When
increases to 40, the elastic modulus decreases to 1, and the strength is reduced to less than 1/10 of that of the original structure. In addition, elastic modulus has a correlation with the Poisson’s ratio of the structure, and the data (elastic modulus, Poisson’s ratio) are approximately symmetrical at
.
Figure 16. Mechanical properties of RVE: (a) relationship between and Poisson’s ratio
, relative elastic modulus E* of P-QA, (b) relationship between
and
, E* of P-QA, (c) relationship between
and
, E* of P-QA, (d) relationship between
and
, E* of P-NA, (e) relationship between
and
, E* of P-NA, (f) relationship between
and
, E* of P-NA, (g) polar diagram of
of P-QA, (h) polar representation of E* of P-QA.
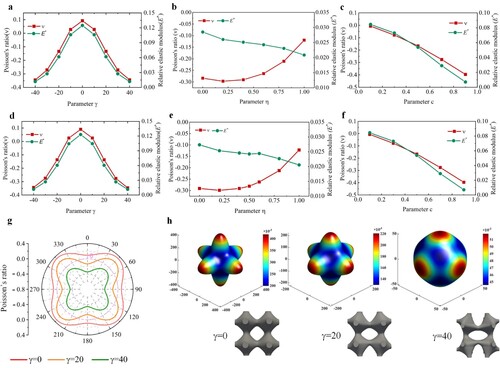
During the modelling process, c = 0.7, , and the control index
of the Bezier period fitting function is increased from 0 to 1. As shown in (b), the Poisson’s ratio of the structure is maintained at around −0.30 with
in the range of 0–0.5. When
increases from 0.5–1, the Poisson’s ratio increases abruptly, and the auxetic effect decreases rapidly. In addition, the increase in η reduces the volume of the structure, which results in a decrease in the relative elastic modulus. The variation effect of η on the relative elasticity modulus is insignificant, with only 20% of the relative elastic modulus changing throughout the variation of η. Similar conclusions can be drawn from the (e) for P-NA structure. (c) and (f) indicate that as c increases from 0.1–0.9, the Poisson’s ratio changes considerably from 0 to −0.4. Decreasing c can weaken the auxetic effect, and increasing c can enhance the auxetic effect. The structural strength also decreases linearly with increasing c.
The strength and Poisson's ratio of the structure in different directions is studied with the assistance of the homogenisation method. The figures of Poisson's ratio distribution and polar representation of the normalised elastic modulus of the structure are plotted (Wang et al. Citation2020; Li et al. Citation2022). The Poisson’s ratios in different directions of the structure on the same section plane are plotted in (d) (about P-QA structure). The Poisson’s ratio of the structure is small when it is close to the axial direction, and the auxetic effect is highly obvious. When it is far from the axial direction, the Poisson’s ratio is enlarged. As the deformation index increases, more directions fall within the NPR region. In particular, in the curve with
, all directions are in the region of NPR, indicating that all directions can achieve the property of NPR. As shown in (e), when
increases, the axial strength decreases, and the structure tends to be isotropic.
4.4. Mapping of structural properties and parameters
To generate reliable lattice bone implants for various applications, the structure needs properties similar to those of natural bone. Different from the fixed physical properties of traditional materials, the mechanical properties of porous materials vary with different parameters, and the acquisition of mechanical properties via finite element simulation is time-consuming. In this study, the relationship between the mechanical properties (elastic modulus and Poisson’s ratio) and geometric parameters of the structure is obtained based on the experimental data. As discussed, the c value and deformation index exert the most significant effects on the structural properties. When the dual-period deformation function with
is used, the 3D auxetic performance of the structure is improved. Therefore, to summarise the general control law of the resulting mechanical properties, modelling and simulation of different parameter models are carried out by controlling the c value and deformation index
.
With regard to the P-QA structure, the relationship between relative elastic modulus and parameters and c is presented in (a). The relationship can be expressed as.
(16)
(16) The Poisson’s ratio of the structure in different directions is obtained through 20 groups of compression simulation experiments. The fitted surface of Poisson’s ratio on ZX and ZY planes is shown in (c). At 10% compressive strain, the Poisson’s ratio-fitted surfaces approximate each other. The relationship between Poisson’s ratio and parameters
and c can be seen in (b). The relationship can be expressed as
(17)
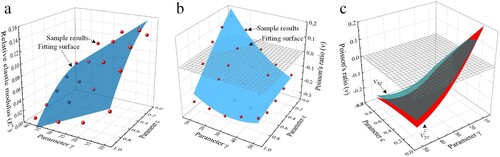
(17) With regard to the P-NA structure, the relationship between the relative elastic modulus and parameters
and c can be seen in (a). The relationship can be expressed as.
(18)
(18) The relationship between Poisson’s ratio and parameters
and c can be seen in (b). The relationship can be expressed as
(19)
(19) In different applications, such as bone implants, according to the required structural strength and Poisson’s ratio, the two variables of the structure P-QA can be solved by simultaneously using Eqs. (16) and (17). Then, the 3D auxetic structure with the designated mechanical properties can be obtained through the implicit expression. Likewise, by combining Eqs. (18) and (19), the design parameters of the structure P-NA can be obtained.
Figure 17. Relationship between mechanical properties and parameters in structure P-QA: (a) analysis results of relative elastic modulus and fitting surface, (b) analysis results and fitting surface of the Poisson’s ratio of the structure at 10% strain, and (c) comparison of the fitting surfaces of the Poisson’s ratio of the structure in ZX and ZY directions.
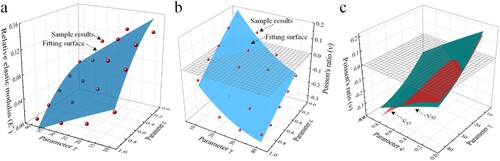
Figure 18. Relationship between mechanical properties and parameters in structure P-NA: (a) analysis results of relative elastic modulus and fitting surface, (b) analysis results and fitting surface of the Poisson’s ratio of the structure at 10% strain, and (c) comparison of the fitting surfaces of the Poisson’s ratio of the structure in ZX and ZY directions.
5. Application
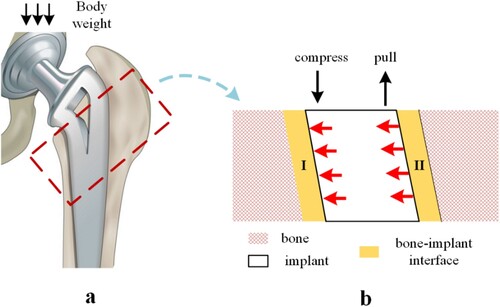
Hip implantation is a mature medical implantation technology. In (a), the bone-implant is required to fit tightly to the human bone after the hip joint is implanted into the human bone. The bone-implant interface can be formed between the bone and the implant, easily damaged under tension but can withstand immense pressure. After the hip joint is implanted into the human body, the implant is subjected to forces from the human body, and the implant is deformed by lateral pressure. To study the implantation properties of the implant, a typical area of bone and implant is selected. The cross-section is shown in (b), the left half of the implant is in compression and the right half is in tension. Most metal and porous structures as bone implant materials exhibit positive Poisson's ratio (Bai et al. Citation2019). When the implant is placed, the bone-implant interface Ⅰ will be in compression and the bone-implant interface II will be in tension. The tendency of the bone to separate from the implant in the interface II is highly susceptible to implant failure.
Figure 19. Hip stem implantation: (a) implant and bone assembly, (b) local enlargement of hip joint stem deformation.
5.1. Heterostructure design methods
The hybrid lattice structure has been selected for the design of hip stems, which has been demonstrated to improve implant–bone contact of hip stems (Kolken et al. Citation2018). The hybrid lattice with negative and positive Poisson’s ratio parts can create compression on either side of the implant, decreasing the chance of bone–implant interface failure, and improving implant fixation by mechanically stimulating bone growth. However, there are challenges in the lattice design with many units, and it is not easy to effectively control the lattice's strength. In this work, TPMS is applied to the hip stem design to take full advantage of its parametric control advantages ((a)). A heterostructure based on TPMS is proposed in this work to allow the structure to expand outward under stress and increase the bone–implant contact.
Figure 20. The design method of heterostructure with positive and negative Poisson’s ratio in the hip stem: (a) the hip stem with heterostructure, (b) the sigmoid function with structure G and P-QA, (c) cross-sectional deformation of heterostructure, and (d) the result of the heterostructure.
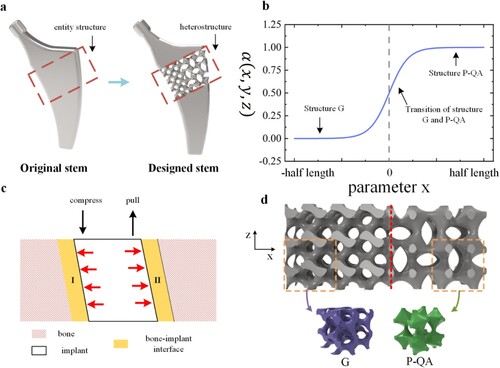
In the design of the heterostructure, the sigmoid function (Yang et al. Citation2014; Maskery et al. Citation2018) is used to combine structure G and structure P-QA according to the specified boundaries ((b)). The fusion transition algorithm is implemented using the sigmoid function method as follows:
(20)
(20)
(21)
(21) The parameter k (
) can be used to change the transition gradient,
is the transition boundary where the two structures fuse. In this work, as shown in (b), let
, and
, the structure G is a typical PPR structure generated by EquationEq. (2)
(2)
(2) , and it is named U1. The structure P-QA is selected as the 3D NPR structure part and is named U2.
The structure G is designed with a relative density of 0.24, and its strength and Poisson’s ratio are obtained through FEA. To match the strength and Poisson ratio of the G structure, the structural design parameters of P-QA are obtained with Eqs. (16) and (17). As shown in (d), in the heterogeneous TPMS structure, one side is a 3D auxetic structure, and the other side is a structure with a positive Poisson’s ratio. Using the fusion transition algorithm SF method, the two structures transition at the centre of the stem. The size of the heterostructure is 50 mm × 14 mm × 21 mm.
In the designed heterostructure, as seen in (c), the left side is a PPR structure, and bone-implant interface I is compressed under compression; the right side of the heterostructure is an NPR structure, and the bone-implant interface II is also compressed under tension. The combination of PPR and NPR structures allows the hip joint with heterostructure to avoid bone–implant separation and reduce debris entry into voids.
5.2. Improved performance of implant
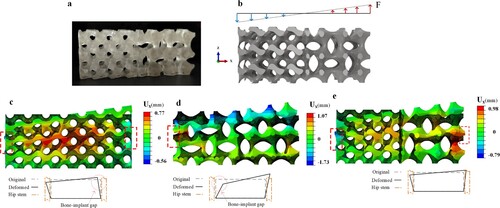
The heterostructure is analyzed and manufactured based on the structure obtained in Section 4.1. As shown in (a), the heterostructure sample is manufactured by the DLP method. In addition, the FEA is performed to simulate the force of the heterostructure in the hip joint stem. As a comparison, a PPR structure based on G surface with a similar density is designed and analyzed.
In (b), by simulating the typical forces of the target structure in the hip stem, gradient strain is applied to the structures for mechanical analysis. The deformation result of the G structure is shown in (c), on the right side, the structure shrinks inward during deformation, which will lead to the failure of the bone-implant interface. In (d), a similar case of structural contraction will occur on the left side of the structure, causing failure of the bone-implant interface. As for the heterostructure shown in (e), on the left side of the structure, the structure expands on the left side, and on the right side of the structure, the structure expands on the right side. When a graded strain is applied, deformation occurs on different sides of the heterogeneous structure that extends outward. Benefiting from the unique deformation characteristics of the heterostructure, after applying the structure to the design of the hip stem, the heterostructure will press onto the bone on both the medial and lateral sides under biomechanical loading. The heterostructure's unique deformation will improve the hip joint's reliability and extend implant longevity.
Figure 21. The properties of the heterostructure: (a) printed sample of the structure, (b) stress condition of the structure, (c) FEA results of the P-QA structure, (d) FEA results of the G structure, and (e) FEA results of the heterostructure.
6. Conclusion
In this study, a controllable, dual-period deformation function is obtained using the Bezier curve fitting method, and the 3D deformation equation of TPMS is proposed. Two kinds of 3D auxetic deformation structure design methods (P-QA and P-NA) based on the P surface are realised using the 3D deformation equation. The effects of the c value of TPMS, periodic function , and deformation index
on the shape and properties of the structure are studied. The primary conclusions are summarised as follows:
In terms of shape control, the volume-specific surface area of the structures increases with deformation index
Through FEA and experimental verification, it is proved that the structural design methods proposed in this paper can effectively realise the 3D NPR property of the structure. Changing the two-periodic deformation function can significantly affect the auxetic effect. The structures obtained by applying the deformation method to the sawtooth function can achieve more effective 3D NPR effects than the triangular function.
Using Bezier functions, the basic deformation functions, such as the trigonometric function, are successfully extended to general periodic functions with adjustable curvature, and the 3D auxetic effect of the structure is effectively improved.
The mechanical properties of the auxetic structure can be effectively controlled by adjusting different control parameters (c value, periodic function
Discrete modelling and analysis are performed for the two structures (P-QA and P-NA). The mapping relationship between the strength of the structure and the structural parameters and the mapping relationship between the Poisson’s ratio and the structural parameters are obtained, which will behave as a guide to design.
The heterostructure fused with positive and negative Poisson’s ratio structures is applied to the design of the hip joint, which is based on P and G surfaces. Under bending load, the structure expands on different sides, the gap between the bone and the implant is effectively controlled, and the area under tensile stress is reduced, thereby preventing implant failure.
Disclosure statement
No potential conflict of interest was reported by the author(s).
Additional information
Funding
Notes on contributors
Bo Liu
Bo Liu is a Ph.D. candidate in the School of Mechanical Engineering at Zhejiang University. His main research interests include porous structure and additive manufacturing.
Jiawei Feng
Jiawei Feng is a postdoctoral fellow in School of mechanical engineering, Zhejiang University, China. His research interests focus on TPMS and additive manufacturing.
Zhiwei Lin
Zhiwei Lin is an assistant researcher in School of Mechanical Engineering at Zhejiang University. His main research interests include intelligent manufacturing and CAM.
Yong He
Yong He is a full professor of the School of Mechanical Engineering at Zhejiang University. He also serves as the deputy director of Zhejiang Province's Key Laboratory of 3D Printing Process and Equipment. His research interests include additive manufacturing, biomanufacturing, medical apparatus and instruments.
Jianzhong Fu
Jianzhong Fu is a full professor of the School of Mechanical Engineering at Zhejiang University, and head of the Institute of Manufacturing Technology and Automation. He is also the director of the Key Laboratory of 3D Printing Process and Equipment of Zhejiang Province, Hangzhou, China. His research interests center around additive manufacturing, intelligent manufacturing, and intelligent CAD/CAM/CNC.
References
- Abu-Amer, Y., I. Darwech, and J. C. Clohisy. 2007. "Aseptic Loosening of Total Joint Replacements: Mechanisms Underlying Osteolysis and Potential Therapies." Arthritis Research and Therapy 9. doi:10.1186/ar2170.
- Alomarah, Amer, Syed H. Masood, Igor Sbarski, Batool Faisal, Zhanyuan Gao, and Dong Ruan. 2020. “Compressive Properties of 3D Printed Auxetic Structures: Experimental and Numerical Studies.” Virtual and Physical Prototyping 15 (1): 1–21. doi:10.1080/17452759.2019.1644184.
- Babaee, Sahab, Jongmin Shim, James C. Weaver, Elizabeth R. Chen, Nikita Patel, and Katia Bertoldi. 2013. “3D Soft Metamaterials with Negative Poisson’s Ratio.” Advanced Materials 25 (36): 5044–5049. doi:10.1002/adma.201301986.
- Bai, L., C. Gong, X. Chen, Y. Sun, J. Zhang, L. Cai, S. Zhu, and S. Q. Xie. 2019. “Additive Manufacturing of Customized Metallic Orthopedic Implants: Materials, Structures, and Surface Modifications.” Metals 9: 1004. doi:10.3390/met9091004.
- Barba, D., E. Alabort, and R. C. Reed. 2019. “Synthetic Bone: Design by Additive Manufacturing.” Acta Biomaterialia 97: 637–656. doi:10.1016/j.actbio.2019.07.049.
- Bertoldi, Katia, Pedro M. Reis, Stephen Willshaw, and Tom Mullin. 2010. “Negative Poisson’s Ratio Behavior Induced by an Elastic Instability.” Advanced Materials 22 (3): 361–366. doi:10.1002/adma.200901956.
- Feng, Jiawei, Jianzhong Fu, Xinhua Yao, and Yong He. 2022. “Triply Periodic Minimal Surface (TPMS) Porous Structures: From Multi-Scale Design, Precise Additive Manufacturing to Multidisciplinary Applications.” International Journal of Extreme Manufacturing 4 (2). doi:10.1088/2631-7990/ac5be6.
- Gao, Jie, Huipeng Xue, Liang Gao, and Zhen Luo. 2019. “Topology Optimization for Auxetic Metamaterials Based on Isogeometric Analysis.” Computer Methods in Applied Mechanics and Engineering 352: 211–236. doi:10.1016/j.cma.2019.04.021.
- George, Subin P, and Gurunathan Saravana Kumar. 2013. “Patient Specific Parametric Geometric Modelling and Finite Element Analysis of Cementless Hip Prosthesis.” Virtual and Physical Prototyping 8 (1): 65–83. doi:10.1080/17452759.2012.755654.
- Gorgin Karaji, Zahra, M. Speirs, S. Dadbakhsh, J. P. Kruth, H. Weinans, A. A. Zadpoor, and S. Amin Yavari. 2017. “Additively Manufactured and Surface Biofunctionalized Porous Nitinol.” ACS Applied Materials & Interfaces 9 (2): 1293–1304. doi:10.1021/acsami.6b14026.
- Kaur, Inderjot, and Prashant Singh. 2021. “Flow and Thermal Transport Characteristics of Triply-Periodic Minimal Surface (TPMS)-Based Gyroid and Schwarz-P Cellular Materials.” Numerical Heat Transfer, Part A: Applications 79 (8): 553–569. doi:10.1080/10407782.2021.1872260.
- Kolken, Helena M. A., Shahram Janbaz, Sander M. A. Leeflang, Karel Lietaert, Harrie H. Weinans, and Amir A. Zadpoor. 2018. “Rationally Designed Meta-Implants: A Combination of Auxetic and Conventional Meta-Biomaterials.” Materials Horizons 5 (1): 28–35. doi:10.1039/C7MH00699C
- Kladovasilakis, Nikolaos, Konstantinos Tsongas, and Dimitrios Tzetzis. 2020. “Finite Element Analysis of Orthopedic Hip Implant with Functionally Graded Bioinspired Lattice Structures.” Biomimetics 5 (3). doi:10.1039/C6RA27333E.
- Kolken, Helena M.A., Shahram Janbaz, Sander M.A. Leeflang, Karel Lietaert, Harrie H. Weinans, and Amir A. Zadpoor. 2018. “Rationally Designed Meta-Implants: A Combination of Auxetic and Conventional Meta-Biomaterials.” Materials Horizons 5 (1): 28–35. doi:10.1039/C7MH00699C.
- Kolken, Zadpoor. 2017. “Auxetic Mechanical Metamaterials.” RSC Advances 7 (9): 5111–5129. doi:10.1039/C6RA27333E.
- Lakes, Roderic. 1987. “Foam Structures with a Negative Poisson’s Ratio.” Science 235 (4792): 1038–1040. doi:10.1126/science.235.4792.1038.
- Li, Zhendong, Xinwei Li, Zhonggang Wang, and Wei Zhai. 2023. "Multifunctional sound-absorbing and mechanical metamaterials via a decoupled mechanism design approach." Materials Horizons 10 (1): 75–87. doi:10.1039/D2MH00977C.
- Liu, Bo, Jiawei Feng, Kang Yu, Jiongqi Li, Qirui Hu, Zhiwei Lin, and Jianzhong Fu. 2022. “Three-Dimensional Auxetic Structure Design Methods Based on Bulking-Induced Deformation and the Application in Soft Crawling Robot.” Composites Part B: Engineering 244: 110146. doi:10.1016/j.compositesb.2022.110146.
- Liu, Jiapeng, Xinhua Yao, Zhenwei Wang, Jian Ye, Congcong Luan, Jianzhong Fu, and Yong He. 2021. “A Novel Wavy Non-Uniform Ligament Chiral Stent with J-Shaped Stress–Strain Behavior to Mimic the Native Trachea.” Bio-Design and Manufacturing 4 (4): 851–866. doi:10.1007/s42242-021-00159-y.
- Lorensen, William E., and Harvey E. Cline. 1987. “Marching Cubes: A High Resolution 3D Surface Construction Algorithm.” Proceedings of the 14th Annual Conference on Computer Graphics and Interactive Techniques, SIGGRAPH 1987 21 (4): 163–169. doi:10.1145/37401.37422.
- Maskery, I., A. O. Aremu, L. Parry, R. D. Wildman, C. J. Tuck, and I. A. Ashcroft. 2018. “Effective Design and Simulation of Surface-Based Lattice Structures Featuring Volume Fraction and Cell Type Grading.” Materials & Design 155: 220–232. doi:10.1016/j.matdes.2018.05.058.
- Piegl, Les, and Wayne Tiller. 1996. The NURBS book. Springer Science & Business Media.
- Pivec, Robert, Aaron J. Johnson, Simon C. Mears, and Michael A. Mont. 2012. “Hip Arthroplasty.” The Lancet 380 (9855): 1768–1777. doi:10.1016/S0140-6736(12)60607-2.
- Ren, Xin, Raj Das, Phuong Tran, Tuan Duc Ngo, and Yi Min Xie. 2018. “Auxetic Metamaterials and Structures: A Review.” Smart Materials and Structures 27 (2): 23001. doi:10.1088/1361-665X/aaa61c.
- Schmalzried, T. P., E. F. Shepherd, F. J. Dorey, W. O. Jackson, M. dela Rosa, H. A. McKellop, C. D. McClung, J. Martell, J. R. Moreland, and H. C. Amstutz. 2000. “Wear Is a Function of Use, Not Time.” Clinical Orthopaedics and Related Research 381 (381): 36–46.
- Soyarslan, C., Vincent Blümer, and Swantje Bargmann. 2019. “Tunable Auxeticity and Elastomechanical Symmetry in a Class of Very Low Density Core-Shell Cubic Crystals.” Acta Materialia 177: 280–292. doi:10.1016/j.actamat.2019.07.015.
- Steven, Grant P. 1997. “Homogenization of Multicomponent Composite Orthotropic Materials Using Fea.” Communications in Numerical Methods in Engineering 13 (7): 517–531. doi:10.1002/(SICI)1099-0887(199707)13:7<517::AID-CNM74>3.0.CO;2-L.
- Verdonschot, Nico, and Rik Huiskes. 1996. “Subsidence of THA Stems Due to Acrylic Cement Creep Is Extremely Sensitive to Interface Friction.” Journal of Biomechanics 29 (12): 1569–1575. doi:10.1016/S0021-9290(96)80008-X.
- Wang, Yingjun, Sajad Arabnejad, Michael Tanzer, and Damiano Pasini. 2018. “Hip Implant Design with Three-Dimensional Porous Architecture of Optimized Graded Density.” Journal of Mechanical Design, Transactions of the ASME 140 (11): 1–13. doi:10.1115/1.4041208.
- Wang, Qingsong, Zihan Li, Yao Zhang, Shaokang Cui, Zhenyu Yang, and Zixing Lu. 2020. "Ultra-Low Density Architectured Metamaterial with Superior Mechanical Properties and Energy Absorption Capability." Composites Part B: Engineering 202: 108379. doi:10.1016/j.compositesb.2020.108379.
- Wang, Zhonggang, Xinxin Wang, Tianyu Gao, and Chong Shi. 2021. “Mechanical Behavior and Deformation Mechanism of Triply Periodic Minimal Surface Sheet Under Compressive Loading.” Mechanics of Advanced Materials and Structures 28 (19): 2057–2069. doi:10.1080/15376494.2020.1829756.
- Xie, Yi Min, Zhi Hao Zuo, Xiaodong Huang, and Xiaoying Yang. 2013. “Predicting the Effective Stiffness of Cellular and Composite Materials with Self-Similar Hierarchical Microstructures.” Journal of Mechanics of Materials and Structures 8 (5–7): 341–357. doi:10.2140/jomms.2013.8.341.
- Yang, Nan, Zhi Quan, Dawei Zhang, and Yanling Tian. 2014. “Multi-Morphology Transition Hybridization CAD Design of Minimal Surface Porous Structures for Use in Tissue Engineering.” Computer-Aided Design 56: 11–21. doi:10.1016/j.cad.2014.06.006.
- Zhang, Jianjun, Guoxing Lu, and Zhong You. 2020. “Large Deformation and Energy Absorption of Additively Manufactured Auxetic Materials and Structures: A Review.” Composites Part B: Engineering 201: 108340. doi: 10.1016/j.compositesb.2020.108340.
- Zhang, Xiang Yu, Xin Ren, Xin Yuan Wang, Yi Zhang, and Yi Min Xie. 2021. "A Novel Combined Auxetic Tubular Structure with Enhanced Tunable Stiffness." Composites Part B: Engineering 226: 109303. doi:10.1016/j.compositesb.2021.109303.
- Zheng, Xiaoyang, Xiaofeng Guo, and Ikumu Watanabe. 2021. “A Mathematically Defined 3D Auxetic Metamaterial with Tunable Mechanical and Conduction Properties.” Materials & Design 198: 109313. doi:10.1016/j.matdes.2020.109313.
