
 ?Mathematical formulae have been encoded as MathML and are displayed in this HTML version using MathJax in order to improve their display. Uncheck the box to turn MathJax off. This feature requires Javascript. Click on a formula to zoom.
ABSTRACT
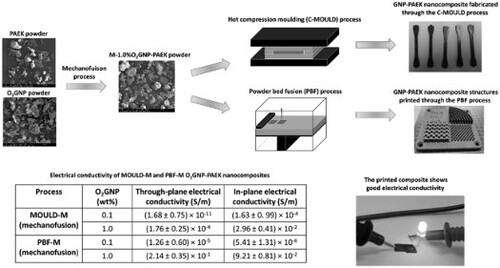
Achieving good dispersion of graphene (GNP), in polyetheretherketone (PEEK), is challenging due to the high melt viscosity, solvent resistance and processing temperature of PEEK. In addition, certain manufacturing processes tend to enhance the anisotropy due to GNP orientation within the structure. This study investigated the fabrication of nanocomposite parts through hot compression moulding (C-MOULD) and powder bed fusion (PBF) processes, using powder with GNPs fused to the surface of polymeric particles, through a process called mechanofusion. The method applies mechanical forces of compression, shear and impact to generate a mechanical bond between materials, in this case, O2 functionalised GNP and a developmental polyaryletherketones (PAEK) grade powder. The novelty of this work is in the combination of processes used for manufacturing (material preparation and actual manufacturing processes), which are scalable and efficient in comparison with existing methods (such as solvent mixing or melt-compounding). The mechanofusion GNP-PAEK composite powders were successfully printed for the first time using the EOS P800 system with notable improvements in electrical and mechanical properties. This study highlights that the mechanofusion process could be used as an efficient process for making multifunctional nanocomposite materials and this can be combined with additive manufacturing (AM) processes to produce complex components.
GRAPHICAL ABSTRACT
1. Introduction
Polyetheretherketone (PEEK) is a high-temperature engineering polymer, that has outstanding mechanical properties, excellent thermal stability and high resistance to solvent and wear [Citation1,Citation2]. Graphene nanoplatelets (GNPs) used as a nanofiller have drawn great attention due to their remarkable electronic, thermal and mechanical properties [Citation3–5]. In many studies, the GNPs or CNTs are used to create structures with enhanced mechanical, electrical, and thermal properties. Although both materials can lead to enhanced performance in the final part, it has been acknowledged [Citation6,Citation7] that the scaled up methods of fabrication of GNPs are cheaper than those used for CNTs. Moreover, the larger aspect ratio and surface area of GNPs is expected to lead to better filler–matrix interactions than CNT [Citation7,Citation8]. Incorporating graphene into PEEK is a promising route into new advanced applications due to the combination of properties offered by the two materials. The nanocomposite could be used as lightweight heating devices, de-icing materials in aerospace and civil engineering, conductive plastics for satellite parts, and submarine pipelines [Citation9]. Graphene has also been found to be useful in improving tribological properties such as wear properties in PEEK material [Citation10,Citation11] and can promote bone osseointegration and bone regeneration [Citation12].
In order to impart these characteristics to the bulk of the polymeric structure, ensuring uniform dispersion of the GNP in the matrix is a crucial but challenging step [Citation3]. Dispersion of nanoparticles in PEEK polymers is more challenging compared to other polymers due to its high processing temperatures, lack of solubility in any solvents, and high melt viscosities [Citation13]. Although the dry blending method is the most cost-effective way to obtain nanocomposite powders [Citation3,Citation14], the process tends to lead to agglomeration and poor dispersion of nanomaterials [Citation3]. In addition, the process of dry mixing with nanomaterials raises health and safety concerns [Citation3], especially at the quantity levels required for powder bed fusion (PBF) and hot compression moulding. Wet mixing is another common method used to prepare nanocomposite materials. GNP and PEEK powders are dispersed (rather than dissolved) in a large quantity of solvent such as ethanol and then dried to achieve a composite material [Citation4,Citation10,Citation14,Citation15]. However, the use of a large quantity of solvent sometimes becomes problematic in an industrial setting, being difficult to scale up or to recycle, and increasing production costs [Citation11,Citation16]. Many industries, use melt-compounding as an alternative way to introduce fillers into a polymer matrix [Citation11,Citation13,Citation17]. However, it is challenging to prepare uniformly dispersed GNP-PEEK composites because of the high melt viscosity of PEEK and their low interfacial affinity for GNP which causes aggregation by van der Waals forces [Citation11,Citation16]. The formation of voids has been observed after melt-compounding, affecting thermal, electrical and mechanical properties [Citation11,Citation13]. Chen et al. [Citation3] reported a different method to obtain GNP-PEEK nanocomposite powders based on a core–shell structure, where GNP dispersed in polyetherimide (PEI) was used as a shell on the surface of a PEEK core particle. The authors did not discuss the scalability of such a process and the implication of the solvent use, its recovery and reuse. A large-scale production and easy manufacturing method to produce GNP-PEEK nanocomposites is needed to allow further exploration of the combination of properties offered by the PEEK grades and GNP.
Additive manufacturing (AM) of PEEK has gained prominence amongst the processing techniques as it offers the flexibility needed to make parts with complex and customised designs. Between powder bed fusion (PBF) and material extrusion (MEX), the two most used AM methods for the fabrication of PEEK and PEEK composite base parts, MEX has received significantly more attention [Citation18–21]. There are several studies which explored the fabrication of PEEK nanocomposites with GNP or CNT in material extrusion (MEX). Berretta et al. [Citation22] fabricated PEEK nanocomposite filaments with 1 and 5 wt% CNT through a twin-screw extruder and concentrated mostly on examining the mechanical performance of the printed composite. Gonçalves et al. [Citation21] produced electrically conductive PEEK nanocomposite filaments reinforced with 4 wt% MWCNT and 3 wt% GNP. The electrical conductivity of the filament was 10.68 S/m. However, the MEX-printed parts showed much lower conductivity than the filament (×10−4 S/m) which may be due to the pores and re-agglomeration of the carbon nanoparticles during printing. Arif et al. [Citation20] MEX printed GNP-PEEK and CNT-PEEK nanocomposites using extruded filaments. Although the filaments were printable and the composites with 3 and 5 wt% of GNP were more ductile compared to the printed neat PEEK, achieving high electrical conductivity on PEEK nanocomposites through the MEX process is very challenging due to the pores generated during printing the layers.
In the case of the powder bed fusion (PBF) process, only a few studies used PEEK nanocomposites. Wang et al. [Citation23] used a thermally induced phase separation (TIPS) method to produce CNT-PEEK composite powders. The powders were successfully printed to single-layer sheet materials, but the mechanical and other properties of the printed sheet were not fully assessed. TIPS has been used before with other polymers, and it is a known method [Citation24] for making polymeric blends and composite powders but it is energy intensive, requires the use of solvents and its scalability has not yet been proven. To the best of the authors’ knowledge, there is no large-scale method currently available for making GNP-PEEK nanocomposite powders for the PBF process. Mechanofusion is a manufacturing technique for producing high-performance composite particles and offers a potential solution. It involves powerful shearing with compaction and compressive forces, using a high-shear processor to facilitate dry particle-to-particle fusion [Citation32]. You et al. [Citation25] used the mechanofusion process to produce polyketone (PK)-graphite nanoplatelet composite materials for hot-press moulding. The parts produced showed a notable high electrical conductivity value of 37 S/cm at the GNP loading of 10 wt%. PEEK/hydroxyapatite (HA)/carbon fibre (CF) composite has been made by the mechanofusion and injection moulding processes in Jeon et al.’s work [Citation26]. The composites exhibited higher flexural and compressive strengths than the composite prepared by solvent mixing in ethanol due to the enhanced dispersibility of HA nanofiller. Thus, the mechanofusion method shows promise in addressing the gap in fabrication of GNP-PEEK nanocomposites for industrial manufacturing.
Recently, a new backbone-modified polyaryletherketone (PAEK) grade powder, with a lower melting temperature compared to traditional PEEK materials, has been introduced as a novel material with the optimised crystallisation kinetics for the PBF process [Citation27]. This material has been used throughout this study and a solvent-free method, mechanofusion, was applied to produce GNP-PAEK nanocomposite materials based on the mechanofusion process, which forms composite particles by applying powerful shearing, compaction and compressive forces using a high-shear processor [Citation28]. The high rotor speed and space between the rotor tip and vessel wall provide compression and shear forces that mix powders uniformly. Our results show that GNPs were uniformly fused to PAEK particles via this high-shear mechanochemical fusion to form GNP-PAEK composite powders. In comparison with compression moulding or other pressure-driven manufacturing processes, the PBF process does not involve a high level of pressure and therefore it allows the GNPs present on the surface of PAEK particles to maintain their orientation and achieve a high level of isotropy, desirable in 3D complex structures. The enhanced electrical and mechanical properties achieved at 0.1% wt were associated with the uniform dispersion of nanofillers on the polymeric particles as shown by the micro-CT data.
2. Experimental
2.1. Materials
A developmental PAEK powder grade was provided by Victrex (Victrex, UK). The new PAEK grade is an aromatic PEEK-based poly aryl ether ketone copolymer. The molecular structure has been designed to improve the rheological and crystallisation characteristics. The properties are listed in .
Table 1. Material properties of the PAEK grade.
A grade of GNP named GNP-HP was provided by 2-DTech (2-DTech., UK). GNP-HP is a multi-layer graphene powder. The lateral dimension is less than 26.5 µm and 73% of the powder is less than 10 layers [Citation29]. The GNP-HP was functionalised with oxygen to improve the dispersion and compatibility using the Haydale HDPlas plasma process (Haydale, UK). To create plasma-functionalised nanomaterials, a process gas was introduced into a rotating vacuum chamber. An electrical potential was applied, and the gas was dissociated into its component parts. The dissociated ions from the process gas bombard the nanomaterial, producing chemical groups covalently bonded to the nanomaterial surface.
2.2. Nanocomposite powder preparation
Two methods, mechanofusion and dry blending, were used in this work. For dry blending, O2-GNP powders (oxygen functionalised GNP) at 0.1, 0.5, 1.0 and 5.0 wt%, respectively and PAEK powder were mixed by a laboratory blender MIXOMAT mini (Fuchs, Switzerlad) for 2 h. For the mechanofusion process, O2-GNP powders at similar concentrations 0.1, 0.5, 1.0 and 5.0 wt%, respectively and PAEK powders were mixed in a high-speed mixing equipment Nobilta-AMS mini (Hosokawa Micron Corp., Japan) at a speed of 4000 rpm for 20 min. The system is equipped with a water-cooling jacket to prevent significant increases in temperature and degradation of the powders. illustrates the principle of the mechanofusion process. The combination of compression, shear and impact forces are applied to the mix of PAEK particles and GNPs ensuring GNP particles evenly coat the PAEK powders without a binder. All composite powders are listed in .
Figure 1. The principle of the mechanofusion process: impact, compression and shear forces are applied to GNP and PAEK particles. The type of head as well as the gap between the blade and vessel determine the level of shaping of the polymeric particles and coating of the PAEK particles with GNPs.
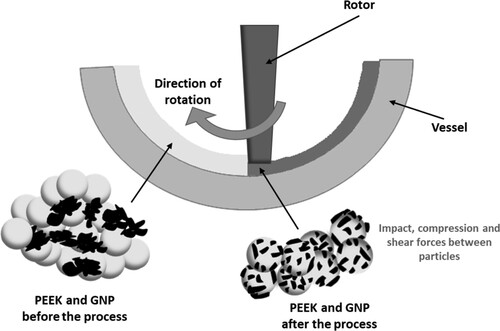
Table 2. O2-GNP and PAEK composite powder prepared by mechanofusion and dry blending.
2.3. Nanocomposite fabrication
2.3.1. PAEK-GNP composite fabricated by hot compression moulding (C-MOULD)
Composite plates with two different dimensions of 150 × 150 × 0.5 and 150 × 150 × 2 mm, were prepared through hot compression moulding using a Hydraulic Press Standard LP-S-50 [Citation30], for each powder. All hot compression moulded composite samples are referred to in the study as C-MOULD samples. The composite powders were placed in the mould and pre-heated in the hot compression machine at 350°C for 5 min, then a pressure of 15 tones was applied for 10 min. The hot press was then cooled down to room temperature under a natural cooling regime with the same pressure applied. Tensile samples were cut out of the manufactured panels (details under the details under the Tensile test section 2.4.4).
2.3.2. PAEK-GNP composite fabricated by the powder bed fusion (PBF) process
M-0.1%O2GNP-PAEK and M-1.0%O2GNP-PAEK were selected for the PBF process of GNP composites in this study. All the printed composite samples were named PBF samples. In order to improve the flowability prior to the laser sintering process [Citation31], the composite powders were heat treated at 200°C (T200) for 24 h in an air-ventilated oven and then cooled down to room temperature naturally. After the heat treatment, the powders were sieved twice using mesh sizes of 170 and 400 (size between 38 and 90 μm left and used) to narrow the particle size distribution (PSD) (T200-seived).
The PBF process was carried out using the EOS P800 high-temperature laser sintering system. The PBF specimens were produced in the reduced building configuration (one-third of the maximum volume) as shown in previous studies [Citation31]. Composite specimens were printed in X–Y orientation at different laser powers from 10.5 to 18 W with a scan speed of 2550 mm/s and a hatching distance of 0.25 mm. The building platform temperature and the process chamber temperature were set at 260°C and 289°C, separately. The energy density (ED) 0.029 (J/mm2) was selected for the tests.
2.4. Sample characterisation
2.4.1. SEM (scanning electron microscopy)
SEM images were obtained using an FEI Nova Nanolab 600 SEM (FEI, USA) at an acceleration voltage of 10 kV. Powders were spread on conductive carbon tape and fractured samples were also mounted on a sample holder by conductive carbon tape. All the samples were Cr sputter-coated with a thickness of 15 nm.
2.4.2. Powder rheology
Powder flow properties were characterised by a Freeman FT-4 powder rheometer (Freeman Technology, UK). Basic flowability energy (BFE), conditioned bulk density (CBD), stability index (SI), specific energy (SE), and flow rate index (FRI) were measured from standard methodologies including stability and variable flow rate tests. Compressibility (CPS) was measured from compressibility tests and pressure drop (PD) was measured from permeability tests. Aerated energy (AE), aeration ratio (AR) and normalised aeration sensitivity (NAS) were measured from aeration tests. Details of the powder rheology tests have been provided in a previous study [Citation32].
2.4.3. Nanoparticle exposure test
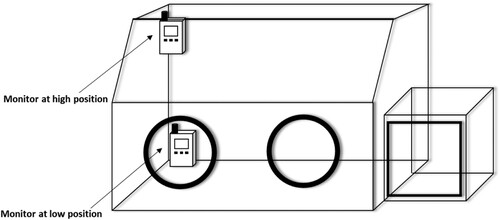
A Naneos Paratector 2 Aerosol Dosimeter (Naneos Particle Solutions GmbH) was used to monitor the exposure of GNPs and nanocomposite powder. The monitor has a wide concentration measurement range from 0 to 1200 µm2/cm3 and a wide particle size measurement range from 10 to 300 nm. Lung deposited surface area (LDSA) in m2/cm3, an important metric for quantifying exposure to particles and a relevant metric for the health effects of particles, was measured by the monitor. LDSA is defined as:
where q is a size-dependent charge and d is the particle diameter.
A 50 g plain PAEK powder, 50 g M-5%O2GNP-PAEK powder and 50 g D-5%O2GNP-PAEK powder were transferred from beaker to beaker by pouring action in a glove box for 18 min (3 min for pre-stabilisation, 5 min for pouring action and 10 min for post-stabilisation). LDSA was monitored by Naneos Paratector at a low and a high position separately ().
Figure 2. Illustration of nanoparticle exposure test. The nanocomposite powders were transferred from beaker to beaker by pouring in the glove box. LDSA was monitored at the low and high positions.
2.4.4. Tensile test
The C-MOULD tensile bars were machined out of the hot compression plate to standard ISO527-2 1BA by a CNC machine (Openbuilds, USA). The PBF tensile specimens with the same 1BA size were directly printed. Tensile properties were tested using a Shimadzu AGS-X Series Tensile Tester (Shimadzu, Japan). The testing speed was 1 mm × min−1 and the gauge length was 25 mm. Five repeats were performed for each type of sample.
2.4.5. Electrical conductivity
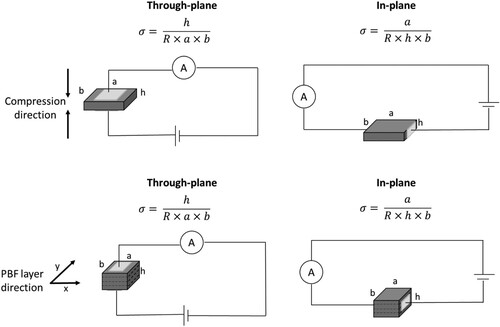
The bulk conductivity of composites was measured using a digital source meter Keithley 2400 (Keithley Instruments, USA). Samples were cut using a slow saw and sanded with P100 and P1200 grade sandpaper to improve the connection between the probe and samples. Conductive silver paint was applied to further enhance contacting over the samples during measurement. The bulk electrical resistance (R) for the in-plane and through-plane directions was measured by measuring the current (A) as a function of the applied voltage (V). The bulk electrical conductivity () was then calculated using the equations in for the in-plane and through-plane directions. Four repeats were performed for each sample to get average electrical conductivity.
Figure 3. Schematic diagram of the bulk electrical conductivity measurement for the tensile test.
The compression moulded tensile bars were machined out of the hot compression plate to standard ISO527-2 1BA by a CNC machine (Openbuilds, USA). The PBF tensile specimens with the same 1BA size were directly printed. Tensile properties were tested using a Universal Shimadzu AGS-X Series Tensile Tester (Shimadzu, Japan). The testing speed was 1 mm/min and the gauge length was 25 mm. Five repeats were performed for each sample. The average tensile stress, tensile modulus and elongation at break were calculated.
2.4.6. Micro-CT
To assess the distribution of GNP in the PAEK matrix, the C-MOULD and PBF samples were scanned using a micro-CT. X-ray source voltage and current were 4 kV and 75 µA, respectively. A high resolution of 1.48 μm per voxel was achieved. The micro-CT results were analysed using a Dragonfly software. 500 × 500 × 500 μm cubic structures were extracted as regions of interest and the 3D distribution of GNP in the composites was obtained.
2.4.7. Statistical analyses
Statistical analyses were conducted using a one-way analysis of variance (ANOVA) with a post hoc Tukey test. The tests were performed using the SPSS (IBM SPSS version 28) software. A p-value of <.05 represents a significant difference between the compared groups.
3. Results and discussions
3.1. SEM images of powders
The SEM images of the original O2GNP and PAEK powder are shown in Figure S1. Larger sizes (>10) and smaller size (<1
) GNPs are found and different numbers of layers of the agglomerates are observed. The shapes of the original PAEK powders are irregular and some particles have a rough and porous surface due to the nature of the synthesis process.
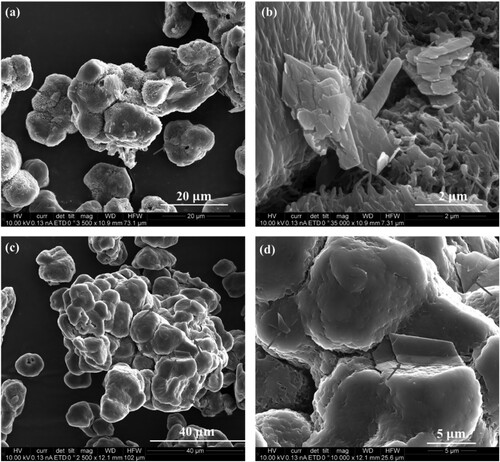
shows by comparison the SEM images of the dry blending and mechanofusion powders with 1.0 wt% O2GNP. For the dry blended powder 1.0% O2GNP, aggregation of the GNP powder on the surface of the PAEK particles was easily observed. In the case of the composite powder prepared using mechanofusion, the process had a dual effect, it smoothed the surface of the PAEK particles as well as attaching the GNP to their surface. This is suspected to be the result of the heat and mechanical shear generated by the high-speed rotation during the mechanofusion process (the friction between particles and/or between the blade and wall of the vessel). The changes in particle size distribution (PSD) after the mechanofusion process are shown in Figure S2. The mechanofusion process shifted the particle size distribution to smaller sizes compared to the untreated plain PAEK powder.
Figure 4. SEM images of (a–b) D-1.0%O2GNP-PAEK composite powder; (c–d) M-1.0%O2GNP-PAEK powder. The mechanofusion powder shows smoother PAEK surface and more uniformly dispersed GNP compared to the dry blending powder.
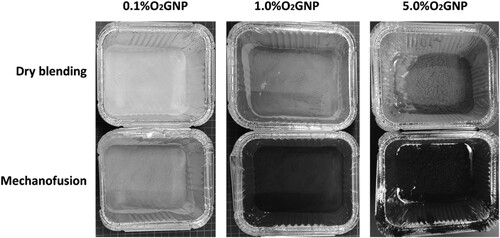
The enhanced dispersion achieved with mechanofusion is evidenced by the colour difference between the dry blend and the mechanofusion process in . The mechanofusion powders are darker colours which indicate an improved mixing and more homogeneous distribution of O2GNPs than the dry blended powder.
Figure 5. Composite powders with 0.1, 1.0 and 5.0 wt% O2GNP after dry blending and mechanofusion processes. The mechanofusion powders are darker than the dry blending powders indicating an improved mixing and more homogeneous distribution of O2-GNPs than the dry blended powders.
3.2. Powder rheology
summarises the results of powder rheology tests conducted using the Freeman FT4 powder rheometer. The definitions for each measurement can be found in a previous study [Citation32]. When PAEK powder was dry blended with loose GNPs, there were no apparent changes in the conditioned bulk density (CBD), compressibility (CPS), or pressure drop (PD) values. In comparison, the mechanofusion composite powders exhibited higher CBD and PD values than the plain PAEK powder. This indicated that mechanofusion process increased the bulk density of the powder, which enhanced packing efficiency and reduced permeability.
Table 3. Summary of powder rheology test results of PAEK and mechanofusion powders.
As the GNP concentration increased, it was noticed that the powder became more cohesive. At higher concentrations, not all nanoparticles were bonded to the PAEK particles, leading to loose GNPs being left in the mix as a dry blend which subsequently resulted in a higher sensitivity to the flow rate and strong cohesion.
Thermal treatment (referred to as T200) and sieving (referred to as sieved) were considered as additional steps to enhance the CBD and improve flow. The additional processes slightly improved the CBD but had little influence on the basic flow energy (BFE). It is important to remark that the plain PAEK as well as the GNP-PAEK grades had significantly lower CBD and BFE values compared with the commercial PBF powder EOS HP3 PEK [Citation32]. In Davies’ study [Citation32], NAS is the key factor for predicting spreadability for plain PAEK powders in PBF; powders with NAS values >0.31 s/mm had a ‘pass’ response for spreading without agglomeration. Although all values are below this threshold of 0.31, the M-0.1%O2GNP-PAEK-T200-sieved composite powder visually seem to spread satisfactory during the PBF process; while the M-0.1%O2GNP-PAEK-T200-sieved composite powder spread poorly, as the printed layer could not be fully covered by the fresh powder. This led to cavities and subsequently poor mechanical properties. The PBF process is shown in Video S1.
3.3. Nanoparticle exposure test
The exposure of nanoparticles was assessed through a comparison of three types of powders: (1) untreated plain PAEK, (2) dry mixed composite powder of high GNP concentration (D-5%O2GNP-PAEK) and (3) mechanofusion powder (M-5%O2GNP-PAEK). The measurements of LDSA values were conducted within a closed glove box without any ventilation, both at low and high positions, over three stages: a 3 min pre-stabilisation, a 5 min powder handling (pouring), and a 10 min post-stabilisation ().
Figure 6. Air monitoring results for PAEK, D-5%O2GNP-PAEK composite powder and M-5%O2GNP-PAEK composite powder at (a) low position and (b) high position.
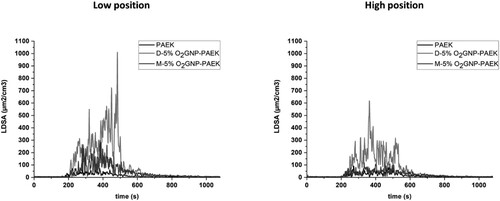
At the low position ((a)), the LSDA values of PAEK ranged from 3.7 to 72. The mechanofusion powder M-5%O2GNP-PAEK exhibited higher exposure values than PAEK with the maximum LSDA values being 298.3
. The dry blending powder D-5%O2GNP-PAEK shows the highest nanoparticle exposure value with a maximum LSDA of 1110
. This value is approximately 15 times higher than that of PAEK and 3.7 times higher than that of the mechanofusion powder. Similar trends have been found at the high position. The LSDA values of PAEK range from 1.8 to 91.5
, M-5%O2GNP-PAEK range from 1.7 to 163.7
, and D-5%O2GNP-PAEK range from 1.6 to 618
. The decrease in LDSA values at the high position is likely due to particle settling in the air [Citation33]. The high LDSA values of dry blending powders were attributed to the presence of loose GNPs. While there is no established standard for a safe LDSA value when handling nanomaterials, the lower LDSA values observed for the mechanofusion powders compared to the dry blending powders indicate that the mechanofusion process has a positive influence on powder handling and helped secure the GNPs onto the surface of the polymeric particles.
3.4. Tensile properties
3.4.1. Tensile properties of hot compression moulded composites (C-MOULD): dry blending vs. mechanofusion
The tensile properties of C-MOULD PAEK, dry blended composites and mechanofusion composites with different concentrations of O2GNP are summarised in . In all composite blends, the presence of O2GNPs showed an improvement in modulus independent of the preparation method (dry blending or mechanofusion) with a higher variation in the dry blend composite values possibly due to the GNP agglomeration. The improvement in modulus is due to the intrinsic modulus of GNP and its high aspect ratio, which increases the interfacial area between the PAEK matrix and nanofillers [Citation12]. The improvements in modulus of PAEK-GNP composites have also been found in the melt-compounding [Citation11,Citation17], but the improvement in melt-compounding was significantly smaller than the observations of this study (5% improvement for 5 wt% GNP composite [Citation11,Citation17] in melt-compounding and approx. 12% improvement in this study).
Table 4. Tensile properties of C-MOULD PAEK and composites prepared using the dry blending and the mechanofusion process.
Surprisingly, the elongation at break of C-MOULD-M-0.1%O2GNP-PAEK (produced by mechanofusion) increased by 123% without a decrease in modulus or tensile stress, leading to tougher composite materials compared to the plain C-MOULD PAEK or C-MOULD dry blended composites of the same concentration. A comparison of typical tensile stress–strain curves are shown in . Statistical analysis shows that there is a significant difference (p = .001) between unreinforced PAEK and C-MOULD-M-0.1%O2GNP-PAEK (Appendix Table S1).
Figure 7. Typical stress–strain curves of C-MOULD PAEK and composites, and PBF printed PAEK and composites with 0.1 and 1.0 wt% of O2GNP.
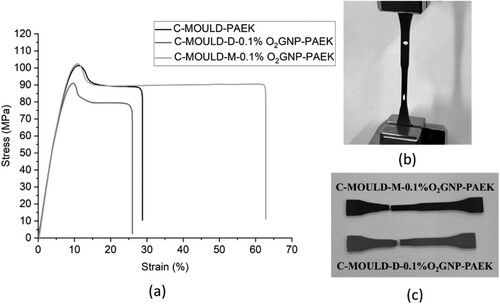
An obvious necking behaviour could be observed in the samples tested at lower GNP loadings (see (b,c)), but also confirmed as well by the stress–strain curves. The yield point disappears in samples above 0.5 wt% GNP. Research shows that graphene may produce tough materials at low loadings and the enhancement in toughness is related to graphene dispersion and adhesion [Citation34]. In Chen’s work, 0.1 wt% PEEK-GNP composite prepared by solvent mixing improved toughness by 38% [Citation14]. An improvement in elongation at break of 31% was achieved when 1 wt% GNP was mixed by solvent mixing in Yaragalla’s work [Citation35]. In our work, the much higher increase in elongation at break in such a small GNP concentration of 0.1 wt% may be related to the better dispersion of GNP and good inter-filler network achieved by the mechanofusion process and the stronger interfacial bonding provided by oxygen functionalisation of GNP. When more O2GNPs were added, the reduction of tensile stress and elongation at break are mainly due to the aggregation of GNPs. The tensile stress of the mechanofusion composites with high O2GNP loadings (1.0 and 5.0 wt%) showed lower values than the dry blending composites. More but smaller O2GNP aggregates in the mechanofusion composites compared to the dry blending composites () may lead to more chances of stress concentrations and generate a premature fracture.
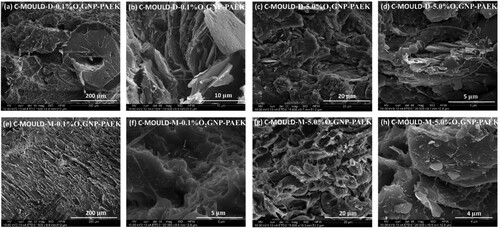
Figure 8. SEM images of tensile fracture surface of (a–d) C-MOULD-D-0.1%O2GNP-PAEK and (e–h) C-MOULD-M-0.1%O2GNP-PAEK.
3.4.2. Tensile properties of PBF printed composites using the mechanofusion powders
The tensile properties of the PBF mechanofusion composites with 0.1 and 1.0 wt% O2GNP are summarised in and compared to the C-MOULD samples with the same concentrations of O2GNP. With reference to the PBF-PAEK, adding 0.1 wt% of O2GNP and using the mechanofusion process has improved the elongation at break by 26%. Statistical analysis shows that there is a significant difference (p = .003, Table S2) between unreinforced PBF-PAEK and PBF-M-0.1%O2GNP-PAEK in elongation at break. The mechanical properties of our PBF-PAEK and PBF-M-0.1%O2GNP-PAEK specimens are comparable to the injection moulded PAEK (IM PAEK) in tensile modulus and strength [Citation27]. PBF-M-1.0 wt%O2GNP-PAEK samples show obvious drops in the tensile properties compared to the unreinforced PBF-PAEK. The typical tensile curves of PBF samples are shown in . The poor mechanical properties of the PBF M-1.0 wt%O2GNP-PAEK samples were due to the pores noticed in the parts (shown in (b)) as the result of poor powder flow. As previously shown in the powder analysis section, cavities are formed during the spreading of the powder. The M-0.1 wt%O2GNP-PAEK did not show obvious spreading issues during the PBF process, and no surface cavities or pores were found. The results in confirm again the discrepancy between the two powders with significantly weaker performance of parts of higher GNP concentration. It is believed that any loose GNP not bonded to the PAEK particles combined with the poor flow characteristics of the plain PAEK powder itself leads to this behaviour. This clearly shows that there is scope for further understanding and optimisation of the powder flow prior to printing.
Figure 9. (a) Typical stress–strain curves of PBF-PAEK and composites with 0.1 and 1.0% of O2GNP. (b) Tensile parts of PBF-M-0.1%O2GNP-PAEK and PBF-M-1.0%O2GNP-PAEK. Surface cavities and pores were found in PBF-M-1.0%O2GNP-PAEK.
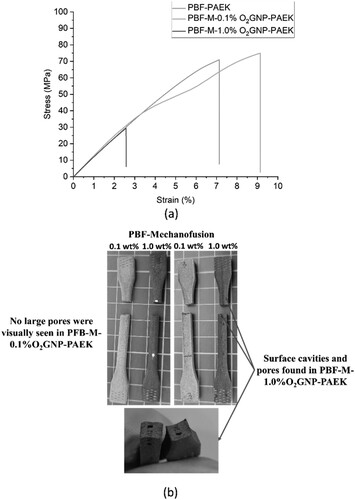
Table 5. Tensile properties of PBF-PAEK and composites prepared using the mechanofusion process.
3.5. Electrical conductivity of composites
3.5.1. Electrical conductivity of hot compression moulded composites (C-MOULD): dry blending vs. mechanofusion
Very often, graphene is added to polymeric structures to enhance electrical or thermal conductivity, as graphene is known to have record values of S/m [Citation36], where PEEK is an insulating polymer (
) [Citation37]. For the composite to show improved electrical performance in comparison with the plain polymer a good distribution of the conductive filler in this case GNP is required. However, achieving a uniform dispersion of the nanofillers is challenging due to their extremely high surface activity, resulting in only small or no enhancements in electrical conductivity [Citation3,Citation38]. shows the electrical conductivity of compression moulded composite samples as a function of the O2GNP loadings. The electrical conductivity of the mechanofusion composites showed a significant improvement in electrical conductivity in both directions compared to the dry blending composites. For the dry blending composites, there were no obvious improvements in the electrical conductivity with increasing O2GNP concentrations. Based on the measurements shown in , the mechanofusion composites incorporating 0.5 wt% O2GNP reached a maximum electrical conductivity value of 6.9
S/m in-plane. Above this loading, the electrical conductivity doesn’t change. The high electrical conductivity was mainly attributed to the good filler network created by the mechanofusion. This creates a large GNP surface area, without agglomeration and creates a more efficient electron paths inside the PAEK matrix than the agglomerated O2GNP in the dry blending composites.
Figure 10. Electrical conductivity of C-MOULD composites measured through-plane and in-plane for dry blending and mechanofusion O2GNP-PAEK nanocomposites as a function of O2GNP loading at 0.1, 0.5, 1.0 and 5.0 wt%.
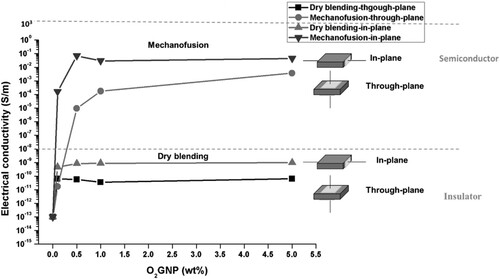
The effect of the compression moulding is clearly shown in all samples through the difference in the electrical conductivity values measured in-plane by comparison with thorough-plane, suggesting the orientation of O2GNP perpendicular to the applied pressure. The connectivity and network formation of the O2GNP is mostly in-plane with the mechanofusion samples having a better distribution and less aggregation of O2GNP.
3.5.2. Electrical conductivity of PBF printed composites using the mechanofusion powders
The electrical conductivity of the PBF-printed composite parts is summarised in and the data compared to the C-MOULD samples with the same O2GNP loadings. Compared to the compression moulding process, there was no pressure applied to the composite powders during the PBF process, allowing the GNP particles to maintain their random and more uniform distribution based on their position on the PAEK particles. The PBF process combined with the mechanofusion process led to uniform electrical conductivity in both in-plane and through-plane directions.
Table 6. Electrical conductivity of PBF GNP-PAEK nanocomposites prepared using the mechanofusion process.
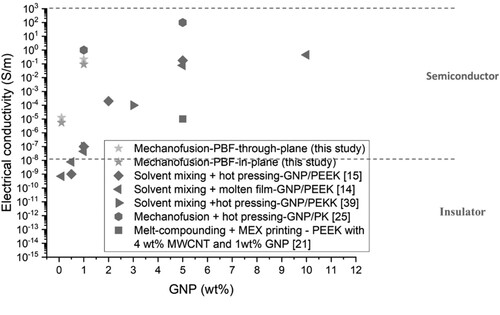
The literature values are compared with the results of this study in . Much higher results were obtained in both in-plane and through-plane orientations in this study compared to the values using solvent mixing methods [Citation14,Citation15,Citation39]. In Yang’s and Chen’s studies [Citation14,Citation15], the electrical conductivity values of PEEK-GNP composites prepared by solvent mixing with 5.0 wt% GNP loading are similar to what this study achieved at significantly lower GNP loadings of 1.0 wt%. The results obtained here are lower than the Polyketone (PK)-GNP nanocomposites prepared through the mechanofusion process followed by compression moulding [Citation25]. However, the authors of the PK-GNP study only measured the surface conductivity using a four-point probe whereas in this study the bulk conductivity was measured. In addition, the lower shear viscosity of PK at its processing temperature (100 Pa·s at 230°C and a shear rate of 1000/s [Citation40]) in comparison with PAEK (283–313 Pa·s at 400°C and a shear rate of 1000/s) could be another reason for the better distribution of GNP in the PK polymer matrix. Other factors contributing towards the differences observed in mechanical and electrical results are (i) the quality and type of the GNPs, and (ii) the level of functionalisation, (iii) in the case of PBF, the composite power flow characteristics. For the MEX-printed part, achieving high electrical conductivity is challenging due to the high porosity of the printed parts. Gonçalves et al. [Citation21] fabricated PEEK nanocomposite filaments that exhibited electrical conductivity ranging from 1.5 to 13.1 S/m. However, the MEX printed parts showed much lower conductivity than the filament (×10−5 S/m with 4 wt% MWCNT and 3 wt% GNP, and 10−4 S/m with 4 wt% MWCNT and 1 wt% GNP), which may be attributed to the presence of pores and re-agglomeration of the carbon nanoparticles during the printing process.
Figure 11. Comparison of the electrical conductivity with other works of GNP-PEEK nanocomposites. Material preparation method, manufacturing process and material details were included.
3.6. Micro-CT
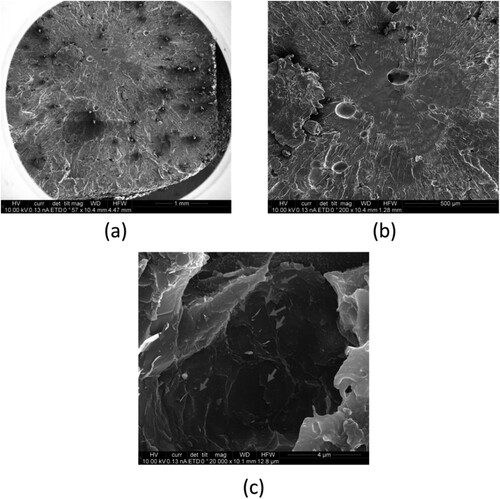
The 3D distributions of GNP in C-MOULD-D-0.1%O2GNP-PAEK, C-MOULD-M-0.1%O2GNP-PAEK and PBF-M-0.1%O2GNP-PAEK have been characterised using a micro-CT scanner and the images are shown in . For the hot compression moulded composites, the mechanofusion composite exhibited a more homogeneous distribution with less agglomeration, which correlate with the better mechanical and electrical performance reported in the previous sections. Interestingly, the GNP distribution in the PBF sample was different to the C-MOULD samples. Some GNPs were interspersed within the PAEK matrix, while others encircled particle-like structures. The diameters of these particle-like structures are around 50–150 μm, causing suspicion that they may be either unsintered PAEK particles or pores. The SEM images of the cross-section of fractured PBF-M-0.1%O2GNP-PAEK are shown in . The images reveal the presence of unsintered PAEK powders, with round cavities present at the fracture surface of the tensile tested samples and GNPs within the cavity surface. The porosity on PBF-M-0.1%O2GNP-PAEK was found to be less than 0.5% according to the micro-CT results. Some features were observed around the unsintered PAEK particles that could possibly be considered as pores. If the features around the unsintered PAEK are counted as pores, the porosity of the part would be 0.4%. To further compare the PBF process with the hot compression moulding process and eliminate these large anomalies which obscure the analysis into the GNP distribution, the higher sizes of O2GNP were filtered by max ferret diameter within the range of 5–40 μm for both samples and the new distributions are shown in (d–e). PBF specimens appear have a better distribution, with smaller O2GNP particles distributed throughout the PAEK matrix. These results demonstrate that the mechanofusion and PBF processes promoted a more uniform dispersion of O2GNP in the composites, leading to higher electrical conductivity, as discussed in the previous section. However, the study also highlighted the importance of powder flow and spreadability in relation to the PBF process and the mechanical and electrical measurements.
Figure 12. Micro-CT scans of O2GNP distributions in PAEK matrix. The observed box dimensions were 500 × 500 × 500 μm3.
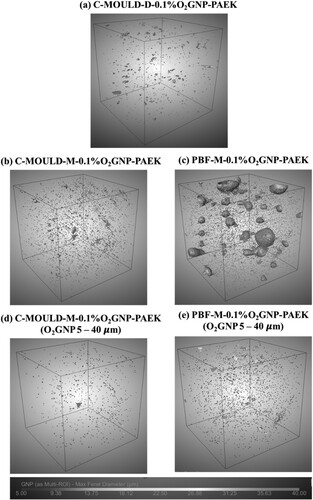
Figure 13. SEM images of tensile fracture surface of PBF-M-0.1%O2GNP-PAEK. Unsintered PAEK powders and cavities were left on the fracture surface in (a) and (b). GNPs were observed on the cavity surface in (c).
3.7. Discussion
In this work, the mechanofusion process has been recognised as an effective method for producing GNP-PAEK nanocomposite powder for use in hot compression moulding and the PBF process. The fabrication of GNP-PAEK nanocomposites through the PBF process is a novel contribution of this study.
When compared to other GNP composite works that employed solvent mixing [Citation12,Citation15] or melt-blending [Citation11,Citation17,Citation41], the C-MOULD samples exhibited a significant increase in toughness (122%) with the addition of 0.1 wt% GNP (C-MOULD-M-0.1%O2GNP-PAEK), while maintaining constant modulus and tensile stress. In addition, the in-plane electrical conductivity reached 10−4S/m with a 0.1 wt% GNP loading, which is considerably higher when compared to other reported GNP-PEEK composites [Citation14,Citation15], which only achieved 10−8 S/m with 1 wt% GNP [Citation14] and 10−4 S/m with 2 wt% GNP [Citation15].
Tensile properties and electrical conductivity of the printed nanocomposites were also reported. While Wang et al. [Citation24] and Chen et al. [Citation14] reported a thermally induced phase separation and a core–shell coating method for producing PEEK nanocomposite powders, the scalability of their methods remains unproven and no standard test specimens have been printed to date. Recent studies on MEX-printed GNP-PEEK nanocomposites have been published [Citation18–21]. However, achieving high electrical conductivity in MEX-printed GNP-PEEK nanocomposites is challenging due to the high porosity of parts produced by the MEX method. In this study, the PBF process, combined with the mechanofusion process achieves high electrical conductivity with improved isotropy when using a 0.1 wt% nanofiller loading. The mechanical performance of the PBF samples did not show significant improvement compared to the C-MOULD samples. This is most likely the result of the inclusions noticed during the micro-CT studies. It is unclear at this stage whether these inclusions are partially melted particles with a higher level of GNP coating or pores which could be the result of poor powder flow characteristics during the spreading stages.
4. Conclusions
The successful fabrication of the GNP-PAEK nanocomposites has been demonstrated in this work using the mechanofusion process to improve the GNP dispersion into the polymer and enhance the adhesion between functionalised GNP and polymer particles. The mechanofusion composites demonstrated superior electrical conductivity when compared with the dry blended grades. In the case of the compression moulded samples, the electrical conductivity of the mechanofusion composite reached values of 10−2 S/m with only 0.5 wt% O2GNP. In addition, the composite with 0.1 wt% O2GNP prepared through the mechanofusion method showed significant improvement in elongation at break is a tensile property without a decrease in tenssile modulus and stress. The elongation at break increased by 123% compared to unfilled PAEK. The powder bed fusion process was also used to manufacture parts and evaluate electrical performance. It was envisaged that the lack of pressure experienced in the PBF process would help the printed specimens create a better GNP network and improve the isotropy of all properties. This was proven by the analysis of the printed parts which had an isotropic electrical behaviour and values within the semiconductor region at low concentrations of O2GNP (0.1 and 1.0 wt%).
Supplemental Material
Download ()Acknowledgements
The authors would like to acknowledge that this work was carried out through Innovate UK funding (Materials and Manufacturing Round 3) as part of Project Number 391, Multifunctional PAEK nanocomposites for Additive Manufacturing (F4 PAEK). The authors thank Dr Martin Corfield in the Department of Materials Science and Engineering at the University of Sheffield for his kind technical support and assistance for micro-CT experiments.
Data availability statement
The authors confirm that the data supporting the findings of this study are available within the article and its supplementary materials.
References
- Gan D, Lu S, Song C, et al. Physical properties of poly(ether ketone ketone)/mica composites: effect of filler content. Mater Lett. 2001;48(5):299–302. DOI:10.1016/S0167-577X(00)00318-9
- Liu L, Xiao L, Zhang X, et al. Improvement of the thermal conductivity and friction performance of poly(ether ether ketone)/carbon fiber laminates by addition of graphene. RSC Adv. 2015;5(71):57853–57859. DOI:10.1039/C5RA10722A
- Chen B, Yazdani B, Benedetti L, et al. Fabrication of nanocomposite powders with a core-shell structure. Compos Sci Technol. 2019;170:116–127. DOI:10.1016/j.compscitech.2018.11.046
- Yazdani B, Chen B, Benedetti L, et al. A new method to prepare composite powders customized for high temperature laser sintering. Compos Sci Technol. 2018;167:243–250. DOI:10.1016/j.compscitech.2018.08.006
- Meng Q, Song X, Han S, et al. Mechanical and functional properties of polyamide/graphene nanocomposite prepared by chemicals free-approach and selective laser sintering. Compos Commun. 2022;36:101396. DOI:10.1016/j.coco.2022.101396
- Cataldi P, Athanassiou A, Bayer IS. Graphene nanoplatelets-based advanced materials and recent progress in sustainable applications. Appl Sci. 2018;8(9):1438. DOI:10.3390/app8091438
- Atienza AA. Effect of graphene nanoplatelets and carbon nanotubes in peek and peek/carbon fibre composites. Madrid: Universidad Carlos III de Madrid; 2019.
- El Achaby M, Qaiss A. Processing and properties of polyethylene reinforced by graphene nanosheets and carbon nanotubes. Mater Des. 2013;44:81–89. DOI:10.1016/j.matdes.2012.07.065
- Ba H, Truong-Phuoc L, Romero T, et al. Lightweight, few-layer graphene composites with improved electro-thermal properties as efficient heating devices for de-icing applications. Carbon N Y. 2021;182:655–668. DOI:10.1016/j.carbon.2021.06.041
- Song H, Li N, Li Y, et al. Preparation and tribological properties of graphene/poly(ether ether ketone) nanocomposites. J Mater Sci. 2012;47(17):6436–6443. DOI:10.1007/s10853-012-6574-0
- Puértolas JA, Castro M, Morris JA, et al. Tribological and mechanical properties of graphene nanoplatelet/PEEK composites. Carbon N Y. 2019;141:107–122. DOI:10.1016/j.carbon.2018.09.036
- Jiang N, Tan P, He M, et al. Graphene reinforced polyether ether ketone nanocomposites for bone repair applications. Polym Test. 2021;100:107276. DOI:10.1016/j.polymertesting.2021.107276
- Tewatia A, Hendrix J, Dong Z, et al. Characterization of melt-blended graphene – poly(ether ether ketone) nanocomposite. Mater Sci Eng B. 2017;216:41–49. DOI:10.1016/j.mseb.2016.05.009
- Chen B, Berretta S, Evans K, et al. A primary study into graphene/polyether ether ketone (PEEK) nanocomposite for laser sintering. Appl Surf Sci. 2018;428:1018–1028. DOI:10.1016/j.apsusc.2017.09.226
- Yang L, Zhang S, Chen Z, et al. Design and preparation of graphene/poly(ether ether ketone) composites with excellent electrical conductivity. J Mater Sci. 2014;49(5):2372–2382. DOI:10.1007/s10853-013-7940-2
- You J, Choi H-H, Cho J, et al. Highly thermally conductive and mechanically robust polyamide/graphite nanoplatelet composites via mechanochemical bonding techniques with plasma treatment. Compos Sci Technol. 2018;160:245–254. DOI:10.1016/j.compscitech.2018.03.021
- Alvaredo-Atienza A, Fernández-Blázquez JP, Castell P, et al. Production of graphene nanoplate/polyetheretherketone composites by semi-industrial melt-compounding. Heliyon. 2020;6(4):e03740. DOI:10.1016/j.heliyon.2020.e03740
- Alam F, Varadarajan KM, Koo JH, et al. Additively manufactured polyetheretherketone (PEEK) with carbon nanostructure reinforcement for biomedical structural applications. Adv Eng Mater. 2020;22(10):2000483. DOI:10.1002/adem.202000483
- Rinaldi M, Bragaglia M, Nanni F. Mechanical performance of 3D printed polyether-ether-ketone nanocomposites: an experimental and analytic approach. Compos Struct. 2023;305:116459. DOI:10.1016/j.compstruct.2022.116459
- Arif MF, Alhashmi H, Varadarajan KM, et al. Multifunctional performance of carbon nanotubes and graphene nanoplatelets reinforced PEEK composites enabled via FFF additive manufacturing. Compos B Eng. 2020;184:107625. DOI:10.1016/j.compositesb.2019.107625
- Gonçalves J, Lima P, Krause B, et al. Electrically conductive polyetheretherketone nanocomposite filaments: from production to fused deposition modeling. Polymers (Basel). 2018;10(8):925. DOI:10.3390/polym10080925
- Berretta S, Davies R, Shyng Y, et al. Fused deposition modelling of high temperature polymers: exploring CNT PEEK composites. Polym Test. 2017;63:251–262. DOI:10.1016/j.polymertesting.2017.08.024
- Wang Y, Shen J, Yan M, et al. Poly ether ether ketone and its composite powder prepared by thermally induced phase separation for high temperature selective laser sintering. Mater Des. 2021;201:109510. DOI:10.1016/j.matdes.2021.109510
- Blaker JJ, Knowles JC, Day RM. Novel fabrication techniques to produce microspheres by thermally induced phase separation for tissue engineering and drug delivery. Acta Biomater. 2008;4(2):264–272. DOI:10.1016/j.actbio.2007.09.011
- You J, Kim J-H, Seo K-H, et al. Implication of controlled embedment of graphite nanoplatelets assisted by mechanochemical treatment for electro-conductive polyketone composite. J Ind Eng Chem. 2018;66:356–361. DOI:10.1016/j.jiec.2018.06.001
- Jeon IS, Lee MH, Choi H-H, et al. Mechanical properties and bioactivity of polyetheretherketone/hydroxyapatite/carbon fiber composite prepared by the mechanofusion process. Polymers (Basel). 2021;13(12):1978. DOI:10.3390/polym13121978
- Yi N, Davies R, Chaplin A, et al. Novel backbone modified polyetheretherketone (PEEK) grades for powder bed fusion with enhanced elongation at break. Addit Manuf. 2022;55:102857. DOI:10.1016/j.addma.2022.102857
- Kondo K, Ito N, Niwa T, et al. Design of sustained release fine particles using two-step mechanical powder processing: particle shape modification of drug crystals and dry particle coating with polymer nanoparticle agglomerate. Int J Pharm. 2013;453(2):523–532. DOI:10.1016/j.ijpharm.2013.06.028
- 2-DTech graphene product sheet; 2019. Available from: https://www.2-dtech.com/wp-content/uploads/2019/04/Graphene-Datasheet-3.4_v3.pdf
- Chen B, Berretta S, Davies R, et al. Characterisation of carbon fibre (Cf) – poly ether ketone (PEK) composite powders for laser sintering. Polym Test. 2019;76:65–72. DOI:10.1016/j.polymertesting.2019.03.011
- Berretta S, Evans KE, Ghita O. Processability of PEEK, a new polymer for high temperature laser sintering (HT-LS). Eur Polym J. 2015;68:243–266. DOI:10.1016/j.eurpolymj.2015.04.003
- Davies R, Evans K, Ghita O. Multivariate correlation of PolyArylEtherKetone powder properties for additive manufacturing and a method for predicting spreading in polymer powder bed fusion. Powder Technol. 2022;410:117871. DOI:10.1016/j.powtec.2022.117871
- Chen B, Davies R, Liu Y, et al. Laser sintering of graphene nanoplatelets encapsulated polyamide powders. Addit Manuf. 2020;35:101363. DOI:10.1016/j.addma.2020.101363
- Wang X, Song M. Toughening of polymers by graphene. Nanomater Energy. 2013;2(5):265–278. DOI:10.1680/nme.13.00024
- Yaragalla S, Zahid M, Panda JK, et al. Comprehensive enhancement in thermomechanical performance of melt-extruded PEEK filaments by graphene incorporation. Polymers (Basel). 2021;13(9):1425. DOI:10.3390/polym13091425
- Nirmalraj PN, Lutz T, Kumar S, et al. Nanoscale mapping of electrical resistivity and connectivity in graphene strips and networks. Nano Lett. 2011;11(1):16–22. DOI:10.1021/nl101469d
- Song L, Zhang H, Zhang Z, et al. Processing and performance improvements of SWNT paper reinforced PEEK nanocomposites. Compos A Appl Sci Manuf. 2007;38(2):388–392. DOI:10.1016/j.compositesa.2006.03.007
- Tanahashi M. Development of fabrication methods of filler/polymer nanocomposites: With focus on simple melt-compounding-based approach without surface modification of nanofillers. Materials (Basel). 2010;3(3):1593–1619. DOI:10.3390/ma3031593
- Wang QB, Jia DL, Pei XH, et al. Mechanical performance of graphenex/poly(ether ketone ketone) composite sheets by hot pressing. Sci Rep. 2022;12(1):4114. DOI:10.1038/s41598-022-08221-0
- Hyosung Corporation. POKETONE-high performance thermoplastic polymer; 2017. Available from: http://www.can-altek.com/wp-content/uploads/2018/06/POKETONE_Technical-Handbook.pdf
- King JA, Tomasi JM, Klimek-McDonald DR, et al. Effects of carbon fillers on the conductivity and tensile properties of polyetheretherketone composites. Polym Compos. 2018;39(S2):E807–E816.