?Mathematical formulae have been encoded as MathML and are displayed in this HTML version using MathJax in order to improve their display. Uncheck the box to turn MathJax off. This feature requires Javascript. Click on a formula to zoom.
ABSTRACT
The study of the mechanical properties of 3D printed food is crucial for food personalisation. Texture impacts the sensory experience along the oral food consumption. This work aimed to investigate the mechanical properties of post-processed printed food samples with different porosity topologies (triangled-shape/squared-shape). Image analysis showed changes in the structure before and after post-processing. The mechanical properties characterised via 3-point bending tests revealed that triangle-shaped topologies presented lower strength (20% less) and higher flexural stiffness (≈20%) when compared to the square-shaped topologies. A qualitative comparison of the porosity topologies and their role in the stiffness of structures under tensile and bending loads was performed via finite element models. The flexural stiffness varied between the triangle-shaped designs (13–35%) but remained almost constant for square-shaped designs (40–43%). The results presented in this work showed that the mechanical properties of 3D-printed food could be modified by the selection of porosity topology.
1. Introduction
Food 3D Printing is a process that applies a layer-by-layer manufacturing technique based on a predesigned digital model through a computational aided-design (CAD) software. Extrusion-Based 3D Printing is the most widely used technique to print food materials [Citation1,Citation2]. In this process, soft food materials are introduced into a cylinder capsule or a syringe and pushed to extrude along the nozzle on a printer bed. One of the main advantages of using 3D printing in food production is that it allows customisation in taste, nutrition, shape, dimension, and texture [Citation3–5]. Food texture is an important factor in food quality, playing a vital role in the sensory experience of an individual during oral consumption [Citation6,Citation7].
Research on food texture could provide useful information on the development of personalised post-processed products. In this regard, porosity, infill, size, shape, and distribution of controlled voids along the surface of a printed structure could play an important role in the mechanical properties of the printed samples [Citation8]. The term porosity is used to describe how porous a structure is, regarding the number of voids present on it and the resulting inevitable microporosity due to the nature of the material. This prompts a finer degree of tailoring of these properties of 3D printed food. For instance, some works have focused on how the infill pattern or the macroscopic inner structure affects the texture of printed samples [Citation9–11]. In these studies, authors demonstrated that the instrumental and sensory texture of food can be modified by varying the shape of the inner structures that fill the samples. A comparative study of untreated, melted, and printed cheeses through their textural properties were assessed by Le Tohic et al. [Citation12]. When printed with a 100% infill, the sample resulted in 49% softer than untreated cheese samples (i.e. obtained by core extraction from the block of cheese using a borer). Mantihal et al. [Citation6] evaluated the panellists’ perceptions and preferences for printed chocolate through a sensory evaluation. The panellists ranked the strength of the texture-modified samples. Among the panellists, no significant difference in preferences was observed for strength. However, they did prefer the appearance of samples with infills around 25 and 50%, over the ones with 100% infill. Also, as expected, denser samples were stronger and stiffer. Furthermore, some authors have printed porous structures with pectin-based formulations to obtain different porous perceptions [Citation13]. These authors have also predicted the mechanical properties through an analytical model and finite element modelling and compared those results with their experiments [Citation13]. All these previous studies were limited to quasi-solid or paste-like materials. Therefore, now the focus of study will be on structures with voids in different configurations. The void area, shape, and distribution in a structure could be crucial when modifying the mechanical properties for 3D printed structures [Citation14]. This could be explored towards the aim of personalising textures in 3D printing food products.
When printing food, post-processing (e.g. baking, frying, boiling, freeze drying, and steaming) is common because desired properties, such as stiffness, shape retention, flavour, or colour, can be achieved [Citation15]. This could lead to a more appetising product, which might increase consumers’ desire to eat [Citation16]. During post-processing, the water content of the printed product decreases, resulting in higher strength and reduced stickiness, which may improve the overall texture sensory [Citation17,Citation18]. In this regard, the effect of infill percentage and layer height on the textural properties of printed and cooked cereal-based and rose-yam pastes was conducted by Severini et al. [Citation19] and Feng et al. [Citation8], respectively. The authors reported an increment of 268% in the force required to break a cereal-based sample when the infill sample increased from 10 to 20% v/v. While for the rose-yam paste, the breaking force of the 50% filled sample was considerable low (around 31% less than that of 100% filled), hence, the sample with a low infill level exhibited a low hardness. Another study characterised the effect of porosity topology on strength and fracturability in post-processed food by varying the internal structure in the CAD models, rather than focusing only on the infill [Citation20]. Results from the study suggested that the area of the voids and their distribution in the printed samples might play a key role when attempting to modify the texture of printed samples. However, a gap remained in the analysis of the role of void’s shape and distribution on the mechanical properties and the post-processing effect, especially when describing how the stress distribution is affected by the placement and orientation of different void shapes.
The literature reviewed here revealed that the characterisation of the flexural response of 3D printed food is still limited. Properties that are often overlooked, such as delamination caused by shear and coupled deformation mechanisms like shear-normal, could be identified through the application of flexural loads. In this regard, flexural responses could reveal novel properties that cannot be determined with other mechanical tests of instrumental texture measurement (i.e. compression test) [Citation21]. To the best of the authors’ knowledge, there are no detailed reports on how different void shapes and porosity topologies (besides infill) affect the final post-processed food product’s mechanical properties (such as stiffness and strength). Here, the study aimed to evaluate how 3D food printing can be used to modify food texture by changing the porosity topology of printed food. In addition, image characterisation of the samples’ shape defects inherent to the fabrication process and the post-processing are also analysed. Lastly, the role of void shapes and distribution on mechanical properties are further qualitatively analysed through finite element models.
2. Materials and methods
The research framework followed in this study is summarised in (A). First, Stage 1 consisted of printable formulation preparation, and Stage 2 summarised the 3D printing process. Then, Stage 3, showed the post-processing procedure and the image dimensional analysis of the printed samples. Next, Stage 4 consisted of the mechanical characterisation with 3-point bending tests. Finally, Stage 5 covers the numerical computations to qualitatively assess the role of void shape and porosity topology on the response in bending and tensile loading.
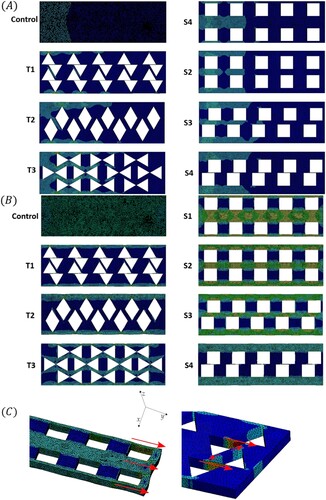
Figure 1. (A) Research plan to evaluate the mechanical properties of 3D printed food samples. Stage 1 represents the formulation preparation process. Stage 2 involves the 3D printing process of the designs. Stage 3 represents the post-processing of the printed samples. Stage 4 is the 3-point bending test and Stage 5 represents the simulation tests performed. (B) The porosity topology patterns studied. Control, no topology and a solid volume fraction of 100% (control). T1, T2 and T3 with triangles as base shapes for their topology patterns (triangle-shaped). S1, S2, S3 and S4 with squares as base shapes for their topology patterns (square-shaped). is the representative nominal area per void that is being analysed and compared with the corresponding experimental area
. The following are the measures for a = 40 mm, b = 120 mm, c = 13.283 mm, d = 12.36 mm.
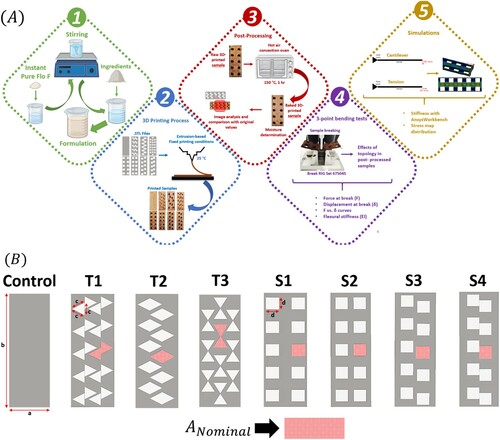
2.1. 3d printing of samples
The materials, formulation preparation, and specifications for the printing parameters were used as reported in Maldonado-Rosas et al. [Citation22]. The selection of the formulation for this work was based on the nutritional properties and printability results of the previous work. The formulation was designed focused on the required energy and nutrient levels for children aged 4 to 8 [Citation23,Citation24]. The ingredients were selected as follows: amaranth leaves were used due to their high nutritional value, particularly in Vitamin B6, minerals, folate [Citation25], and antioxidants [Citation26]; orange peel and guava were added to boost dietary fibre and vitamin C content, while cricket flour and dried milk were included for protein and vitamin D [Citation25]; cocoa and sugar were used to enhance the appeal of the formulation for the target population; finally, pregelatinised starch (Instant Pure Flo F) was chosen for its technological functionality to improve the printability of the complex formulation. The formulation was printed using Foodini (Natural Machines, Spain), an extrusion-based 3D food printer. For the sake of completeness, summarises the formulation used for printing the samples; this was selected due to its degree of printability [Citation22]. The mixture was stored in a flask, covered with parafilm, at room temperature until used.
Table 1. Ingredient composition of the printable formulation.
The rheological properties of the studied materials can be found in a previous work, where rheological properties characterisation and printability evaluation were the main objectives. In the present work, a continuation of the previous study, the samples were not a pseudo-plastic material. As indicated in the research plan ((A)), samples were post-treated (baked), meaning that a rigid material was used. The mechanical properties of these rigid materials were the focus of the study, basing the experimental variables on the voids and porosities that were achieved through printing.
The food formulation was placed inside stainless-steel capsules with a cone-shaped nozzle diameter of 1.5 mm. The printing parameters used were: ingredient flow speed of 1.8%, 2200 mm/min of print speed, 1% of fill factor, first ingredient flow of 6, 1.4 mm of first layer nozzle height, 4.2 mm of first ingredient hold, 10 mm of minimum hold distance, 3 mm of ingredient hold, 1.4 mm of distance between layers and line thickness, jump height of 3 mm and first layer speed of 100%. These parameters were selected based on a previous study [Citation22]. Finally, the capsule containing the printable formulation was kept at a constant temperature (25°C) during the printing process. After printing, pictures of raw samples were taken with a 20.4-megapixel (20.4 MP, CMOS Exmor R) camera (Cybershot HX400, Sony Group Corporation, Japan). The voids areas at the effective bending regions were measured to compare the voids area before and after post-processing. All measurements were analysed with the ImageJ 1.8 software (National Institutes of Health, U.S).
Experimental determinations were carried out in triplicate (except for the determination of the area of the voids, which were quintuplicate). For statistical analysis and differences among means, analysis of variance (ANOVA) and Tukey tests were performed using Minitab Statistical Software, version 19 (State College, Pennsylvania, USA) (α = 0.05).
2.2. Design of 3D printed samples
In this work, different void shapes and distributions are studied and depicted in (B). All samples were printed with the same external dimensions, with a height of 5 mm and a constant solid volume fraction of 68%. The control had a nominal
of 100%. Designs were modelled computationally in Fusion 360® (Autodesk Inc.) with the dimensions shown in (B) and then the.STL file for each design was processed with the 3D printer software Foodini Creator®. The
was selected considering the space needed to achieve the same empty area between designs with voids (1527 mm2). The distribution of the voids was selected to evaluate the influence of continuous or discontinuous strands of material. However, triangles were not placed as square voids to keep the same volume fraction in all designs; samples needed more triangles than square ones for this. Based on preliminary tests, it was concluded that square shapes tend to be rounded after printed. Hence, circular, hexagonal, or elliptical shapes were not considered, as they would have become indistinguishable from the square ones.
2.3. Post-processing and moisture content determination
All samples were baked at 150°C for 1 h in a preheated Oster TSSTTVFDXL convection oven and left to cool down at room temperature for 30 min. These conditions were determined based on preliminary experiments. Samples were stored in a plastic bag for two days.
Moisture determination assured that the effect observed was primarily due to the void shape and distribution and not due to the moisture content of the samples. This was determined following the procedure established by the Association of Official Analytical Chemists [Citation27], with some modifications. Post-processed samples (3 g) were placed into a crucible and put into a heating chamber (FD023UL-120 V, Binder, Germany) at 105°C for 3 h. Then, they were transferred to a desiccator under anhydrous conditions to cool for 30 min and weighed.
2.4. Experimental characterisation of mechanical properties
The post-processed samples were subjected to 3-point bending using a Perten TVT6700 Texture Analyzer (Perkin Elmer, USA) equipped with a 10-kg load cell. The tests were performed at room temperature with a cross-head speed of 10 mm·s−1. The distance between the two supports was 60 mm. Applied load
, and displacement travelled by the probe during the test
were registered and video recordings were taken to capture the entire bending response. A three-point bending test was selected because, in food 3D printing, a major issue is the stability of the samples while being fabricated. This gets compromised for samples with a high number of layers [Citation28]. Flexural samples can be designed with a low number of layers [Citation14] and their dimensions allow to incorporate an intended porosity without printing voids too small, like in a cubic or cylindrical sample.
Data for and
were exported from the software TexCalc® (v5.2.2.287, Perten Instruments, New South Wales, Australia). Maximum applied load and displacement reached at break were defined as indicators of strength and fracturability, respectively. The coupled terms
(defined as flexural stiffness) correspond to Young’s modulus
and the second moment of the area of the sample’s cross-section
.
was calculated from the slope of the linear region of the load-displacement curves, as.
(1)
(1) Samples were further inspected to characterise the dimension of the material’s gap width between the inner voids of the samples (as seen in Figure A1 of Appendix A). The microstructural characterisation was done with an optical microscope (Zopsc-1® model 50–1000X, China) with a magnification of 50× and microphotographs taken with its integrated camera. Additional pictures were taken as described in Section 2.1, to measure gaps between the area of the voids (Figure A1). The voids areas at the effective bending regions and the area of the stripes of material parallel to samples’ main axis were also measured. The average percentage error of the voids area for every post-processed sample was evaluated by measuring the average area of the voids of the samples
and compared against their corresponding nominal area
. All measurements were analysed with the ImageJ 1.8 software.
2.5 Numerical analysis via finite element models
The role of voids shape and distribution without the influence of the intrinsic manufacturing defects was assessed with both cantilever and tension loading scenarios using Finite Element models (FEM) with the software Ansys Workbench® 2021 R1 (Canonsburg, PA, USA). Tetrahedrons finite elements with size of 1 mm were used to mesh the models and subjected them to the boundary conditions. The resulting stiffness when the displacement was set to 3 mm, for both cantilever and tension loading scenarios were studied.
3. Results and discussion
3.1. Force-displacement results of post-processed samples under 3-point bending
Force-displacement curves obtained from the experimental tests are presented in . Each graph corresponds to the results of the post-processed (baked) samples of the studied designs. Photographs of the samples at key stages in their flexural response are included. The photograph on the left shows the sample when the applied load has reached 5N. The latter because, in general, the slope of the linear region of the load-displacement curves, for all the samples, started to have non-linear variabilities with values higher than 5N. The photograph on the right represents the sample at the failure point, in this case sudden fracture [Citation8]. Scattered results for maximum load capacity can be attributed to the defects resulting from the printing process and/or post-process (water loss by dehydration and internal water vaporisation) [Citation29], especially for T1, T3, and S1, as later discussed in section 3.3.
Figure 2. Load-displacement curves per design samples.
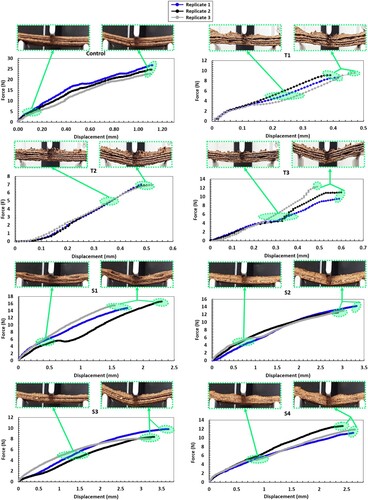
Average force-displacement curves of the samples are presented in to ease the comparison between the studied designs. The control sample, being quasi-solid, resulted in the steepest curve and the highest strength value (24.75 N, reached at a displacement of 1.11 mm). Regarding T1, T2, and T3 (designs with triangle-shaped voids), it can be observed in that they resulted in different magnitudes of strength and stiffness. In this case, probably due to the orientation of the voids with respect to the principal axis of the samples. Different orientations could also affect the stress concentrations, even when everything else is kept constant (volume fraction, overall dimensions, etc.). When compared to the control sample, considerably less strength was observed, ranging from 6.96 to 10.91 N, at a displacement between 0.43 and 0.56 mm. Different values were observed in the curves for the S1, S2, S3, and S4 designs, indicating more flexible designs with higher levels of strength, ranging from 8.74 to 15.58 N, with a displacement between 1.87 and 3.41 mm. The difference observed between structures with triangle and squared-shaped voids can be explained if it is considered the different geometries and the resulting continuity of the material in the main axis, which creates different stress distributions and concentrations when a load is applied. In addition, as expected, with the inclusion of intended porosity, quasi-solid samples will be stiffer and stronger. Similar to what has been reported for raw printed structures [Citation9,Citation11] for post-processed printed structures [Citation30].
Figure 3. Average force-displacement curves of the evaluated samples.
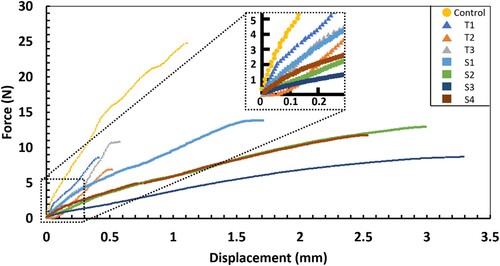
For the curves displayed in , designs with triangle-shaped voids have a stiffer and brittle response (being 10.91 N the highest) when compared to those with square-shaped voids (with 15.58 N the highest) in most cases. Other studies in the literature, involving soft and raw materials (such as brown rice and mashed potatoes) concluded that the inner pattern did not affect considerably the texture of the printed samples [Citation9,Citation11]. However, in other studies where post-processing occurred (for cereal-based samples in a convectional oven at 200°C for 15 min and for yam samples in an air fryer 100°C–160°C until constant weight), the inner structure indeed produced important changes to the texture of the printed product, expressing a relationship between the strength of the post-processed product and the inner pattern [Citation19,Citation30]. It is important to highlight that these works differed from the present one regarding the post-processing method and processing parameters. While numerical comparisons cannot be established, this is an open issue that prompts future work. In addition, studies that dealt with the mechanical characterisation (besides a commonly reported Texture Profile Analysis) of food are scarce. Although, in general, the presented results here and in the previous studies suggest that the variation in the internal structure patterns might play a relevant role in the mechanical properties of post-processed printed products.
3.2. Flexural stiffness and strength of 3D printed food
Data from the force-displacement curves is further processed to obtain the maximum load capacity and flexural stiffness (see ). In addition, the strength and flexural stiffness values observed for the control sample design were taken as 100% when comparing the values of the other designs. Therefore, from the results presented in , all designs with triangle-shaped voids and S3 presented strength values around 28.12 and 44.08% of the control sample values. Similarly, the samples with square-shaped voids, presented close strength values between them (from 47.87 to 62%), hence a higher strength (up to 20% more) than those with triangle-shaped voids, except for S3 (35.31%). All the designs with triangle-shaped voids and S1 presented similar flexural stiffness values, around 32.73 and 52.30% within them. S1 was the strongest sample among all tested designs with voids on its structure (62.94%) and the stiffest among the designs with square-shaped voids (32.73%). Also, T1 appeared to be the stiffest design (52.30%), among all those tested. The designs with square-shaped voids resulted in closer values between them in their respective flexural stiffness (around 9.31 and 16.43%), showing less stiffness than the designs with triangle-shaped voids, except for S1. Additionally, S3 (with 9.31%) is the most flexible design among all tested samples with voids. In general, it can be assumed that the designs with square-shaped voids presented a less brittle and more flexible structure compared to the designs with a triangle-shaped topology. An explanation for these differences between structures with triangle and squared-shaped voids could be related to the void geometries in the structures and their resulting stress distributions when a load is applied. In addition, the rotation and distribution of the voids could be responsible for the variations among designs with the same void shape. The post-processing effects on the printed samples could also explain the observed properties. For instance, water loss by dehydration and internal water vaporisation could have caused relevant defects in the final structure, modifying the shapes and areas of the resulting voids of the samples. The latter might result in changes in their mechanical properties, as later discussed in the following sections.
Table 2. Force, Flexural Stiffness and Percentage Error for the 3D printed post-processed samples
3.3. Image and micro-characterisation of post-processed samples
Variability in the results presented in and suggested further inspection of the samples by means of digital images and micrographs. The results from the shape analysis revealed defects in all samples caused mainly by modifications in the dimensions of the original design (). It can be assumed that if the formulation and the post-processing method and parameters remain constant, same-sized and same-shaped voids will undergo changes in a similar way [Citation31]. This also caused the printed samples to differ visually from the actual structures designed in the software (original designs), because of printing limitations. These printing limitations have been reported before as printing percentage errors, being around 30% for the same 3D printer and formulation [Citation22], but without post-processing. Some other studies have also measured these limitations by addressing the term shape fidelity [Citation32–34]. However, the limitations not only vary depending on the material, design, and printer but also tend to increase when post-processing, as reported in other studies [Citation20,Citation29,Citation30,Citation35]. These limitations due to modification of the structure during post-processing are not only identified in the changes observed for the size or dimension of the samples but also in the internal structures of the samples or infill. In this study, the defects were characterised by differences between the measured gaps between the voids (as seen in Figure A2 of Appendix A) vs those from the nominally designed. This can explain the percentage errors and areas observed in and , respectively. Additionally, as it happened in the previous studies, the shapes of the internal structures (the shape of the voids areas) were modified (by shrinking of their areas) due to the swelling of the material during the post-processing, as it has been reported with other materials [Citation36]. The shrinking of the area modified the shapes of the voids turning them into roundish forms, as seen in Figure A2. The comparison of these areas with the original area for each design (triangle or square) showed significant percentage errors (). This indicated that all the voids in the samples resulted in less area than the original voids, ranging from 45 to 75% less area overall, as shown in . T2 and S1 were the designs with voids with less average percentage error (52.15 and 51.36%, respectively). While S2 and S3 had the highest average values, 68.69 and 69.65%, respectively. The reduction in void area, expressed as a percentage error, might have affected the outcome of the mechanical properties. The latter is because for three-point bending tests, the textural profile can change when the concentration of material or thickness of the sample is modified. In consequence, part of the flexural changes of the post-processed samples might be related to the percentage error due to the decrease in the void area after post-processing. For instance, T2 presented the lowest percentage error and exhibited the lowest maximum load among all designs. A possible explanation could be that the shape and the distribution of the voids indeed have a relevant role in the flexural properties, as later discussed. In addition, due to the nature of a complex formulation (several ingredients with different carbohydrates, proteins, fat, and water), it is not uncommon to find some areas on the surface of the samples with a concentration of particles or particles of different nature, sizes, and shapes in the matrix (even after sieving and mixing the ingredients). The latter was recently demonstrated by Venkatachalam et al. [Citation37]. In their study, it was observed that starch, protein, and fibre were dispersed unevenly within the matrix at the microscopic scale. This could happen even if, at a macroscopic scale, the inhomogeneities were not visible. These uneven distributions can cause deviations in the uniformity of the printed product, but also in the interior of the final printed structure, especially when non-natively printable ingredients (such as fibrous plant material) are present in the formulation [Citation38]. The designs with this type of defect might be more susceptible to become stress concentrators, withstanding smaller loads or forces, and hence producing important mechanical failures. In this regard, a study evaluated the effects on the mechanical properties when a natively printable and homogenous synthetic polymer (such as polylactic acid, PLA) was combined with a not natively printable material (wood fibre) in 3D printing. In the study, the uneven composite material interaction (PLA-wood) and its fabrication process leaded to printed structures with defects, what made difficult the prediction of the mechanical properties of the samples [Citation39].
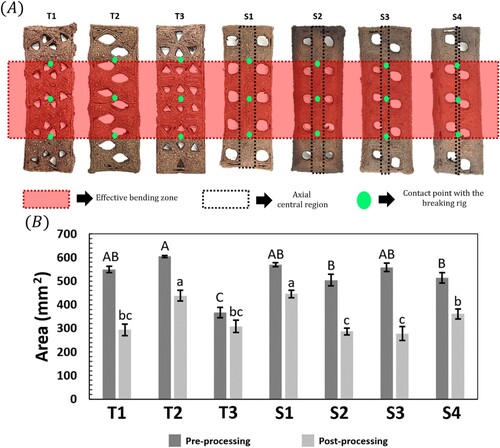
Figure 4. Analysis of the empty area by design, delimited by the support gap in the 3-point bending tests. (A) Representative empty area delimitation, (B) Average empty area before and after processing the samples. Within pre-processing, values with different capital letters are statistically different (p < 0.05), while for post-processing, values with different lowercase letters are statistically different (p < 0.05).
Besides the desired and controlled porosity in the structures tailored by the triangle and square shapes, another relevant aspect to consider is the inevitable porosity of the samples due to the swelling caused by the post-processing (food baking). As mentioned before, the empty area of the voids was modified from shrinking, due to the swelling of the material during the post-processing. In general, it is considered that changes in the porosity of the microstructure of the samples (due to dehydration and vaporisation) affect the product quality and mechanical properties (i.e. desired volume, stiffness, and texture profile of the product). In this regard, it has been reported that the texture profile can be modified from changes correlated to the thickness change due to the increase in porosity after post-processing [Citation36]. Since defects are more frequently encountered in materials with high inner porosity [Citation36,Citation39], it is probable that due to the swelling during post-processing, the inner porosity of the samples increased enough to be responsible for the variations observed in . Therefore, the defects, swelling, and variation in the distances between the voids produced a lack of homogeneity, affecting the mechanical properties.
Due to the influence of present moisture in the samples’ deformation along post-processing, the moisture content percentage was determined. No significant differences were observed among the samples with porosity topologies (ranging from 6.77 to 6.87%). The control sample was the model that presented the highest moisture content (6.91%) because no voids were present in its design. This allowed less water to evaporate from the samples during post-processing, possibly encased by a thicker film of baked material.
Additionally, the effective region involved during the 3-point bending test was also analysed as displayed in (A). This region is delimitated by the supports of the breaking rig in the texture analyser used during the tests (i.e. the distance between supports or support gap). Nominally, the negative space (i.e. the void area) created by the voids should have been the same among designs. However, due to the deformations explained before, the actual negative space is different between designs and is considerably reduced when post-processing, as it is observed in (B). Here the samples before post-processing (pre-processing) reached average empty areas above 500 mm2 (up to 604.8 mm2 for T2), except for T3 (367.2 mm2). When post-processed, the average void areas were around 278.16 and 445.8 mm2. The designs with a higher empty area were T2 and S1, with an average void area of 438.6 and 445.8 mm2, respectively. While the designs with the lowest average empty area were S2 and S3 (286.92 and 278.16 mm2, respectively). The designs with higher void area within the supports were the same as those with the lowest deviation from the original area, expressed as the average percentage error of voids in , in agreement with the fact that the voids shrink after processing [Citation19,Citation30]. Regarding the differences observed among the designs with triangle-shaped voids, it might be due to a printing limitation. With smaller void designs, the nozzle diameter used might be too large to accomplish those forms, hence a higher printing percentage error. Also, it might be that the size of the printed voids was smaller due to the swelling phenomenon in extrusion caused when the extruded formulation undergoes a tensile deformation through the shrinkage section of the nozzle diameter, storing elastic potential energy, which is released when the material exits the nozzle [Citation30]. Due to the latter, it is possible that the smaller the void, the higher the excess of material was extruded in proportion to the size of the void and a higher amount of new pores were formed during post-processing under the action of water vaporisation [Citation8,Citation19,Citation20]. A similar situation was observed regarding the differences among the designs with square-shaped voids. However, in this case, it appears that the higher amount of material present along the longitudinal central region of the structure (as represented in (A)), the lower the shrinkage when post-processing. Since the areas before post-processing were similar among them (between 504.6 and 569.52 mm2), even with different configurations, like between S2 and S3. But when post-processing, the areas for S2 and S3 decreased to 286.92 and 278.16 mm2, respectively. Nevertheless, when the edges of the structure become larger enough when compared to the central region (like in S4), it appeared that the void area was modified less (361.08 mm2 during post-processing).
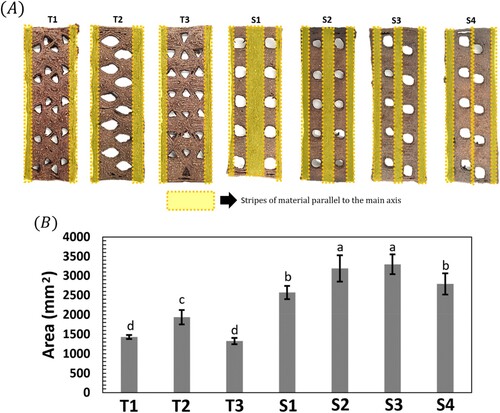
Besides the contribution of the void areas, results reported in other studies, such as Jungmann et al. [Citation40], showed that fracture formation appeared in specific zones of their structures. In those loading cases, the study correlated best the fractures with areas of elevated tensile strain parallel to the main axis of the samples. Therefore, the stripes of material parallel to the axial direction of the samples, as displayed in (A), were measured. The designs with the lowest average area covered by stripes were obtained in the designs with triangular voids (1432.35, 1936.75, and 1325.90 mm2; for T1, T2, and T3 respectively). On the other hand, designs with the highest average area correspond to those of the square voids (S1, S2, S3, and S4), with an area around 179 and 230% larger than that for T1. As shown in (B), significant differences in the areas for the corresponding stripes between designs with square and triangle voids can be observed. It is explained by the fact that the triangle-shaped voids do not allow the designs to have continuous stripes of material parallel to the main axis of the structures as it is for designs S1, S2, S3, and S3. When comparing the average area covered by the stripes for each design in (B) with the average maximum load in , it can be observed that the area of the stripes may be a relevant factor to increase the maximum load in some printed structures. For instance, T2 and T3, supported 6.96 and 10.91N, respectively. While S1 and S2, withstanded higher forces than that supported by T2 (223 and 189%, respectively) and T3 (142 and 121%, respectively). In these comparisons, it appeared that the larger area covered by the stripes increased the maximum load supported by the samples. However, this is not the same case when T1 (with 1432.35 mm2 and 9.08 N) was compared with S3 (with 3297.50 mm2 and 8.74 N). As in this case the higher area of the stripes in S3 is not increasing the amount of load supported in the bending test.
Figure 5. Analysis of the stripes of material parallel to the main axis. (A) Representative area delimitation for the stripes, (B) Average area covered by the stripes in the structures. Values with different lowercase letters are statistically different (p < 0.05).
These results might suggest that another factor is affecting the mechanical properties in the samples, besides the already mentioned. Probably related to the deformation during post-processing and prior to the mechanical testing. In this regard, photographs of the side view of the samples before the bending test started were inspected (as observed in Figure A3 of Appendix A). Here it can be observed that many samples resulted in a bent shape when post-processed (and prior mechanical testing), a more noticeable factor for designs with square-shaped voids. This pre-bending deformation of the samples is a similar effect observed in another study by He et al. [Citation41], where the spontaneous deformation, induced by post-processing, was determined by the bending angle of samples printed on a paper layer as a printing bed. The printed structure acted as an active layer, while the paper surface behaved as a passive layer, with negligible shrinkage, when post-processing. A similar condition happened to the post-processed structures in the current study, but to a lesser degree due to the higher height (multiple layers of material) of the samples. Here, the structures were printed on a silicon mat as a printing bed, and then baked under convection to induce dehydration of the printed sample/silicon bilayer structure. The depletion of water from the exterior layers of the printed structure could have led to water shifting from the interior layers to the exterior of the structure, as similarly reported by other studies [Citation20,Citation29,Citation30,Citation35,Citation36]. The latter formed a moisture gradient within the structures, as the water could not exit easily from the layers in contact with the silicon mat. The moisture gradient consecutively generated strain and stress that led the bilayer structure to modify its original structure (by bending) upward, always perpendicular to the printing orientation, similarly reported by He et al. [Citation41]. This spontaneous shape change during post-processing (from a planar to a curved structure) could be responsible for modifying the mechanical behaviour. In general, curved structures have a softer behaviour than planar structures. This is associated completely with the deformation mechanism that a curved structure experiences when subjected to transverse load. Under these loading conditions, a curved structure initially responds by straightening; thus, planar structures are stiffer [Citation42]. This is consistent with the results found for the stiffness of the designs with square-shaped voids in . S1, S2, S3, and S4 had a higher number of curved elements (curved area of stripes parallel to the main axis) that overall softened their structures. Lastly, the uniformity and defects of the printed layers stacking sequence were observed and compared between designs before the test from Figure A3. It can be noted that all designs had irregularities in their layers sequence, probably due to post-processing or printing limitations previously mentioned along the trajectories of the layers when the inner patterns were printed. However, designs with triangle-shaped voids appeared to have more irregularities, especially T2. These could have contributed to lower values for maximum load capacity for T2 (6.96 N) among all designs. In addition, T2 had the lowest stiffness among designs with triangle-shaped voids (61,373.87 N·mm²), as observed in . In general, the stacking of layers had a relevant participation in the mechanical properties of 3D printed products. For instance, not evenly distributed layers may provoke the material and the structure to fail to develop cohesion within its extruded layers [Citation39].
3.4. The role of voids geometry and distribution on the stiffness of 3D-printed structured samples
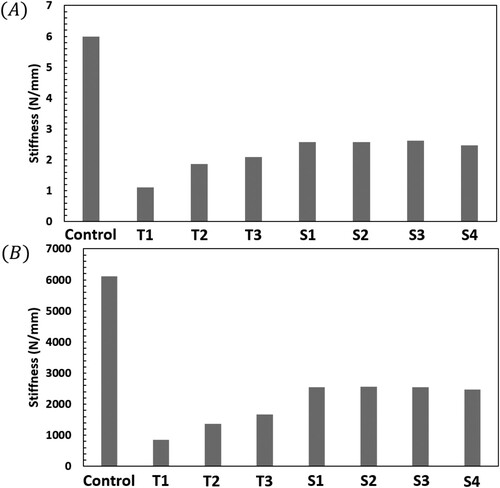
This section presents a qualitative evaluation of the role of the geometric and design parameters on the stiffness of porous rectangular bars. Note that being a qualitative comparison that only focuses on the linear regimen, the material properties of the computational models are inconsequential. This is with the aim of highlighting the possibilities in terms of tailoring the mechanical properties of architected media. To evaluate this, computational models of the porous rectangular bars were designed and subjected to two loading scenarios: (i) tension and (ii) bending (Cantilever beam). The results for stiffness are shown in . Therefore, from the results presented on both graphs, designs with triangular voids presented differences between them when changing the arrangement configuration. For instance, the stiffness found for the cantilever simulations was around 18.56 and 35.05%; for T1, T2, and T3, respectively. While the stiffness found for the tension simulations was around 13.84 and 27.19% for the same designs. However, designs with square-shaped voids only presented slight differences between them, even when changing the configuration. In the cantilever test simulations, the stiffness values for S1, S2, S3, and S4 were between 41.30 and 43.64%. While the stiffness values for the same designs in the tension test simulations were between 40.50 and 41.87%. Also, according to the simulation results, the designs with voids with a square shape displayed higher stiffness values, which were up to 43.64 and 41.87% for cantilever and tension tests, respectively. Regarding designs with triangle-shaped voids, T1 displayed the lowest stiffness among all the designs with voids (18.56 and 13.84% for cantilever and tension, respectively).
Figure 6. Stiffness with AnsysWorkbench for (A) Cantilever and (B) Tension tests, simulated for all designs.
To explain this behaviour, a relationship between the void shape and its distribution in the structure must be addressed [Citation43]. Overall, depending on the void configuration (shape and distribution), the designs can be grouped into three different categories, i.e. axial, transverse, and diagonal. The analysis of such arrangements could be treated analogously to what is encountered in additively manufactured samples fabricated via Fused filament fabrication. In such, structures are formed from the arrangement of rasters (i.e. patterns consisting of parallel lines extruded back and forth across a printed layer) [Citation44,Citation45]. These rasters influenced considerably in the stress distribution, each contributed to a different degree to the overall stiffness of the designs. For instance, rasters which were parallel to the main axis during the test (arranged axially), had a stronger influence on the stiffness of the samples [Citation42]. The mentioned material distribution can be observed in and can be validated by observing the stress map distribution created in the simulations for the evaluated designs (). When a material stripe is parallel to the axial direction, this results in a more significant participation in their stiffness. These are mostly subjected to tension and compression (cantilever), visualised as brighter colourations in the stress map. In addition, diagonal stripes did contribute to the overall stiffness of the designs. However, diagonal rasters only had a partial participation in the stress distribution when compared to axial ones, as it can be seen in . Also, when comparing the stress distribution of (B)T3 with (B)T1 and (B)T2, it seemed that the angle of the diagonal stripes has an important role, since stripes oriented more to the applied force ((B)T3) participated more than those oriented more in a perpendicular way ((B)T1 and 8(B)T2). Here, it appears that the angle with respect to the main axis in which the diagonal stripes are distributed (as described in ) will affect how the continuity of the material will participate when a force is applied to the porous structure. Those stripes in T3 are closer to be parallel to the main axis than those in T1 and T2. However, this does not mean that those in T1 and T2 (closer to be orthogonal to the main axis) will not participate in withstanding the load. This could explain why T1 presented the lowest stiffness among structures with triangle-shaped voids since the diagonal stripes were also narrow. Designs with a higher number of stripes oriented in a parallel way to the main axis were stiffer when compared to designs with a higher number of stripes oriented in a perpendicular or diagonal way. Regardless of the existence of perpendicular or diagonal stripes, the higher magnitudes were always present for axial stripes. Additionally, it can be observed that the thinner is the axial stripe, the higher the stress concentration in it. What suggested that these sections were vulnerable points in the structure and the quantity of material influenced the mechanical properties. For that reason, (B)S1 (with thicker rasters) displayed the highest values for stiffness in .
Figure 7. Representations of the continuity lines of the material along the designs, oriented parallel and diagonal to the main axis.
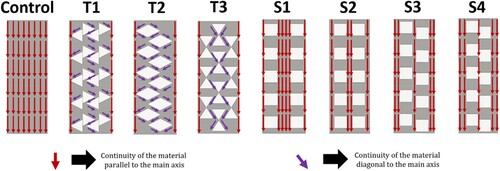
Figure 8. Stress map distribution top views for (A) Cantilever test simulation, (B) Tension test simulation and (C) Top side views for S1 and T1 in the cantilever test. In all tests, the force applied is located to the right side of the structures.
It is important to notice that besides the stress distribution, the continuity of the material along the designs performed an important role in the stiffness of the sample, especially when oriented in the same direction as the applied force, as represented in . In , in all designs where the continuity of material was not interrupted by a void, the stress tended to distribute at a larger scale along the structure, regardless of the shape of the voids. For (B)T1 and (B)T2, the triangular voids were distributed in such a way that the stress was only localised at the sides of the structures as similarly observed in and (B)S4, where the square-shaped voids interrupted the continuity of the material in the central part of the design.
On the other hand, if the continuity remained, as in (B)T3, 8(B)S1, 8(B)S2, and 8(B)S3, the stress distribution along the sample appeared to be higher. Even in those cases, zones of minimum stress appeared too but considerably less, located only right next to the void and if oriented in a perpendicular way to the applied force (). For (B)Control, the absence of voids demonstrated that the applied force was distributed in the whole structure since the continuity was never interrupted along the design. These findings corresponded to the behaviours observed for stiffness in . The stress map distribution also validated that the lowest values (T1 with 1.11 and 846.06 N/mm; for cantilever and tension simulations, respectively) were represented by those designs where the continuity of the material was interrupted, and the rasters had a more perpendicular orientation ((B)T1 and 8(B)T2). On the other hand, the stress maps for the square-shaped designs, also validated the results for stiffness shown in , as S4 had a negligible reduction in stiffness when compared to S1, S2, and S3. The latter, mainly because Figures 8S1, 8S2, 8S3, and 8S4 had a similar void configuration, the same material continuity, and the same rasters orientation. Computational and numerical models could become more useful if the material property is well characterised. Properties such as Young’s modulus need to be fed into the software, but these are challenging to be obtained as it is known that the 3D printing process might alter them. An accurate finite element model demands a material property to be previously characterised.
The results suggested that the porosity topology allows the formation of subregions in the total area of the structures with a less or higher distribution of material. This meant that, depending on the topology, different interconnected regions covered with the material could be formed. The bigger these interconnected areas of material are present on the structure and the more oriented (parallel) towards the main axis, the higher the stiffness can be observed in the simulations ().
4. Conclusions
In this work, the mechanical properties of printed and post-processed designs with different porosity topologies were evaluated. 3-point bending tests, simulations, and image analysis based on previous literature were performed to evaluate the texture parameters that should be considered when 3D printing and post-processing food.
According to the experimental results, in general, designs with square-shaped voids appeared to present higher strength and less flexural stiffness when compared to those with triangle-shaped voids. But according to the simulations different behaviours were observed. The differences found in the properties displayed in the simulations against the observed experimental values might be related to printing limitations and post-processing. In this regard, an important factor was the deformation of the voids observed in the post-processed samples, caused by the swelled material, since the simulations used the original designs with ideal (no defects) voids. For instance, the round shapes of the post-processed voids might have altered the orientation of the rasters, led to a modified distribution of the stress along the structure, and consequently differed from that of the original designs. Additionally, the porosity topology created interconnected subregions of material in the total area of the structures, the larger the subregions of material and the more parallel towards the main axis, the higher the stiffness. Another observed factor that modified the strength and stiffness was the spontaneous bending of the whole structure during post-processing, since pre-bended structures used in the 3-point bending tests resulted to be softer than the original designs (planar structures) used in the simulations.
The potential of F3DP to modify the mechanical characteristics of post-processed food must be considered in order to obtain different sensorial perceptions of consumers provided by the variation in the internal structure patterns. In this regard, the main challenge associated with developing different textures for food personalisation is the proper characterisation and prediction of the mechanical properties for different porosity topologies. The latter requires enough knowledge of the effects of the mechanical properties when designing topologies, printing, and post-processing, which allows to effectively reproduce it for new personalised textures. The achieved knowledge from this research can be implemented to guide future food texture personalisation in posterior food 3D printing studies to improve the customisation of its mechanical properties. The obtained insights could be used as a precedent to design novel topologies with the aid of software simulations as better options in the development of tailored textures in food 3D printing.
Acknowledgments
This research was funded by L'Oréal-UNESCO-AMC For Women in Science 2020 Scholarship, Bio-Foods Research Lab at Tecnológico de Monterrey campus Querétaro, and Mexico’s CONACYT Scholarship Program for first author support (N° CVU: 1048007). Instant Pure Flo F and cricket flour were kindly donated by Ingredion and Griyum, respectively.
Disclosure statement
No potential conflict of interest was reported by the authors.
Data availability statement
Data available on request from the authors.
Additional information
Funding
References
- Sun J, Peng Z, Zhou W, et al. A review on 3D printing for customized food fabrication. Procedia Manuf. 2015;1:308–319. doi:10.1016/j.promfg.2015.09.057
- Yemenicioğlu A, Farris S, Turkyilmaz M, et al. A review of current and future food applications of natural hydrocolloids. Int J Food Sci Technol. 2020 Apr;55(4):1389–1406. doi:10.1111/ijfs.14363
- Le-Bail A, Maniglia BC, Le-Bail P. Recent advances and future perspective in additive manufacturing of foods based on 3D printing. Curr Opin Food Sci. 2020;35:54–64. doi:10.1016/j.cofs.2020.01.009
- Le Tohic C, O’Sullivan JJ, Drapala KP, et al. Effect of 3D printing on the structure and textural properties of processed cheese. J Food Eng. 2018;220:56–64. doi:10.1016/j.jfoodeng.2017.02.003
- Voon SL, An J, Wong G, et al. 3D food printing: a categorised review of inks and their development. Virtual Phys Prototyp. 2019 Jul;14(3):203–218. doi:10.1080/17452759.2019.1603508
- Mantihal S, Prakash S, Bhandari B. Texture-modified 3D printed dark chocolate: sensory evaluation and consumer perception study. J Texture Stud. 2019 Oct;50(5):386–399. doi:10.1111/jtxs.12472
- Pant A, Ni Leam PX, Chua CK, et al. Valorisation of vegetable food waste utilising three-dimensional food printing. Virtual Phys Prototyp. 2023 Dec;18(1):e2146593. doi:10.1080/17452759.2022.2146593
- Feng C, Zhang M, Liu Z, et al. Effect of drying method on post-processing stability and quality of 3D printed rose-yam paste. Drying Technol. 2021 Jun 1;39(9):1196–1204. doi:10.1080/07373937.2020.1851708
- Liu Z, Bhandari B, Prakash S, et al. Creation of internal structure of mashed potato construct by 3D printing and its textural properties. Food Res Int. 2018;111:534–543. doi:10.1016/j.foodres.2018.05.075
- Zhu S, Ruiz de Azua IV, Feijen S, et al. How macroscopic structure of 3D printed protein bars filled with chocolate influences instrumental and sensory texture. LWT. 2021;151:112155. doi:10.1016/j.lwt.2021.112155
- Huang Ms, Zhang M, Bhandari B. Assessing the 3D printing precision and texture properties of brown rice induced by infill levels and printing variables. Food Bioproc Tech. 2019;12(7):1185–1196. doi:10.1007/s11947-019-02287-x
- Le Tohic C, Sullivan O, Drapala JJ, et al. Effect of 3D printing on the structure and textural properties of processed cheese. J Food Eng. 2018;220:56–64. doi:10.1016/j.jfoodeng.2017.02.003
- Vancauwenberghe V, Delele MA, Vanbiervliet J, et al. Model-based design and validation of food texture of 3D printed pectin-based food simulants. J Food Eng. 2018;231:72–82. doi:10.1016/j.jfoodeng.2018.03.010
- Pérez-Castillo JL, Mora A, Perez-Santiago R, et al. Flexural properties of lattices fabricated with planar and curved layered fused filament fabrication. Materials. 2023;16(9):3451. doi:10.3390/ma16093451
- Lille M, Nurmela A, Nordlund E, et al. Applicability of protein and fiber-rich food materials in extrusion-based 3D printing. J Food Eng. 2018;220:20–27. doi:10.1016/j.jfoodeng.2017.04.034
- Dick A, Bhandari B, Dong X, et al. Feasibility study of hydrocolloid incorporated 3D printed pork as dysphagia food. Food Hydrocoll. 2020;107:105940. doi:10.1016/j.foodhyd.2020.105940
- Dankar I, Haddarah A, Omar FEL, et al. 3D printing technology: The new era for food customization and elaboration. Trends Food Sci Technol. 2018;75:231–242. doi:10.1016/j.tifs.2018.03.018
- Hussain S, Malakar S, Arora VK. Extrusion-Based 3D food printing: technological approaches, material characteristics, printing stability, and post-processing. Food Eng Rev. 2022;14(1):100–119. doi:10.1007/s12393-021-09293-w
- Severini C, Derossi A, Azzollini D. Variables affecting the printability of foods: preliminary tests on cereal-based products. Innovat Food Sci Emerg Techn. 2016;38:281–291. doi:10.1016/j.ifset.2016.10.001
- Liu Z, Dick A, Prakash S, et al. Texture modification of 3D printed air-fried potato snack by varying its internal structure with the potential to reduce oil content. Food Bioproc Tech. 2020;13(3):564–576. doi:10.1007/s11947-020-02408-x
- Cuan-Urquizo E, Bhaskar A. Flexural elasticity of woodpile lattice beams. Eur J Mech A, Solids. 2018 Jan 1;67:187–199. doi:10.1016/j.euromechsol.2017.09.008
- Maldonado-Rosas R, Tejada-Ortigoza V, Cuan-Urquizo E, et al. Evaluation of rheology and printability of 3D printing nutritious food with complex formulations. Addit Manuf. 2022;58:103030. doi:10.1016/j.addma.2022.103030
- U.S. Department of Health and Human Services and U.S. Department of Agriculture. 2015–2020 Dietary Guidelines for Americans [Internet]. 2015. Available from: http://health.gov/dietaryguidelines/2015/guidelines/.
- Vásquez-Garibay EM, Romero-Velarde E. Esquemas de alimentación saludable en niños durante sus diferentes etapas de la vida: parte II. Preescolares, escolares y adolescentes. Boletín médico del Hospital Infantil de México. Scielomx. 2008;65:605–615.
- U.S. Department of Agriculture. Food Data Central. 2019. Agricultural research service. Available from: https://fdc.nal.usda.gov/index.html.
- Sarker U, Hossain MM, Oba S. Nutritional and antioxidant components and antioxidant capacity in green morph amaranthus leafy vegetable. Sci Rep. 2020 Jan;10(1):1336, Available from: https://pubmed.ncbi.nlm.nih.gov/31992722.
- AOAC (Association of Official Analytical Chemists). Official methods of analysis. 16th ed. Washington DC: Association of Official Analytical Chemists; 1999.
- Maldonado-Rosas R, Tejada-Ortigoza V, Cuan-Urquizo E, et al. Evaluation of rheology and printability of 3D printing nutritious food with complex formulations. Addit Manuf. 2022;58:103030, Available from: https://www.sciencedirect.com/science/article/pii/S2214860422004225.
- Severini C, Azzollini D, Albenzio M, et al. On printability, quality and nutritional properties of 3D printed cereal based snacks enriched with edible insects. Food Res Int. 2018;106:666–676. doi:10.1016/j.foodres.2018.01.034
- Feng C, Zhang M, Bhandari B, et al. Use of potato processing by-product: effects on the 3D printing characteristics of the yam and the texture of air-fried yam snacks. LWT. 2020;125:109265. doi:10.1016/j.lwt.2020.109265
- He C, Zhang M, Devahastin S. Investigation on spontaneous shape change of 4D printed starch-based purees from purple sweet potatoes As induced by microwave dehydration. ACS Appl Mater Interfaces. 2020 Aug;12(34):37896–37905. Available from. doi:10.1021/acsami.0c10899
- Gholamipour-Shirazi A, Norton IT, Mills T. Designing hydrocolloid based food-ink formulations for extrusion 3D printing. Food Hydrocoll. 2019;95:161–167. doi:10.1016/j.foodhyd.2019.04.011
- Tan C, Toh WY, Wong G, et al. Extrusion-based 3D food printing – materials and machines. Int J Bioprint. 2018;4(2):143. doi:10.18063/ijb.v4i2.143
- Tejada-Ortigoza V, Cuan-Urquizo E. Towards the development of 3D-printed food: a rheological and mechanical approach. Foods. 2022;11. doi:10.3390/foods11091191
- Yang F, Zhang M, Liu Y. Effect of post-treatment microwave vacuum drying on the quality of 3D-printed mango juice gel. Drying Technol. 2019 Oct 26;37(14):1757–1765. doi:10.1080/07373937.2018.1536884
- Kim HW, Lee IJ, Park SM, et al. Effect of hydrocolloid addition on dimensional stability in post-processing of 3D printable cookie dough. LWT- Food Sci Techn. 2019;101:69–75. doi:10.1016/j.lwt.2018.11.019
- Venkatachalam A, Balasubramaniam A, Wilms PFC, et al. Impact of varying macronutrient composition on the printability of pea-based inks in extrusion-based 3D food printing. Food Hydrocoll. 2023;142:108760. doi:10.1016/j.foodhyd.2023.108760
- Wen Y, Chao C, Che QT, et al. Development of plant-based meat analogs using 3D printing: status and opportunities. Trends Food Sci Technol. 2023;132:76–92. doi:10.1016/j.tifs.2022.12.010
- Cuan-Urquizo E, Álvarez-Trejo A, Robles Gil A, et al. Effective stiffness of fused deposition modeling infill lattice patterns made of PLA-wood material. Polymers (Basel). 2022;14. doi:10.3390/polym14020337
- Jungmann R, Szabo ME, Schitter G, et al. Local strain and damage mapping in single trabeculae during three-point bending tests. J Mech Behav Biomed Mater. 2011;4(4):523–534. doi:10.1016/j.jmbbm.2010.12.009
- He C, Zhang M, Devahastin S. Investigation on spontaneous shape change of 4D printed starch-based purees from purple sweet potatoes as induced by microwave dehydration. ACS Appl Mater Interfaces. 2020 Aug;12(34):37896–37905. doi:10.1021/acsami.0c10899
- Pérez-Castillo JL, Mora A, Perez-Santiago R, et al. Flexural properties of lattices fabricated with planar and curved layered fused filament fabrication. Materials. 2023;16(9):3451. doi:10.3390/ma16093451
- Popescu D, Zapciu A, Amza C, et al. FDM process parameters influence over the mechanical properties of polymer specimens: a review. Polym Test. 2018;69:157–166. doi:10.1016/j.polymertesting.2018.05.020
- Huang B, Singamneni S. Curved layer fused deposition modeling with varying raster orientations. Appl Mechan Mater. 2014;446–447:263–269. doi:10.4028/www.scientific.net/AMM.707.263
- Masood SH. 10.04 – advances in fused deposition modeling. In: Hashmi S, Batalha GF, Van Tyne CJ, editors Y BBTCMP Oxford: Elsevier; 2014. p. 69–91.
Appendix
Appendix contains complementary figures to clarify information related to measurements and observations. shows representations of the locations where pictures of the samples were analysed using a magnification of 50×. represents the image characterisation of post-processed samples.
Figure A1. Representations of the locations where pictures of the samples were analysed using a magnification of 50× (A and C) and without it (B and D). For designs T1 (A and B) and S2 (C and D).
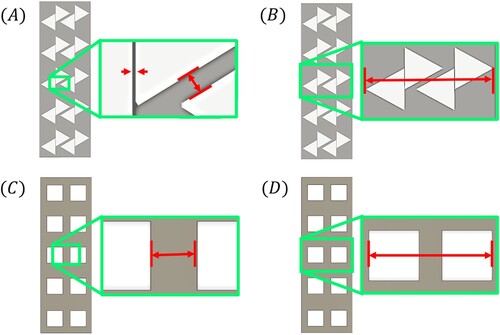
Figure A2. Image characterisation of post-processed samples. All dimensions are expressed in millimetres. (A) Representative images of all samples with no magnification, exhibiting the distance covered by the region with voids and defects in their shapes. (B) Representative optical micrographs with 50× magnification and displaying the distance between the voids. All images correspond to the top side of the samples.
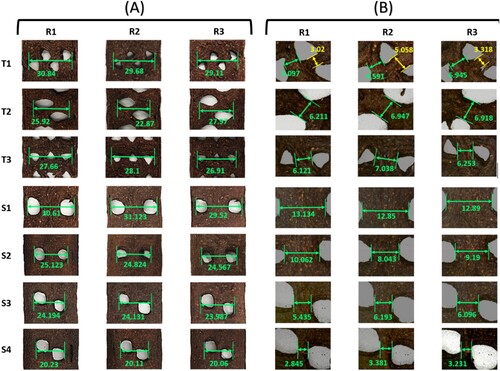
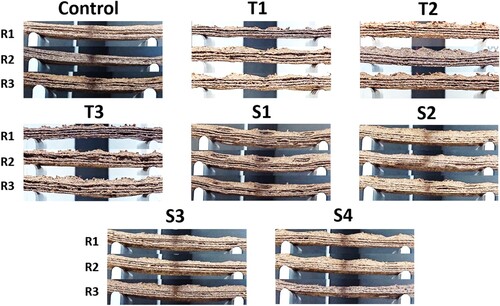
shows comparative side views for every replicate per design before 3-point bending test.
Figure A3. Comparative side views for every replicate (R1, R2 and R3) per design before 3-point bending test.