
 ?Mathematical formulae have been encoded as MathML and are displayed in this HTML version using MathJax in order to improve their display. Uncheck the box to turn MathJax off. This feature requires Javascript. Click on a formula to zoom.
ABSTRACT
The optimisation of selective laser sintering (SLS) of polymeric materials, based on analytical equations providing fast predictions, can broaden the SLS application area. However, the selection of SLS polymeric materials is currently rather limited, due to specific requirements regarding sufficient flowability and limited molecular degradation. The present work highlights that upgrading existing analytical equations, by incorporating a well-calculated overlay factor and correcting for pre-heating starting at ambient conditions, can accelerate SLS screening. Model validation is performed based on density, colorimetric, morphological and mechanical analysis of printed parts, focusing on the prediction of the laser power which corresponds to the onset of degradation, taking polyamide powder as a reference case. Furthermore, the optimised model is successfully applied for two other polymer powders, namely thermoplastic co-polyester and thermoplastic polyurethane powder, to highlight a better overall description of the SLS degradation mechanism.
Introduction
The development and optimisation of additive manufacturing (AM) processes enable their broader application [Citation1–3]. One already has many interesting developments for fused filament fabrication [Citation4–7], pellet-based AM [Citation8,Citation9], binder jetting [Citation10], material jetting, stereolithography [Citation11], VAT photopolymerisation [Citation12,Citation13] and powder bed fusion (PBF) [Citation14–17], with applications such as customised end-use parts [Citation18,Citation19], rapid prototyping and tool development for short production runs. Specifically, for PBF with polymers, which is known as selective laser sintering (SLS), a challenge is still to make more complex shapes for more materials, and to work toward AM multimaterials [Citation20,Citation21]. This requires a better combination of model and experimental development [Citation22], as addressed in the present work.
The range of materials processed through polymeric SLS is currently limited to polyamide 12 (PA12) [Citation23] and to a smaller extent to polyether ether ketone [Citation24,Citation25], thermoplastic polyurethane (TPU), other polyamides such as polyamide 6 (PA6) and polymers such as ultra high molecular weight polyethylene [Citation26].
The development of new SLS materials is hampered due to the dedicated requirements for molecular and material properties, e.g. one needs (i) a stable sintering window to achieve a uniform melt phase without significant degradation of the material [Citation27,Citation28] and (ii) a super cooling window to keep the molten material in a semi-solid state, after which the molten particles can be cooled down in a uniform manner to control the crystallisation and shrinkage of the final product [Citation29,Citation30]. One further needs to conduct SLS with a tuned particle size distribution (PSD) and based on a controllable interaction of the material with the laser [Citation31–33]. Particularly, Kruth et al. [Citation34] stated the importance of adjustable printing parameters [Citation35] such as laser power and scan speed, powder characteristics, i.e. particle size, mixture ratio and machine properties, i.e. laser wavelength and spot size [Citation36], for the quality of produced parts.
To facilitate this identification of new SLS materials and associated optimal printing conditions theoretical developments are worthwhile [Citation37–40], that has also been shown for metal-based selective laser melting (SLM) focusing, for instance, on the dross formation [Citation41]. The main challenge is although to better account for physical and chemical interactions [Citation33,Citation42–44] to unify material screening. The powder flowability [Citation45], PSD [Citation46] and particle morphology [Citation47,Citation48] have already been recognised by several modelling studies [Citation49–53] as important properties of polymer powders for successful application in SLS. However, the effect of the polymer particle size and morphology on the laser light transmittance, absorption and reflection is typically not taken into account in modelling work.
A key theoretical contribution has been put forward by Laumer et al. [Citation54], who compared the optical properties of polyethylene powder with those of polyamide (PA) powder. It was shown that PA (powder) has a much higher absorbance at a wavelength of 10.6 µm, which led to the conclusion that PA is more suitable as typically laser sintering systems work at that particular wavelength [Citation55,Citation56]. Furthermore, Osmanlic et al. [Citation57] presented an absorption model to conclude that a refractive index (n) larger than 1 leads to high reflection at the atmosphere–powder interface. The model outcome was in good agreement with the Lambert–Beer equation for the particle transmittance τp:
(1)
(1) in which α represents the attenuation coefficient of the material, lp is the thickness of the sample, I is the intensity, I0 is the initial intensity and A is the absorption.
Xin et al. [Citation58] used a Monte Carlo ray-tracing model to follow energy bundles combined with the discrete element method to create a framework for the functional validation of the SLS methodology. Fan et al. [Citation59] concluded that the effect of the particle size and packing factor significantly affects the reflectance, while the transmittance at a layer thickness of 100 µm is very low. The latter authors also showed that Equation (1) provides a reasonably good approximation of the experimental results.
Interestingly, Vasquez et al. [Citation28] proposed more pragmatic equations to calculate the energy for melt (Em) [J·mm−3] and the energy for degradation (Edeg) [J·mm−3]:
(2)
(2)
(3)
(3) in which Cp [J·(°C·g)−1] is the specific heat capacity of the material, Tm [°C] is the melt temperature, Tb [°C] is the bed temperature, ΔHm [J·g−1] is the melting enthalpy, ρ [g·cm−3] is the specific density, Ф [-] is the packing factor, Tdeg,Onset [°C] is the onset degradation temperature, EA [J·mol−1] is the (overall/apparent) activation energy for degradation and Mm [g·mol−1] is the mass average molar mass of the material.
The calculated energies were then used by Vasquez et al. [Citation28], Starr et al. [Citation60] and several other researchers [Citation61] in combination with the volume energy density (EDvol [J·mm−3]) [Citation62] to calculate the energy melt ratio (EMR [-]) and the energy melt ratio for degradation (EMRD [-]):
(4)
(4)
(5)
(5)
(6)
(6)
in which P is the laser power [W], S is the scan spacing [mm], v is the scan speed [mm·s−1] and z is the layer thickness [mm].
Very recently Vande Ryse et al. [Citation32] updated Equation (3) by including the packing factor Ф (Equation (7)) so that the mass considered in the equations for Em and Edeg is kept constant, as was suggested in the work of Lupone et al. [Citation63]. Vande Ryse et al. [Citation31,Citation32] also derived Equation (8) and (9) for calculating the laser power for degradation, explicitly accounting for reflection and absorption and the maximal particle temperature (Tmax), based on experimentally determined material properties such as a particle volume (size) Vp [mm3], the projected area of the particle (Arp [mm2]), the specific heat capacity of the solid and melt phase (Cp,solid and Cp,melt, respectively), the hemispherical particle reflectance Rp [-], τp [-] and the reflectance of the molten volume (R [-]), and process specific parameters such as the exposure time of the laser (tex [s]) and the projected area of the laser beam (Arb [mm2]).
(7)
(7)
(8)
(8)
(9)
(9)
To solve Equations (8) and (9), Equation (1) is utilised to predict τp, while Rp is obtained through the equations highlighted by Myers et al. [Citation64]:
(10)
(10)
(11)
(11) in which dp is the particle diameter, S is the external scattering coefficient, being a function of n and θ is the angle between the normal direction and the incident beam.
Notably, the more detailed recent set of equations (Equation (7)–(11)) allows for more accurate predictions of PD, considering thermoplastic co-polyester (TPC) [Citation32] and TPU [Citation31]. However, it was also stated by Vande Ryse et al. that compared to the experimental results the model predictions still overestimate PD. Hence, the model of Vande Ryse et al. [Citation32] should be further updated to increase the accuracy of the predicted PD and to highlight that such an updated equation set offers an adequate estimation for a broad range of polymeric SLS materials.
In the present work, we perform such updates and via colorimetric, mechanical, density and morphological measurements. The updated model is validated for PA2200, TPU and TPC. A good agreement with the experimental results can be claimed, by showing that above PD the mechanical properties of the printed samples are less than maximally achievable. It is also highlighted that the updated equations can assess the main physical phenomena present during SLS, opening the way for more rapid development of new materials that can be used within this promising AM technology platform based on analytical equations.
Materials and experimental characterisation methods
Materials
SLS is studied with semi-crystalline PA12 grade PA2200 (EOS GmbH, Electro Optical Systems, Krailing, Germany), TPC Amphora™ 3D Polymer SP1621 (Eastman Chemical Company) and TPU grade TPU90A (Morphene3D). These material grades are especially produced for SLS and are most commonly used with a refresh rate of 50-50. During the validation of the updated model utilising in this work recorded experimental data for PA12, however, only fresh non-aged powder was used. For the other two SLS polymers, the procedure was similar but experimental data were taken from our previous work [Citation31,Citation32].
The technical datasheet of the PA12 grade states a tensile modulus of 1650 MPa, an elongation at break of 18%, a tensile strength of 48 MPa, a melting temperature of 176°C and a specific density of 930 kg·m−3. The refractive index (n) for PA12 was taken as 1.53, according to the literature data [Citation65].
Characterisation methods
Thermal characterisation, to enable input parameters on melting behaviour in the analytical model, was performed through differential scanning calorimetry (DSC) and thermogravimetric analysis (TGA), using a Netsch DSC 214 and a Netsch STA 449 F3, respectively. Tests were performed under nitrogen (N2) atmosphere, with a flow rate of 40 ml·s−1 for DSC and 50 ml·s−1 for TGA, and a heating rate of 10 K·min−1 according to the standards ISO 11357-1 (see Figure S3 in the supporting information) and ISO 11358-1 (see Figure S1 in the supporting information). All samples had a mass of ca. 10 mg. The specific heat capacity (Cp) was measured according to the ASTM E1269 standard in a Netsch DSC 214 (see Figure S4 in the supporting information).
The overall (apparent) activation energy of degradation (EA) was calculated according to ASTM E1641-16 through means of the Ozawa–Flynn–Wall method [Citation66], from TGA measurements with heating rates (β) of 2.5, 4, 6.5 and 10 K·min−1.
For PA2200, the DSC measurements revealed a Cp,solid value of 3.49 ± 0.094 [J·(g·°C)−1] at 160°C (close to the printing bed temperature) and a Cp,melt value of 2.66 ± 0.051 [J·(g·°C)−1] at 220°C (in fully molten state). The powder showed a melting peak temperature of 182.8°C and a melting enthalpy of 104.1 J·g−1. The TGA measurements delivered an EA value of 137.15 kJ·mol−1, with a TDeg,onset of 408.2°C, while the 1% mass loss degradation temperature (TDeg,1%) was determined as 337.3°C. The temperature profiles used for the TGA and DSC measurements and the corresponding curves for heating rates (β) of 2.5, 4, 6.5 and 10 K·min−1 can be found in the Supporting Information (see Figure S2).
For Fourier transform infrared (FTIR) analysis, compression moulded samples (sheets) were made from the powder material at 210°C with a force of 150 kN (3 samples) and 100 kN (3 samples), considering material drying at 60°C for at least 8 h. The sheets were analysed in a Tensor 27 FTIR spectrometer (Bruker) in a transmittance mode in the interval of 1100–800 cm−1, using a resolution of 1 cm−1 and 32 scans per sample. In total, 18 sheets were analysed with thicknesses ranging from 37.8 to 232 µm. The thicknesses of the sheets were measured at five different points of each sheet using a micrometer gauge, after which the average of the five measurements was used for further calculations.
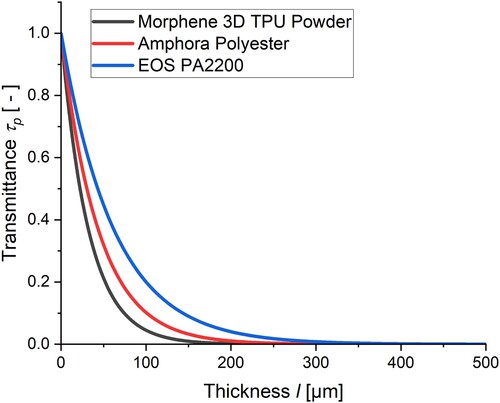
The absorption and transmittance were calculated for light with a wavenumber of 943.2 cm−1, as this wavenumber coincides with a wavelength λ = 10.6 µm, which is the working wavelength of the CO2 laser used for the laser sintering machine. The FTIR results for PA revealed an α value of 16,064 ± 2,328 m−1. The resulting transmittance, as calculated by the Lambert–Beer law (Equation (1)), is shown in (blue line) alongside the transmittance curves of the previous studies for TPC (Amphora; red line) [Citation32] and TPU (TPU90A; black line) [Citation31]. The comparison of the three curves allows to deduce that the PA2200 powder will transmit a higher amount of laser light compared to the TPC or TPU material, as these materials showed α values of (22.8 ± 1.8)·103 and (31.0 ± 3.8)·103 m−1, respectively. The raw data can be found in the Supporting Information (see Figure S5 and Figure S6).
Figure 1. Modelling of the transmittance based on the Lambert–Beer–Bourguer law, using τp as measured via FTIR.
Optical microscopy (VHX-7000, Keyence) coupled with ImageJ software was used to assess the particle sizes and PSD based on the perimeter of each particle. A translation to a spherical analogue was always made.
The morphology of samples was investigated by scanning electron microscopy (SEM) (Phenom Pro, Thermofischer, Waltham, MA, USA). Samples were prepared for SEM by submersion in liquid nitrogen (−196°C) for 2 min, after which they were fractured. The fracture surfaces were then analysed after recording SEM images. Note that SEM was not needed for the particle size analysis as the magnification and resolution of the optimal microscope could offer a fast and sufficiently reliable approach.
Colorimetric tests were conducted in an UltraScan VIS spectrophotometer with a CIE 1963 standard colorimetric observer (10°) and a D65 Illuminant. Calculations for the Whiteness Index (WI) and Yellowness index (YI) were performed according to ASTM E313, dealing with CIE Tristimulus values Xc, Yc and Zc:
(12)
(12)
(13)
(13) in which x and y are the chromatic coordinates of the specimen and the dimensionless constants were selected according to the standard for the D65 Illuminant and CIE 1964 colorimetric observer: Cx = 1.3013, Cz = 1.1498, xn = 0.3138, yn = 0.3310, WIx = 800 and WIy = 1700.
Density results were obtained using the Archimedes method, with a Precisa Analytical balance, according to the ISO 1183-1, method A, using ethanol as the submersion liquid.
Mechanical testing, i.e. tensile tests and flexural tests were performed on an Instron 5565 and an Instron 4464 machine according to ISO 527 and ISO 178, respectively.
Printing specifications
The PBF process [Citation67] can be split up based on the materials used, e.g. SLM for metals [Citation68–72] and SLS for polymers [Citation32,Citation73,Citation74] or based on how the sintering is achieved, e.g. high speed sintering [Citation75]. In the present work, we deal with SLS.
All samples were printed on an SLS EOS P10 (EOS GmbH) machine with a layer thickness (z) of 100 µm, a bed temperature (Tb) of 169°C, a removal chamber temperature (Trr) of 145°C and laser power (P) within the range of 8–25 W. An overview of the printing parameters is shown in . The EOS P10 machine is equipped with a CO2 laser with a wavelength (λ) in the range of 10.2–10.8 µm and a spot size of 0.42 mm. As highlighted above, λ = 10.6 µm was utilised.
Table 1. Experimental SLS parameter settings.
For printing, the parts were equally distributed along the print bed and along the height of the building platform, taking into account that every part was far enough away from the sides or other parts within the print bed. The scan count (C) was kept constant at one during every print made.
Small blocks of 10 × 10 × 10 mm were first printed according to the settings mentioned in column 2 (1st print). These parts were used to measure density and colorimetric properties. During the 2nd print (column 3 in ) ISO standardised tensile and flexural bars were printed to measure the mechanical properties depending on the printing settings.
Every sample was printed with a printing direction parallel to the printing bed (XY-plane) and with a constant layer thickness of 0.100 mm. For every print, virgin polymer powder was used.
Results and discussion
In this section, firstly the theoretical optimisations for PD are elaborated highlighting the independent variables as for instance linked to thermal properties. These optimisations are based on previous studies [Citation33,Citation39,Citation40,Citation76], which identified physical phenomena that are lacking in commonly used models. Secondly, the measured PSD for PA is discussed and it is highlighted to perform proper averaging, specifically to account for the smaller particle sizes. Thirdly, the experimental relation between laser power and the properties of the printed parts is investigated. Finally, the optimised analytical model as well as other literature analytical models are compared to the experimentally found values for the onset degradation laser power. Attention is also paid here on SLS with TPU and TPC.
Model development
For the model optimisation, the starting equation is Equation (8), as recently developed by Vande Ryse et al. [Citation32]. A differentiation is made regarding two optimisation phases. In the first optimisation phase, we consider an overlay factor Coverlay, as proposed by Pilipović et al. [Citation39,Citation40]. This overlay factor was considered by these authors, as they noticed that adjacent laser scans overlap, in case S is lower than the beam diameter (Db). For simplicity, they proposed to add a basic correction factor to the calculation of EDvol (Equation (4)) to account for the additional power input due to the overlap, namely simply the ratio . However, this Coverlay, as shown by the red line in (a), does not coincide with the calculations based on a more advanced geometrical method as used in the present work (black dots in the same subplot), with the largest deviations at small S.
Figure 2. (a) Comparison between 2D-calculations (black dots) as a function of the scan spacing (S), the 2nd degree polynomial fitting in the present work (green; Equation (14)) and the model outcome proposed by Pilipović et al. [Citation39,Citation40] (red line), (b) areas considered upon calculating the overlay factor through integrals, showing the main laser scan (grey) and the two adjacent laser scans (blue and red) in case S = 0.15 mm, (c) areas considered upon calculating the overlay factor in case S = 0.30 mm and (d) areas considered upon calculating the overlay factor in case S = 0.10 mm.
![Figure 2. (a) Comparison between 2D-calculations (black dots) as a function of the scan spacing (S), the 2nd degree polynomial fitting in the present work (green; Equation (14)) and the model outcome proposed by Pilipović et al. [Citation39,Citation40] (red line), (b) areas considered upon calculating the overlay factor through integrals, showing the main laser scan (grey) and the two adjacent laser scans (blue and red) in case S = 0.15 mm, (c) areas considered upon calculating the overlay factor in case S = 0.30 mm and (d) areas considered upon calculating the overlay factor in case S = 0.10 mm.](/cms/asset/1803ba82-a947-4807-9d56-383c77f0ce6a/nvpp_a_2285414_f0002_oc.jpg)
To obtain the black dots in (a), we performed an explicit 2D calculation of Coverlay with Db = 0.42 mm (EOS Formiga P10 machine), varying S, with three cases shown in (b–d). For each such calculation, we used the overlapping area of adjacent parabola, in which the X-axis aligns with the printing bed. Pragmatically, a 2nd degree fitting allows a better approximation (green line in (a)), which we therefore used to assess the overlay factor in our model:
(14)
(14) in which B0 = 3.02405 ± 0.02763, B1 = −8.43441 ± 0.27551, and B2 = 8.48665 ± 0.59556 and a Coverlay of 1.95 results for an S of 0.15 mm.
In a second optimisation phase, we have updated the way Cp and the preheating temperature interval are recognised, following the principles of Hofland et al. [Citation76] who updated Equation (4) as
(15)
(15) Hofland et al. [Citation76] although used a constant Cp value at ±20°C. Literature data although show that Cp increases more or less linearly with temperature, as confirmed in for the PA powder. Additionally, Hofland et al. [Citation76] ignored the preheating interval from the initial powder temperature Tambient up to Tb. This consideration of such temperature interval can be significant, explaining why we updated Equation (15) to:
(16)
(16)
Figure 3. Specific heat capacity value versus temperature for the determination of Cp,solid,avg [Tambient,Tpreheat].
![Figure 3. Specific heat capacity value versus temperature for the determination of Cp,solid,avg [Tambient,Tpreheat].](/cms/asset/f401acfa-afc9-42aa-9822-589ea7a8db50/nvpp_a_2285414_f0003_ob.jpg)
Practically we employed an average heat capacity as measured over the temperature interval [Tambient, Tpreheat], as shown in detail in Figure S4 of the Supporting Information with Tambient set at 20°C and Tpreheat at 160°C. As shown in , Cp starts to increase exponentially after 160°C, somewhat complicating the writing down of a more basic analytical equation, explaining this choice of [Tambient, Tpreheat ] bearing in mind that Tb was equal to 169°C for all prints. A Cp,solid,avg [T_ambient,T_preheat] value of 2.512 [J·(g·°C)−1] resulted.
By accounting for the modifications of both optimisation phases our updated model becomes:
(17)
(17)
(18)
(18)
(19)
(19)
It should be noted that for the EDvol calculation it is suggested to include Coverlay fully for the laser power contribution but not for the preheating interval contribution, explaining why in the second term in Equation (17) no Coverlay appears. Similarly, Coverlay is only appearing in the degradation part of Equations (18) and (19). This assumption of full Coverlay consideration can be seen as acceptable because the main laser scans (here scan count C = 1) should provide complete melting of the material. Therefore, the overlay factor will only affect the excess heating of the powder material, which can lead to degradation.
It should be further noted that Equations (17)–(19) are a function of material properties and thus in principle a wide range of materials can be explored, with variations in sensitivity to laser energy.
Particle size distribution
(inset) shows an optical image of the PA2200 powder used in this research. Despite that the particles are potato-shaped in agreement with literature data [Citation77,Citation78], we used the perimeter of the particles obtained from post-processing microscopic images to translate them as particle diameters, assuming perfectly spherical particles with the same perimeter. The results of this PSD calculation are presented in the main part of . Upon calculating the average particle diameter (Davg) and the median particle diameter (D50) an at first sigth large disagreement, up to 3 times, with the data typically reported in the literature is observed [Citation76]. In literature, for the Davg and D50 calculation authors, however, typically use the interval [20,100] µm, whereas we used the whole particle diameter range.
Figure 4. PSD frequency (left axis) and cumulative frequency (right axis), Davg and D50 calculated for the whole range of particle diameters and the common interval [20,100] µm. Inset: optical image of PA2200 used in this research.
![Figure 4. PSD frequency (left axis) and cumulative frequency (right axis), Davg and D50 calculated for the whole range of particle diameters and the common interval [20,100] µm. Inset: optical image of PA2200 used in this research.](/cms/asset/d9b9215f-6fc6-41fc-8c4c-2f84e16238d5/nvpp_a_2285414_f0004_oc.jpg)
This complete analysis focusing on all particle sizes is done as the recent study of Vande Ryse et al. [Citation32] revealed that the smaller particles should not be neglected, as PD reached a minimal value for particles with a diameter in the interval of [5, 20] µm. Notably, in case, we limit the range of particle diameters to [20,100] µm, our results are consistent with the values found in previous studies (see bottom values in ).
Experimental polymer degradation onset via multi-angle characterisation
To experimentally assess the printing quality and onset of degradation, we first conducted colorimetry and density measurements of the printed parts as a function of the laser power P. The corresponding results utilising EDvol as an independent parameter, being codetermined by P, and calculated via Equation (17), are shown in .
Figure 5. (a) Whiteness index (black) and yellowness index (red) as a function of the volume energy density (EDvol; Equation (17)). (b) Density as a function of the volume energy density for PA. A critical EDvol value of 1.58 J·mm−3 is identified.
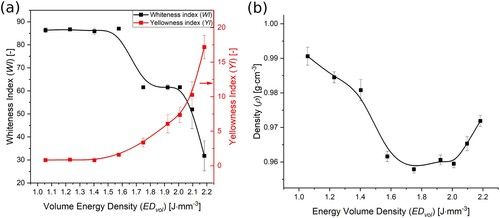
Similarly to our previous research on TPC [Citation32] and TPU [Citation31], for PA2200, in (a), the Whiteness Index (black line) decreases and the Yellowness Index (red line) increases with increasing EDvol. More in detail, the Yellowness Index starts to increase exponentially from an EDvol of around 1.58 J·mm−3, which corresponds to a laser power of 14 W and the end of the plateau region for the Whiteness Index. Despite that the density results in (b) display a less obvious trend, a very sharp decrease in density is noticed shortly before the Yellowness Index starts to increase exponentially.
To obtain a deeper insight into the printing quality and polymer degradation, subsequently SEM imaging was used to assess the morphology of the printed parts. As can be seen in , the size and number of voids (blue arrows) as well as the size and number of holes caused by degradation of the material (red circles) are correlated with P. With increasing P less voids and more holes are obtained. Consistently, (a), dealing with results for samples printed with a low P of 10 W (EDvol = 1.23 J·mm−3), shows occasional degradation holes (low number of red circles). However, a large amount of voids due to a non-uniform melt phase can be seen (many blue arrows). A lower P lowers the probability of molecular contact to enable a sufficient melting mechanism and thus many blue arrows result.
Figure 6. SEM images of cryogenically broken samples obtained with different settings of laser power P. (a) P = 10 W, (b) P = 12 W, (c) P = 14 W, (d) P = 16 W and (e) P = 18 W. Red circles indicate holes formed due to degradation. Blue arrows indicate voids due to a non-uniform melt phase.
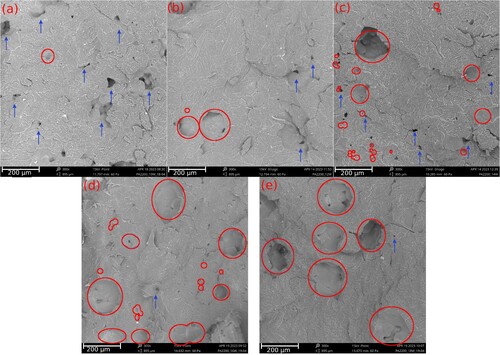
In case P becomes 12 W (EDvol = 1.40 J·mm−3), (b) highlights the formation of less voids (less blue arrows) but also more holes with a larger diameter (already more red circles). It should be noted that the increase in diameter of degradation holes was first noticed by Ho et al. [Citation79] and the SEM images in the present work are in line with the results they obtained for a polycarbonate powder. One obtains due to the degradation more local density changes and evaporation. As gasses will try to attain a minimal surface tension at the outer surface, they will try to attain a spherical shape, allowing a differentiation with the holes that are more irregular.
Starting from P = 14 W (EDvol = 1.58 J·mm−3), the critical P from , a very pronounced increase in the amount of holes can be observed (many red circles), as shown in (c). It can also be seen that holes in two different diameter ranges are present for such a high P. A large amount of degradation holes with small diameter are visible in (c), while holes with a larger diameter due to degradation are present as well. The former type of holes indicates the degradation of very small particles, which was also previously observed by Vande Ryse et al. [Citation32]. Consistently, a further increase of P to 16 W (EDvol = 1.75 J·mm−3) and 18 W (EDvol = 1.92 J·mm−3) is accompanied with an increase in the number and diameter of holes (even more red circles), as demonstrated in (d and e). Following the trend in (a–d), the number of voids is becoming very low.
Hence, we can conclude from that higher laser powers cause more degradation of the material, and in line with the colorimetry and density results in the onset of degradation for PA2200 occurs at a laser power P = 14 W (EDvol = 1.58 J·mm−3).
Interestingly, the Young’s or elasticity modulus and flexural modulus of the printed parts, as seen in (b) (grey and orange line, respectively), also support degradation having a significant effect on printed parts from P = 14 W (EDvol = 1.58 J·mm−3) onwards. As seen in this subfigure, the mechanical properties of the samples start to decrease defining a maximum in mechanical properties, if the degradation starts to increase exponentially with respect to an increase in EDvol according to analysis of YI, WI and SEM data ( and ).
Figure 7. (a) Comparison of analytical model predictions by Vasquez et al. [Citation27] (black), Lupone et al. [Citation63] (red), Vande Ryse et al. [Citation31,Citation32] (blue) and the in this work proposed Equation (18) (green), including the experimentally noticed onset degradation based on the experimental results of and (purple) taking for simplicity a flat dashed line at 14 W. (b) Tensile modulus (grey) and flexural modulus (orange) of obtained PA printed samples with different settings for P (8, 14, 17, 19, 21 and 25 W), including as vertical lines the energy volume density (EDvol; Equation (17)) associated with the minimal laser power for degradation for the analytical models covered in subplot a.
![Figure 7. (a) Comparison of analytical model predictions by Vasquez et al. [Citation27] (black), Lupone et al. [Citation63] (red), Vande Ryse et al. [Citation31,Citation32] (blue) and the in this work proposed Equation (18) (green), including the experimentally noticed onset degradation based on the experimental results of Figures 5 and 6 (purple) taking for simplicity a flat dashed line at 14 W. (b) Tensile modulus (grey) and flexural modulus (orange) of obtained PA printed samples with different settings for P (8, 14, 17, 19, 21 and 25 W), including as vertical lines the energy volume density (EDvol; Equation (17)) associated with the minimal laser power for degradation for the analytical models covered in subplot a.](/cms/asset/0735c522-9968-4225-82f9-4281894c4018/nvpp_a_2285414_f0007_oc.jpg)
Model validation for degradation temperature
The impact of the particle diameter on PD, as calculated via the analytical models of Vasquez et al. [Citation27] (black), Lupone et al. [Citation63] (red), Vande Ryse et al. [Citation32] (blue) and the proposed equation in the present work (Equation (18) (green)) is shown in (a). It should be noted that for the models of Vasquez et al. and Lupone et al. the onset temperature for degradation (Tdegr, onset) was used as degradation temperature (Tdeg), whereas the model of Vande Ryse et al. [Citation32] and the proposed Equation (18) utilise the temperature for degradation at 1% mass loss (Tdegr, 1%). Both Tdeg values have been determined via the same TGA measurements but the value for Tdeg is thus model dependent. In addition, the experimental PD of 14 W is shown for simplicity as a flat dashed purple line, with the interesting observation that the average particle size value of ca. 20 μm from gives a PD value very close to 14 W.
From (a) it can be further seen that Vasquez et al. [Citation27] (black line) underestimate the experimental PD slightly, while Lupone et al. [Citation63] (red line) overestimates it, and the older model of [Citation31] (blue line) even shows the highest deviation from the experimental PD. The proposed Equation (18), in turn, delivers a laser power for degradation in between the value for Lupone et al. [Citation63] and Vasquez et al. [Citation27]. Furthermore, as shown in Figure S7(a–c) in the Supporting Information, by taking the overlay factor (Equation (14)) into account the optimised model describes more accurately the physical phenomena during SLS, justifying the aforementioned first optimisation phase. Similarly, Figure S7(d) in the Supporting Information highlights that the second optimisation phase matters, highlighting the higher values with Equation (17). Consistently, as shown in (b), the updated model predicts nicely the laser power resulting in the maximal mechanical properties, before detrimental degradation occurs (region on the right of the green line). In addition, Figures S8 and S9 of the Supporting Information show via a sensitivity analysis that the model developed can be employed for different values of S, v, z and Tb.
As shown in , we applied the optimised model (Equation (18)) for the prediction of PD for different polymers described in the literature as well. This is done keeping a comparison with the models of Vasquez et al. [Citation27], Lupone et al. [Citation63], Vande Ryse et al. [Citation31,Citation32] and including the experimentally reported values, focusing on an evaluation for the average experimental size. In this framework, the previous polymers considered by Vande Ryse et al. [Citation31,Citation32], namely a TPC [Citation32] and a TPU [Citation31], are modelled, considering the literature-based model parameters in the Supporting Information.
Figure 8. Further comparison of the models of Vasquez et al. [Citation27] (black), Lupone et al. [Citation63] (red), Vande Ryse et al. [Citation32] (blue) and the proposed Equation (18) (green; bars on top also the actual value) for PA and two other polymers (TPC (middle) and TPU (right)) including the laser power at which degradation was noticed experimentally (grey square and value in grey in blue bar). Models evaluated for the experimental average particle size. Model parameters in the Supporting Information (see Tables S1–Table S4).
![Figure 8. Further comparison of the models of Vasquez et al. [Citation27] (black), Lupone et al. [Citation63] (red), Vande Ryse et al. [Citation32] (blue) and the proposed Equation (18) (green; bars on top also the actual value) for PA and two other polymers (TPC (middle) and TPU (right)) including the laser power at which degradation was noticed experimentally (grey square and value in grey in blue bar). Models evaluated for the experimental average particle size. Model parameters in the Supporting Information (see Tables S1–Table S4).](/cms/asset/0d15fd1d-8974-4b1e-9b21-a5482b7ef836/nvpp_a_2285414_f0008_oc.jpg)
It follows that the difference between the literature models increases for the additional materials, while the optimised model (Equation (18)) shows a sufficiently accurate representation for all three materials (PA, TPC and TPU). More in detail, the calculation of PD via the optimised model for TPC leads to a value of 17.5 W, which is very close to the experimental value of 17 W. Similarly, for TPU a modelled and experimental value of 12.4 and 13 W is obtained, respectively. In contrast, the values obtained based on Vasquez et al. [Citation27] and Lupone et al. [Citation63] are too high and the values from [Citation31,Citation32] are somewhat too high.
Hence, our model is capable to identify relative trends as the independent variables in Equations (17)–(19) are different. With more future recording of such variables, the predictive nature of the developed model can be further finetuned.
Conclusions
We have developed an updated set of equations to calculate the laser power for the onset of degradation in SLS. These equations are used as input measured material properties of the sintered powder, machine-specific properties and the settings of the SLS process.
To validate the model, PA2200 parts have been sintered at various printing settings and optical microscopy, SEM, colorimetry, density and mechanical tests have been conducted to experimentally assess the onset of degradation. A successful model validation is demonstrated thanks to the consideration of an overlay factor and a heating correction starting at ambient temperature. Compared to literature (analytical) models, the updated model also enables a better description of the onset of degradation for other polymer materials, specifically TPC and TPU.
We particularly grasp the crucial switching point between a minimisation of degradation (need of lower laser powers to avoid molecular variations) and the minimisation of voids (need of higher laser powers for sufficient material deposition). In this context, it is critical to account for the complete PSD, as opposed to the current way of working ignoring the smaller particle sizes.
The updated model is thus a step forward for the screening of new materials for SLS based on analytical developments, enabling a fast calculation minimising experimental cost. Due to its link to material properties a wide range of materials with different degradation power dependencies can be tested, which is the scope of future work.
Supplemental Material
Download MS Word (16.2 MB)Disclosure statement
No potential conflict of interest was reported by the author(s).
Additional information
Funding
References
- Berman B. 3-D printing: the new industrial revolution. Bus Horiz. 2012;55(2):155–162. doi:10.1016/j.bushor.2011.11.003
- Kanishka K, Acherjee B. A systematic review of additive manufacturing-based remanufacturing techniques for component repair and restoration. J Manuf Process. 2023;89(January):220–283. doi:10.1016/j.jmapro.2023.01.034
- Segonds F. Design by additive manufacturing: an application in aeronautics and defence. Virtual Phys Prototyp. 2018;13(4):237–245. doi:10.1080/17452759.2018.1498660
- Fernandez E, Ceretti DA, Wang S, et al. Fused filament fabrication of copolyesters by understanding the balance of inter- and intra-layer welding. Plast Rubber Compos. 2020: 1–7. doi:10.1080/14658011.2020.1855386
- Van Waeleghem T, Marchesini FH, Cardon L, et al. Melt exit flow modelling and experimental validation for fused filament fabrication: from Newtonian to non-Newtonian effects. J Manuf Process. 2022;77(February):138–150. doi:10.1016/j.jmapro.2022.03.002
- Jiang J, Lou J, Hu G. Effect of support on printed properties in fused deposition modelling processes. Virtual Phys Prototyp. 2019;14(4):308–315. doi:10.1080/17452759.2019.1568835
- Tamburrino F, Graziosi S, Bordegoni M. The influence of slicing parameters on the multi-material adhesion mechanisms of FDM printed parts: an exploratory study. Virtual Phys Prototyp. 2019;14(4):316–332. doi:10.1080/17452759.2019.1607758
- La Gala A, Fiorio R, Ceretti DVA, et al. A combined experimental and modeling study for pellet-fed extrusion-based additive manufacturing to evaluate the impact of the melting efficiency. Materials. 2021;14(19):5566. doi:10.3390/ma14195566
- Ivorra-Martinez J, Peydro MÁ, Gomez-Caturla J, et al. The effects of processing parameters on mechanical properties of 3D-printed polyhydroxyalkanoates parts. Virtual Phys Prototyp. 2023;18(1). doi:10.1080/17452759.2022.2164734
- Conner BP, Manogharan GP, Martof AN, et al. Making sense of 3-D printing: creating a map of additive manufacturing products and services. Addit Manuf. 2014;1:64–76. doi:10.1016/j.addma.2014.08.005
- Bikas H, Stavropoulos P, Chryssolouris G. Additive manufacturing methods and modeling approaches: a critical review. Int J Adv Manuf Technol. 2016;83(1–4):389–405. doi:10.1007/s00170-015-7576-2
- Ngo TD, Kashani A, Imbalzano G, et al. Additive manufacturing (3D printing): a review of materials, methods, applications and challenges. Compos Part B Eng. 2018;143(December 2017):172–196. doi:10.1016/j.compositesb.2018.02.012
- Rogkas N, Vakouftsis C, Spitas V, et al. Design aspects of additive manufacturing at microscale: a review. Micromachines. 2022;13(5):775. doi:10.3390/mi13050775
- Rosso S, Meneghello R, Biasetto L, et al. In-depth comparison of polyamide 12 parts manufactured by multi jet fusion and selective laser sintering. Addit Manuf. 2020;36:101713. doi:10.1016/j.addma.2020.101713
- Craft G, Nussbaum J, Crane N, et al. Impact of extended sintering times on mechanical properties in PA-12 parts produced by powderbed fusion processes. Addit Manuf. 2018;22(March):800–806. doi:10.1016/j.addma.2018.06.028
- Le KQ, Tran VT, Chen K, et al. Predicting crystallinity of polyamide 12 in multi jet fusion process. J Manuf Process. 2023;99(May 2022):1–11. doi:10.1016/j.jmapro.2023.05.043
- Guo B, Xu Z, Luo X, et al. A detailed evaluation of surface, thermal, and flammable properties of polyamide 12/glass beads composites fabricated by multi jet fusion. Virtual Phys Prototyp. 2021;16(S1):S39–S52. doi:10.1080/17452759.2021.1899463
- Yang S, Tang Y, Zhao YF. A new part consolidation method to embrace the design freedom of additive manufacturing. J Manuf Process. 2015;20:444–449. doi:10.1016/j.jmapro.2015.06.024
- Isaac CW, Duddeck F. Current trends in additively manufactured (3D printed) energy absorbing structures for crashworthiness application–a review. Virtual Phys Prototyp. 2022;17(4):1058–1101. doi:10.1080/17452759.2022.2074698
- Wei C, Li L. Recent progress and scientific challenges in multi-material additive manufacturing via laser-based powder bed fusion. Virtual Phys Prototyp. 2021;16(3):347–371. doi:10.1080/17452759.2021.1928520
- Gheisari R, Chamberlain H, Chi-Tangyie G, et al. Multi-material additive manufacturing of low sintering temperature Bi2Mo2O9 ceramics with Ag floating electrodes by selective laser burnout. Virtual Phys Prototyp. 2020;15(2):133–147. doi:10.1080/17452759.2019.1708026
- Hon KKB, Gill TJ. Selective laser sintering of SiC/polyamide composites. CIRP Ann Manuf Technol. 2003;52(1):173–176. doi:10.1016/S0007-8506(07)60558-7
- Ligon SC, Liska R, Stampfl J, et al. Polymers for 3D printing and customized additive manufacturing. Chem Rev. 2017;117(15):10212–10290. doi:10.1021/acs.chemrev.7b00074
- Schmidt M, Pohle D, Rechtenwald T. Selective laser sintering of PEEK. CIRP Ann Manuf Technol. 2007;56(1):205–208. doi:10.1016/j.cirp.2007.05.097
- Schmid M, Amado A, Wegener K. Polymer powders for selective laser sintering (SLS). AIP Conf Proc. 2015;1664(May):160009. doi:10.1063/1.4918516
- Khalil Y, Kowalski A, Hopkinson N. Influence of energy density on flexural properties of laser-sintered UHMWPE. Addit Manuf. 2016;10:67–75. doi:10.1016/j.addma.2016.03.002
- Vasquez M, Haworth B, Hopkinson N. Optimum sintering region for laser sintered nylon-12. Proc Inst Mech Eng Part B J Eng Manuf. 2011;225(12):2240–2248. doi:10.1177/0954405411414994
- Vasquez M, Haworth B, Hopkinson N. Methods for quantifying the stable sintering region in laser sintered polyamide-12. Polym Eng Sci. 2013;53(6):1230–1240. doi:10.1002/pen.23386
- Vasquez GM, Majewski CE, Haworth B, et al. A targeted material selection process for polymers in laser sintering. Addit Manuf. 2014;1(2014):127–138. doi:10.1016/j.addma.2014.09.003
- Chatham CA, Long TE, Williams CB. Powder bed fusion of poly(phenylene sulfide)at bed temperatures significantly below melting. Addit Manuf. 2019;28(May):506–516. doi:10.1016/j.addma.2019.05.025
- Vande Ryse R, Andries J, Fiorio R, et al. Extended conference paper 28. In: C Charitidis, L Cardon, D Semitekolos, editor. 2nd International conference on polymer process innovation. Athens: Lavrion; 2022. p. 83–86.
- Vande Ryse R, Edeleva M, Van Stichel O, et al. Setting the optimal laser power for sustainable powder bed fusion processing of elastomeric polyesters: a combined experimental and theoretical study. Materials. 2022;15(1):385. doi:10.3390/ma15010385
- Lupone F, Padovano E, Casamento F, et al. Process phenomena and material properties in selective laser sintering of polymers: a review. Materials. 2022;15(1). doi:10.3390/ma15010183
- Kruth JP, Wang X, Laoui T, et al. Lasers and materials in selective laser sintering. Assem Autom. 2003;23(4):357–371. doi:10.1108/01445150310698652
- Xiong R, Zhang Z, Huang Y. Identification of optimal printing conditions for laser printing of alginate tubular constructs. J Manuf Process. 2015;20:450–455. doi:10.1016/j.jmapro.2015.06.023
- Sow MC, De Terris T, Castelnau O, et al. Influence of beam diameter on laser powder bed fusion (L-PBF) process. Addit. Manuf. 2020;36(August):101532. doi:10.1016/j.addma.2020.101532
- Dunbar AJ, Denlinger ER, Heigel J, et al. Development of experimental method for in situ distortion and temperature measurements during the laser powder bed fusion additive manufacturing process. Addit Manuf. 2016;12:25–30. doi:10.1016/j.addma.2016.04.007
- Wudy K, Drummer D. Aging effects of polyamide 12 in selective laser sintering: molecular weight distribution and thermal properties. Addit Manuf. 2019;25(November 2018):1–9. doi:10.1016/j.addma.2018.11.007
- Pilipović A, Brajlih T, Drstvenšek I. Influence of processing parameters on tensile properties of SLS polymer product. Polymers. 2018;10(11):1208. doi:10.3390/polym10111208
- Pilipović A, Drstvenšek I, Šercer M. Mathematical model for the selection of processing parameters in selective laser sintering of polymer products. Adv Mech Eng. 2014;2014(1):648562. doi:10.1155/2014/648562
- Charles A, Bayat M, Elkaseer A, et al. Elucidation of dross formation in laser powder bed fusion at down-facing surfaces: phenomenon-oriented multiphysics simulation and experimental validation. Addit Manuf. 2022;50(December 2021):102551. doi:10.1016/j.addma.2021.102551
- Chatham CA, Long TE, Williams CB. A review of the process physics and material screening methods for polymer powder bed fusion additive manufacturing. Prog Polym Sci. 2019;93:68–95. doi:10.1016/j.progpolymsci.2019.03.003
- Brighenti R, Cosma MP, Marsavina L, et al. Laser-based additively manufactured polymers: a review on processes and mechanical models. J Mater Sci. 2021;56(2):961–998. doi:10.1007/s10853-020-05254-6
- Yao L, Xiao Z, Huang S, et al. The formation mechanism of metal-ceramic interlayer interface during laser powder Bed fusion. Virtual Phys Prototyp. 2023;18(1 ):e2235324. doi:10.1080/17452759.2023.2235324
- Snow Z, Martukanitz R, Joshi S. On the development of powder spreadability metrics and feedstock requirements for powder bed fusion additive manufacturing. Addit Manuf. 2019;28(November 2018):78–86. doi:10.1016/j.addma.2019.04.017
- Chu F, Li E, Shen H, et al. Influence of powder size on defect generation in laser powder bed fusion of AlSi10Mg alloy. J Manuf Process. 2023;94(March):183–195. doi:10.1016/j.jmapro.2023.03.046
- Schiochet Nasato D, Pöschel T. Influence of particle shape in additive manufacturing: discrete element simulations of polyamide 11 and polyamide 12. Addit Manuf. 2020;36(February):101421. doi:10.1016/j.addma.2020.101421
- Lin LL, Yu Sheng S, Fan Di Z, et al. Microstructure of selective laser sintered polyamide. J Wuhan Univ Technol Mater Sci Ed. 2003;18(3):60–63. doi:10.1007/bf02838461
- Mys N, Van De Sande R, Verberckmoes A, et al. Processing of polysulfone to free flowing powder by mechanical milling and spray drying techniques for use in selective laser sintering. Polymers. 2016;8(4):150. doi:10.3390/polym8040150
- Dadbakhsh S, Verbelen L, Vandeputte T, et al. Effect of powder size and shape on the SLS processability and mechanical properties of a TPU elastomer. Phys Procedia. 2016;83:971–980. doi:10.1016/j.phpro.2016.08.102
- Verbelen L, Dadbakhsh S, Van Den Eynde M, et al. Characterization of polyamide powders for determination of laser sintering processability. Eur Polym J. 2016;75:163–174. doi:10.1016/j.eurpolymj.2015.12.014
- Verbelen L, Dadbakhsh S, Van den Eynde M, et al. Analysis of the material properties involved in laser sintering of thermoplastic polyurethane. Addit Manuf. 2017;15:12–19. doi:10.1016/j.addma.2017.03.001
- Mao Y, Wei H, Chang L, et al. Origin of deposition errors and layer-wise control strategies during laser additive manufacturing. Virtual Phys Prototyp. 2023;18(1). doi:10.1080/17452759.2023.2173615
- Laumer T, Stichel T, Nagulin K, et al. Optical analysis of polymer powder materials for selective laser sintering. Polym Test. 2016;56:207–213. doi:10.1016/j.polymertesting.2016.10.010
- Yamauchi Y, Kigure T, Niino T. Penetration depth optimization for proper interlayer adhesion using near-infrared laser in a low-temperature process of PBF-LB/P. J Manuf Process. 2023;98(October 2022):126–137. doi:10.1016/j.jmapro.2023.05.006
- Wudy K, Lanzl L, Drummer D. Selective laser sintering of filled polymer systems: bulk properties and laser beam material interaction. Phys Proc. 2016;83:991–1002. doi:10.1016/j.phpro.2016.08.104
- Osmanlic F, Wudy K, Laumer T, et al. Modeling of laser beam absorption in a polymer powder bed. Polymers. 2018;10(7):1–11. doi:10.3390/polym10070784
- Xin L, Boutaous M, Xin S, et al. Multiphysical modeling of the heating phase in the polymer powder bed fusion process. Addit Manuf. 2017;18:121–135. doi:10.1016/j.addma.2017.10.006
- Fan KM, Wong KW, Cheung WL, et al. Reflectance and transmittance of TrueFormTM powder and its composites to CO2 laser. Rapid Prototyp J. 2007;13(3):175–181. doi:10.1108/13552540710750924
- Starr TL, Gornet TJ, Usher JS. The effect of process conditions on mechanical properties of laser-sintered nylon. Rapid Prototyp J. 2011;17(6):418–423. doi:10.1108/13552541111184143
- Yamauchi Y, Kigure T, Niino T. Quantification of supplied laser energy and its relationship with powder melting process in PBF-LB/P using near-infrared laser. J Manuf Process. 2023;99(January):272–282. doi:10.1016/j.jmapro.2023.05.002
- Ren Y, Liang L, Shan Q, et al. Effect of volumetric energy density on microstructure and tribological properties of FeCoNiCuAl high-entropy alloy produced by laser powder bed fusion. Virtual Phys Prototyp. 2020;15(S1):543–554. doi:10.1080/17452759.2020.1848284
- Lupone F, Padovano E, Pietroluongo M, et al. Optimization of selective laser sintering process conditions using stable sintering region approach. Express Polym Lett. 2021;15(2):177–192. doi:10.3144/expresspolymlett.2021.16
- Myers TL, Brauer CS, Su Y-F, et al. Quantitative reflectance spectra of solid powders as a function of particle size. Appl Opt. 2015;54(15):4863. doi:10.1364/ao.54.004863
- Mark JE. Polymer data handbook, 2nd Ed. J Am Chem Soc. 2009;131(44):16330–16330. doi:10.1021/ja907879q
- Bianchi O, Oliveira RVB, Fiorio R, et al. Assessment of Avrami, Ozawa and Avrami-Ozawa equations for determination of EVA crosslinking kinetics from DSC measurements. Polym Test. 2008;27(6):722–729. doi:10.1016/j.polymertesting.2008.05.003
- Singh S, Ramakrishna S, Singh R. Material issues in additive manufacturing: a review. J Manuf Process. 2017;25:185–200. doi:10.1016/j.jmapro.2016.11.006
- Wauthle R, Vrancken B, Beynaerts B, et al. Effects of build orientation and heat treatment on the microstructure and mechanical properties of selective laser melted Ti6Al4V lattice structures. Addit Manuf. 2015;5:77–84. doi:10.1016/j.addma.2014.12.008
- Zhao W, Xiang H, Yu R, et al. Effects of laser scanning speed on the microstructure and mechanical properties of 2205 duplex stainless steel fabricated by selective laser melting. J Manuf Process. 2023;94(March):1–9. doi:10.1016/j.jmapro.2023.03.068
- Wang D, Liu L, Deng G, et al. Recent progress on additive manufacturing of multi-material structures with laser powder bed fusion. Virtual Phys Prototyp. 2022;17(2):329–365. doi:10.1080/17452759.2022.2028343
- Zhang Y, Aiyiti W, Du S, et al. Design and mechanical behaviours of a novel tantalum lattice structure fabricated by SLM. Virtual Phys Prototyp. 2023;18(1). doi:10.1080/17452759.2023.2192702
- Wu H, Ren Y, Ren J, et al. Effect of melting modes on microstructure and tribological properties of selective laser melted AlSi10Mg alloy. Virtual Phys Prototyp. 2020;15(S1):570–582. doi:10.1080/17452759.2020.1811932
- Stiller T, Berer M, Kashyap Katta AD, et al. Powder ageing of polyamide 6 in laser sintering and its effects on powder and component characteristics. Addit Manuf. 2022;58(June):102987. doi:10.1016/j.addma.2022.102987
- Wu T, Ren Y, Liang L, et al. Tensile strength and wear resistance of glass-reinforced PA1212 fabricated by selective laser sintering. Virtual Phys Prototyp. 2023;18(1). doi:10.1080/17452759.2022.2150652
- Ellis A, Noble CJ, Hopkinson N. High speed sintering: assessing the influence of print density on microstructure and mechanical properties of nylon parts. Addit Manuf. 2014;1:48–51. doi:10.1016/j.addma.2014.07.003
- Hofland EC, Baran I, Wismeijer DA. Correlation of process parameters with mechanical properties of laser sintered PA12 parts. Adv Mater Sci Eng. 2017;2017:11. doi:10.1155/2017/4953173
- Berretta S, Ghita O, Evans KE. Morphology of polymeric powders in laser sintering (LS): from polyamide to new PEEK powders. Eur Polym J. 2014;59:218–229. doi:10.1016/j.eurpolymj.2014.08.004
- Schmid M, Wegener K. Additive manufacturing: polymers applicable for laser sintering (LS). Proc Eng. 2016;149(June):457–464. doi:10.1016/j.proeng.2016.06.692
- Ho HCH, Gibson I, Cheung WL. Effects of energy density on morphology and properties of selective laser sintered polycarbonate. J Mater Process Technol. 1999;89–90:204–210. doi:10.1016/S0924-0136(99)00007-2