
 ?Mathematical formulae have been encoded as MathML and are displayed in this HTML version using MathJax in order to improve their display. Uncheck the box to turn MathJax off. This feature requires Javascript. Click on a formula to zoom.
ABSTRACT
Poly(lactic acid)-zinc oxide (PLA-ZnO) nanocomposites for fused filament fabrication have potential applications in the biomedical field as they combine the bio-compatibility of PLA with the antibacterial properties of ZnO. This work investigates the effects of masterbatch mixing strategy, ZnO concentration and ZnO surface treatment (silanisation) on the printability and the mechanical performance of the nanocomposites as a pre-requirement to the wider uptake of these materials. The results showed that the printability decreased as the filler loading increased. However, the surface treatment of the ZnO powder enhanced the matrix-filler interfacial interactions and reduced the thermal degradation of PLA. This ameliorated the printability and the tensile properties of the nanocomposites filled with up to 5 wt.% of ZnO. Moreover, despite the additional thermal treatment, melt-mixing prevented the degradative effect induced by the solvent used for solvent mixing. Future work will focus on assessing the antibacterial properties of the nanocomposite FFF parts.
1. Introduction
Fused filament fabrication (FFF – also known as fused deposition modelling, FDM) is a versatile, cost effective and highly scalable 3D printing technology that is growing rapidly in additive manufacturing (AM) [Citation1]. According to the standard classification provided in ISO/ASTM 52900:2021 [Citation2], FFF is categorised under the material extrusion (MEX) family, feeding on continuous filaments commonly made of thermoplastic materials such as polylactic acid (PLA), acrylonitrile butadiene styrene (ABS) and polyamide (PA, also known as nylon) [Citation3]. The feedstock filament passes through the printhead, where it is melted and extruded from the nozzle, and subsequently lands onto the build platform according to a computer-controlled toolpath [Citation4,Citation5]. Once the first layer is completed, a second layer is deposited on top of the previous one, and then the process is repeated until completion of the desired 3D structure [Citation5]. Such layer-based approach enables the fabrication of complex shapes and intricate architectures that are difficult to achieve via conventional techniques like compression or injection moulding [Citation6]. FFF is therefore revolutionising the healthcare sector in manufacturing elaborate and bespoke plastic-based biomedical parts [Citation7,Citation8].
Currently, one major impediment to FFF being adopted in clinical settings is the lack of feedstock materials with suitable biodegradability, biocompatibility and therapeutic functionalities. An example of this is provided by PLA. Besides being one of the most popular FFF feedstocks, PLA is also a key biomaterial for 3D printing biomedical devices owing to its biocompatible and biodegradable nature [Citation9]. However, due to its susceptibility to bacterial contamination, pristine PLA has had limited use in healthcare industries [Citation10]. This has driven increasing research towards functionalising PLA filaments with antibacterial nanofillers, for instance through the incorporation of copper [Citation11], silver [Citation12], titanium dioxide [Citation13] and silicon dioxide [Citation14]. Commercial PLA filaments combined with silver and copper additives are available under the trademark of PLACTIVETM [Citation15] and BioGuardTM [Citation16], respectively. Despite the commercial availability, there are limitations associated with the current antibacterial feedstocks. For instance, silver-based materials are constrained by the high cost, and by the hazardous and time-consuming production processes of silver additives [Citation17,Citation18]. Copper-based materials have limited applications due to the potential human toxicity of copper additives [Citation19-21]. Hence, there is an ongoing need for the development of FFF antibacterial feedstocks that are more affordable and biocompatible.
Zinc oxide (ZnO) represents an interesting option. Over the past decade, studies of PLA-ZnO nanocomposites have shown that these materials exhibit excellent antibacterial properties against common hospital-acquired bacteria [Citation22-24]. In addition to being antibacterial, ZnO also has promising tissue regenerative properties [Citation25]. However, in spite of such attractive biomedical properties and the advantages of being abundant, economical and low in toxicity, ZnO-functionalised PLA filaments for 3D printing possess a number of material and processing challenges which must be addressed before these composites can be widely adopted for biomedical applications. Tackling the key issues that affect the printability of PLA-ZnO nanocomposites by FFF is the main goal of this contribution.
Generally, nanocomposite filaments can be produced through a process known as melt extrusion, where high heat and shear stresses are applied to melt the polymer and disperse the nanofillers within the molten polymer. The molten polymer is then extruded from the die in the form of a filament. The addition of ZnO can have a detrimental effect on PLA during melt extrusion, since PLA-ZnO nanocomposites are highly thermally sensitive, because ZnO significantly accelerates the degradation of PLA at elevated temperatures [Citation26-29]. This lowers the molecular weight of PLA, negatively impacting its thermal, rheological and mechanical properties [Citation30-33]. Another common issue leading to the deterioration of material properties arises from the propensity of ZnO to agglomerate, and this is exacerbated at high ZnO concentrations [Citation23,Citation34,Citation35].
A survey of the literature identifies two effective strategies to mitigate the ZnO-catalysed PLA degradation and to achieve better ZnO dispersion. The first method relates to the surface modification of ZnO [Citation32,Citation36,Citation37]. In silane-treated ZnO, the organic chains of silane at the ZnO surface exert steric hindrance between the nanoparticles [Citation38]. This treatment decreases the surface energy of ZnO and limits the aggregation of the nanoparticles [Citation38]. Furthermore, Benali et al. [Citation30] reported the ability of silane treated-ZnO to mitigate the hydrolytic degradation of PLA by delaying water diffusion into the matrix, owing to the combined effect of the enhancement in crystallinity and hydrophobicity of the nanocomposites. The second approach is via the use of the so-called ‘masterbatch’ [Citation28]. The masterbatch consists of a premix of PLA with a high concentration of ZnO nanofillers, which is then melt mixed with additional pristine PLA to obtain nanocomposites with the desired (lower) ZnO concentrations. According to Murariu et al. [Citation28], PLA-ZnO nanocomposite films produced from masterbatches featured more uniform ZnO dispersion and better thermal stability as compared to those obtained from the direct melt-mixing of PLA and ZnO. The increase in thermal stability was attributed to the fact that the large portion of PLA being added to the masterbatch during the second thermal processing step required to produce the film is shielded from direct contact with ZnO nanoparticles at high temperature [Citation28].
Although several studies in the literature investigated the properties and printability of PLA-ZnO filaments [Citation39-42], to the best of the authors’ knowledge, none of them accounts for the abovementioned mitigation strategies in the filament fabrication process. Furthermore, the rheological properties of PLA-ZnO filaments, which are key to defining the printability of the material, are still generally unknown. This work intends to fill the existing gaps in the printability studies of PLA-ZnO nanocomposites by FFF, with the final goal of minimising the matrix processability issues induced by ZnO. To this aim, this study evaluates the effects of ZnO concentration (1, 3 and 5 wt.%), surface treatment of ZnO (silanised vs. untreated) and masterbatch mixing strategy (solvent- vs. melt-mixing) on the thermal, rheological and mechanical properties of the nanocomposites. It is envisaged that the development of printable PLA-ZnO nanocomposite filaments could advance the AM of bespoke antibacterial biomedical parts such as tissue engineering structures, surgical tools and non-load bearing implants.
2. Materials and methods
2.1. Materials
Commercial PLA pellets IngeoTM 3D850 specifically formulated for extruding filaments for AM were acquired from NatureWorks LLC (Minnetonka, MN, USA). The technical datasheet of this material specified a melt flow rate (MFR) of 7–9 g/10 min at 210°C, a density of 1.24 g/cm3, a glass transition temperature of 55–60°C and a melt temperature of 165–180°C [Citation43]. ZnO nano powder with the trade name NanosunTM Zinc Oxide P99/30 was kindly supplied by Micronisers (Dandenong, VIC, Australia). According to the datasheet [Citation44], the size of the nano powder ranges from 30 to 50 nm, with a purity greater than 99.5%, and a bulk density of 0.3 g/cm3.
The silane coupling agent, 3-aminopropyltriethoxysilane (APTES) (CAS no. 919-30-2) used for the surface treatment of ZnO was purchased from Sigma Aldrich (St. Louis, MO, USA). Other reagents used in this study include ethanol (EtOH) (purity ≥ 99.9%) (CAS no. 64-17-5), 1.25 M hydrochloric acid (HCl) in EtOH (CAS no. 7647-01-0) and 69% nitric acid (HNO3) (CAS no. 7697-37-2), all purchased from Merck (Darmstadt, Germany) and chloroform (CHCl3) (purity ≥ 99.9%) (CAS no. 67-66-3), purchased from Sigma-Aldrich (St. Louis, MO, USA).
2.2. Surface treatment of ZnO
The surface treatment of the ZnO nano powder was performed according to the method previously reported by Mallakpour et al. [Citation38]. After drying overnight at 80°C, 30 g of ZnO powder were sonicated in 150 mL of EtOH, with a lid placed over the beaker to reduce the evaporation of EtOH. Following this, 4.5 mL of APTES were added to the suspension and sonicated for another 30 mins. After the evaporation of EtOH in a fume hood at room temperature, the powder obtained was rinsed with deionised water. APTES-treated ZnO (hereinafter referred to as ‘treated’ ZnO) was obtained after drying in an oven at 70°C.
2.3. Fabrication of PLA-ZnO masterbatches
PLA pellets and ZnO powder were dried overnight at 80°C before processing. Subsequently, ZnO, either untreated (as received) or treated, was mixed with neat PLA to manufacture 10 wt.% PLA-ZnO masterbatches to be used for filament production. The masterbatches were produced by mixing PLA and ZnO via two different mechanisms, namely solvent-mixing and melt-mixing, as described below.
2.3.1. Solvent-mixing
CHCl3 was used to dissolve PLA with a ratio of 6:1 by volume. PLA pellets were gradually added to the solvent and stirred with an overhead mixer at 70°C until the pellets dissolved completely. Following this, either untreated or treated ZnO powder was added to the solution and sonicated at 50°C for one hour. A lid was placed over the beaker to limit the evaporation of CHCl3 during sonication. Following this, the mixture was then cast onto a flat tray and left to dry overnight in a fume hood at room temperature. The dried films were then cut into small squares and cryogenically crushed into finer pieces and dried in an oven at 70°C for at least 24 h prior to filament production.
2.3.2. Melt-mixing
PLA pellets and ZnO powder (either untreated or treated) were directly melt-mixed in a co-rotating twin screw extruder (Prism EuroLab 16 TSE, ThermoFisher Scientific, Waltham, MA, USA). The 10 heating zones of the extruder were set to 20°C, 50°C, 80°C, 90°C, 130°C, 140°C, 150°C, 160°C, 170°C and 180°C, respectively (see details below), with a screw rotation speed of 160 rpm. After extrusion, the extrudates were cooled and pelletised. Then, the pellets were dried in an oven at 70°C for at least 24 h prior to the final filament fabrication.
2.4. Fabrication of PLA and PLA-ZnO nanocomposite filaments
The same twin-screw extruder described in Section 2.3.2 was used to manufacture all the filaments in this study. Neat PLA filaments serving as the baseline of this study were firstly melt-extruded from pristine PLA 3D850 pellets. Following this, PLA-ZnO filaments with different filler concentrations were fabricated by melt-mixing the previously manufactured masterbatches with additional pristine PLA pellets. The initial temperature profile and the screw speed of the extruder were set to the recommended processing parameters as per the technical datasheet of PLA 3D850 [Citation43], but subsequently adjusted during the extrusion process to maintain a die pressure of below 1 bar and to ensure continuous material extrusion without degradation. The adjusted processing parameters are listed in Table S1, and different parameters were required for the varying material formulations. The speed of the conveyor belt was regulated to obtain filaments with a diameter of 1.75 mm diameter. A digital calliper was used to ensure that the diameters were kept within the 0.1 mm tolerance. At least 1 kg of filament for each material formulation listed in was collected and cooled on the conveyor belt before being spooled. also details the convention used for naming the various filaments in the exam.
Table 1. Material formulations of the filaments produced in this study.
2.5. FFF printing of tensile specimens
The geometry of the tensile test coupons, which were rectangular parts with dimensions of 22 mm × 200 mm × 3 mm (width x length x thickness), was selected based on the authors’ previous work [Citation45] according to ASTM D3039 [Citation46]. A commercial FFF printer (Raise3D Pro 2, Raise 3D Technologies, Irvine, CA, USA) was used to 3D print the tensile specimens using the in-house fabricated PLA and nanocomposite filaments. 3D computer-aided design (CAD) models of the test geometries were produced and converted to STL files in Solidworks (Dassault Systèmes, Waltham, MA, USA). The G-code was then generated via ideaMaker (Raise 3D Technologies, Irvine, CA, USA), a 3D slicing software for the printer. Nozzle temperature significantly influences the weld interface of FFF-printed parts [Citation47]. Pure PLA parts were initially printed at the suggested print temperature range for PLA 3D850, between 190°C to 230°C in 10°C increments. 230°C was found to provide the optimum interfacial adhesion quality for the PLA parts produced in this work and hence subsequently used as the print temperature for all the material formulations in this work. All samples were printed flat on the build platform. In order to highlight the anisotropic mechanical behaviour of FFF parts, the tensile specimens were printed with two different raster angles, i.e. 0° (parallel to the loading direction), and 90° (perpendicular to the loading direction), as illustrated in . To reduce the variables of the printing process, all the other FFF processing parameters listed in were kept constant, and the samples were printed individually.
Figure 1. 0° and 90° raster orientations of FFF specimens.
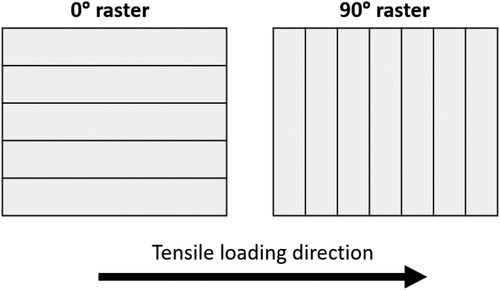
Table 2. Processing parameters used in the FFF printing of PLA and PLA-ZnO nanocomposites.
2.6. Characterisation
2.6.1. Morphological characterisation of ZnO powder
Field emission-scanning electron microscopy (FE-SEM) (Zeiss Merlin, Zeiss, Oberkochen, Germany) operated in in-lens (IL) mode was used to characterise the ZnO nanoparticles, to visualise the morphology of both the treated and untreated powder. All samples were mounted on aluminium stubs and coated with iridium to a thickness of 4 nm, and characterised with an accelerating voltage of 3 kV.
Transmission election microscopy (Tecnai 12, FEI, Eindhoven, The Netherlands) was used to image the masterbatches, to observe the distribution and dispersion of the fillers in the polymer matrix. All samples were immersed in Procure 812 resin (ProSciTech Kirwan, QLD, C045) for 2 h under vacuum infiltration at room temperature. The samples were carefully removed and positioned in a resin mould in fresh Procure 812 resin prior to curing at 580°C for 3 days. The resin block was sectioned using a Leica UC7 ultramicrotome to give silver interference (∼70 nm) sections and collected onto grids (ProSciTech Kirwan, QLD, GCu200tb). The grids were examined using at an operating voltage of 120 kV. Images were recorded using a FEI Eagle 4k × 4k CCD camera at a range of magnifications using AnalySIS v3.2 camera control software (Olympus.) under low dose conditions (2-3e-/Å2).
2.6.2. Fourier-transform infrared spectroscopy (FTIR)
FTIR (Spectrum 100, PerkinElmer, Waltham, MA, USA) was used to compare the surface functional groups between the treated and untreated ZnO fillers, to verify the surface functionalisation of the treated nanoparticles. Both the treated and untreated powders were dried overnight at 70°C before the analysis. The spectra were recorded in attenuated total reflection (ATR) mode from 4000 cm−1 to 650 cm−1 at a resolution of 4 cm−1, averaging 32 scans for each sample. Pure APTES was also tested under the same experimental conditions as a term of comparison.
2.6.3. Inductively coupled plasma optical emission spectroscopy (ICP-OES)
ICP-OES (5900, Agilent, Santa Clara, CA, USA) was used to measure the elemental concentration of zinc in the filaments, to determine the actual filler concentrations of the nanocomposites. Approximately 0.1 g of material from each filament were placed in a microwave digestion tube. This was followed by the addition of 5 mL of HNO3. A high-pressure microwave-assisted digestion system (Multiwave 7000, Anton Paar, Graz, Austria) was then used to digest the samples for the analysis.
2.6.4. Gel permeation chromatography (GPC)
GPC was used to determine the molecular weight (MW) of PLA in the nanocomposite filaments, to confirm any degradative effects catalysed by ZnO and to demonstrate the influence of MW on the printability and the mechanical properties of the materials. Before analysis of the nanocomposites, PLA was separated from ZnO following the procedure reported by Murariu et al. [Citation32]. Firstly, the PLA matrix was dissolved in CHCl3. Following the dissolution of PLA, 0.1 mol aqueous solution of HCl was added and thoroughly stirred with an overhead mixer to facilitate the extraction of ZnO. Subsequently, the dispersion was allowed to settle to form two layers of immiscible liquids consisting of an ‘organic component’ (PLA dissolved in CHCl3) and an ‘aqueous component’ (ZnO dispersed in HCl/water). A pipette was then used to recover the organic component containing (ZnO-free) PLA dissolved in CHCl3. After the evaporation of CHCl3 in a fume hood at room temperature, PLA was used for GPC analysis.
GPC was performed on a Shimadzu system equipped with a CMB-20A controller system, an SIL-20A HT autosampler, an LC-20AT tandem pump system, a DGU-20A degasser unit, a CTO-20AC column oven, an RDI-10A refractive index detector, and 4× Agilent PL-Gel columns (3×PL-Gel Mixed C (5 µm) and 1×PL-Gel Mixed E (3 µm) columns, each 300 mm × 7.8 mm2, providing an effective molar mass range of 200 to 2 × 10⁶). CHCl3 was used as an eluent with a flow rate of 1 mL/min at 35°C. Number and weight average molecular weights were evaluated using Shimadzu LC Solution software. The GPC columns were calibrated with low dispersity polystyrene standards (Polymer Laboratories) ranging from 1180 g mol−1 to 3,152,000 g mol−1, and molar masses are reported as PSt equivalents. A 3rd-order polynomial was used to fit the log Mp vs. time calibration curve, which was near linear across the molar mass ranges.
Virgin PLA pellets and neat PLA filament were also tested as a term of comparison.
2.6.5. Evaluation of thermal behaviour
Thermogravimetric analysis (TGA) (TGA 8000, PerkinElmer, Waltham, MA, USA) was used to measure the degradation temperatures of the filaments, to ensure that the materials were thermally processed below their degradation temperatures. For each filament, approximately 3 mg of material were heated from 25 to 700°C at 10°C/min, under a nitrogen atmosphere flowing at 20 mL/min.
Differential scanning calorimetry (DSC) (DSC 250, TA Instruments, New Castle, DE, USA) scans were acquired to determine the thermal properties of PLA and nanocomposites including the glass transition temperature (Tg), melting temperature (Tm) and cold crystallisation temperature (Tcc). The cold crystallisation enthalpy (ΔHcc) and melting enthalpy (ΔHm) of the filaments were also obtained from the scans to calculate the degree of crystallinity of the PLA matrix (Xc) using Equation (1) adopted from Li et. al [Citation48], where ΔHm is the melting enthalpy (J/g) and ΔHcc is the cold crystallisation enthalpy (J/g) as determined from the DSC scan, ΔHf is the melting enthalpy of 100% crystalline PLA (93.7 J/g [Citation48]) and w is the weight fraction of PLA in the tested specimen. For each filament, approximately 8 mg of material were sealed in an aluminium pan and heated from 0 to 250°C, then cooled down to 0°C, followed by a second heating from 0 to 250°C at 10°C/min. All experiments were conducted under nitrogen flow at 20 mL/min.
(1)
(1)
2.6.6. X-ray diffraction (XRD)
An X-ray diffractometer (SmartLab, Rigaku, Tokyo, Japan) equipped with a rotating anode CuKα source (45 kV, 200 mA) and a Hypix 3000 detector was used to assess the crystallinity of PLA and nanocomposites, which was needed to evaluate the effect of crystallinity on the processability of the filaments as well as the mechanical properties of the printed parts. The diffractograms of the filaments and the 3D printed specimens were obtained over the 2θ range of 5–90° with a step size of 0.04° and a scan rate of 2°/min with zero background support.
2.6.7. Rheological properties
A rheometer (Discovery HR3, TA Instruments, New Castle, DE, USA) equipped with 25 mm parallel plates was used to assess the complex viscosity, storage modulus (G′) and loss modulus (G″) of the filaments. This was deemed necessary to examine the correlation between the rheological properties and the printability of the filaments, as well as the microstructural features of the printed parts.
The test specimens consisted of 25 mm diameter disks with 2 mm thickness and were prepared from the in-house fabricated filaments via compression moulding at 180°C. Amplitude sweep tests were firstly conducted at 160°C to identify the linear viscoelastic strain limit of the samples to ensure that the subsequent rheological characterisations were completed within the linear viscoelastic range of the samples to preserve rheological stability. A constant angular frequency of 10 rad/s was applied, with variable strain amplitude from 0.2 to 200%. A strain limit of 0.1% was selected in the region where G′ and G″ remained independent of the strain amplitude. Following this, frequency sweep tests were performed at 160°C, with a fixed strain input of 0.1%, and with angular frequencies ranging from 0.1 to 100 rad/s to measure the complex viscosity and viscoelastic properties of the materials.
2.6.8. Micro-computed tomography (µCT)
An X-ray microscope (Xradia 515 Versa, Zeiss, Oberkochen, Germany) equipped with an FPX detector was employed to assess the microstructural characteristics of the printed parts, to determine the porosity and the print quality of the parts.
The images were acquired at a voltage of 40 keV with a power of 3 W, exposure time of 2 s, and effective pixel size of 19.85 μm. A total of 1601 projections were taken over a 360° rotation. The distance from the source to rotation axis and detector was respectively set at −37.72 and 240.0 mm. Avizo software (Thermo Fisher Scientific, Waltham, MA, USA) was used to analyse the porosity of the printed parts. The volume fraction of voids was computed via volume fraction module, after separation of the voids from the materials via auto-thresholding.
2.6.9. Evaluation of tensile properties
Tensile tests were conducted to investigate the mechanical performances of the printed parts. The tests were performed at room temperature according to ASTM D3039. Five specimens were tested for each material formulation after drying the samples overnight at 30°C. A universal testing machine (5900 R, Instron, Norwood, MA, USA) with a load cell of 30 kN applied a strain rate of 2 mm/min on the specimens until fracture. An extensometer was not used as all samples experienced a brittle failure. The ultimate tensile strength (σUTS), elongation at break (ϵ) and elastic modulus (E) were derived from the stress–strain curves. Due to the brittle nature of the samples, the σUTS was determined from the maximum load at break, whereas E was determined from the slope of the linear elastic region of the stress–strain curves.
3. Results and discussion
3.1. Surface morphology and functional groups of pristine and treated ZnO
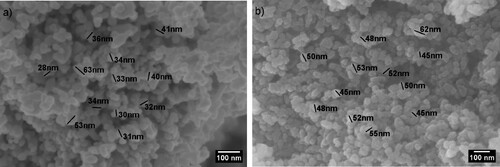
The morphology of the ZnO powder before and after surface treatment is shown in a,b, respectively. The FE-SEM images revealed a similar mixture of spherical- and rod-like structures for both untreated and treated powders, which also appeared to be agglomerated. The size of the nanoparticles, regardless of the surface treatment, ranged from 28 to 63 nm.
Figure 2. FE-SEM images: (a) untreated ZnO; and (b) treated ZnO. Scale bar: 100 nm for both micrographs.
FTIR analyses were performed to confirm the successful surface functionalisation of the ZnO nanofillers. a shows the FTIR spectra of untreated ZnO, treated ZnO particles and APTES silane agent. In a, the transmittance peaks of untreated ZnO and treated ZnO are not clearly visible due to the significantly stronger peaks of APTES. Hence, a separate graph was plotted for the untreated and treated ZnO powders in b to enable an easier comparison.
Figure 3. FTIR spectra: (a) untreated ZnO, treated ZnO and APTES; and (b) untreated ZnO and treated ZnO.
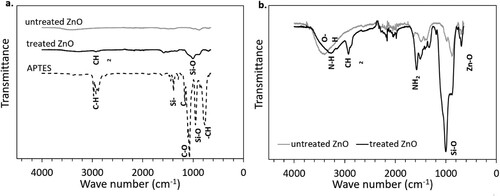
The FTIR spectrum of APTES in a shows the characteristic peaks associated with –CH bending (750 cm−1), Si–O bands (950 cm−1), C–O bands (1200 cm−1), Si–C bands (1300–1500 cm−1) and C–H stretching (2800–3000 cm−1) [Citation49,Citation50]. b shows that both treated and untreated ZnO powders have typical peaks corresponding to the bending of Zn-O in the region below 1000 cm−1 [Citation51]. The broad band between 3200 and 3500 cm−1 represents the stretching and vibration of O-H bonds and confirms that O-H groups were present in ZnO regardless of surface treatment [Citation52]. Nonetheless, the intensity of the peak associated with hydroxyl groups decreased slightly after surface functionalisation, occurring as part of the silanisation process of ZnO illustrated in .
Figure 4. Silanisation reaction between APTES and ZnO.
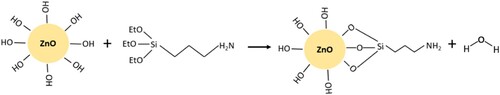
According to Ahangaran et al. [Citation53], the general silanisation mechanism of metal oxides (including ZnO) starts with the hydrolysis of the alkoxy groups (‘EtO–Si’ in ) of the silane to form silanol groups (Si–OH), followed by a condensation reaction between Si–OH and the –OH groups on the surface of the metal oxide particles to release water. From the spectrum of the treated ZnO in b, the silanisation reaction was confirmed from the new, very intense Si–O peak around 1004 cm−1 [Citation54]. In addition, the presence of terminal amine groups (–NH2) belonging to the APTES end-group was indicated by the peaks at 3276 and 1577 cm−1, which are attributed to the stretching vibration of N-H and the scissor vibration of -NH2, respectively [Citation55]. A prominent peak was also observed at 2924 cm−1, corresponding to the symmetric and asymmetric stretching vibrations of –CH2 from the aminopropyl segment of APTES [Citation56]. Ultimately, the FTIR spectra validated the covalent attachment of APTES molecules onto ZnO.
3.2. Actual ZnO concentrations in the fabricated nanocomposite filaments
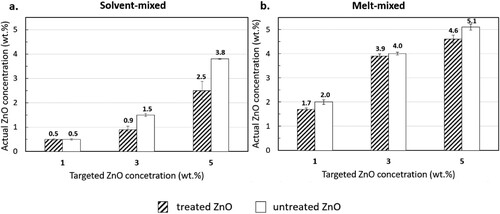
ICP-OES was used to determine the actual filler concentrations of the nanocomposite filaments. As shown in , the ZnO concentrations slightly differed from the targeted values of 1, 3 and 5 wt.%. shows that the actual ZnO concentrations of the filaments produced from solvent-mixed masterbatches were consistently lower than those produced from melt-mixed masterbatches. The possible causes that contributed to this phenomenon are explained in the following paragraphs.
Figure 5. Actual ZnO concentration in the nanocomposite filaments determined via ICP-OES: (a) solvent-mixed systems; and (b) melt-mixed systems. Average and standard deviation determined from two specimens per filament.
To the best of the authors’ knowledge, at the time of writing there were no publications that directly compared and investigated the effect of solvent- and melt-mixing routes of PLA-ZnO masterbatches on the production and printability of nanocomposite filaments for FFF. However, these mixing strategies have been compared using other composites, with contradictory opinions on the more effective dispersion mechanism being published by different researchers [Citation57-61]. According to the study conducted by Ke et al. [Citation60], better filler dispersion was obtained in solution- than melt-mixed polyvinylidene fluoride (PVDF)-multiwalled carbon nanotube (MWCNT) nanocomposites when low concentrations of MWCNT nanofillers (less than 5 wt.%) were used, whereas the opposite happened after the nanofiller concentrations exceeded 5 wt.%. It was explained that the inter-particle distances became shorter with increasing filler concentrations, which contributed to stronger interparticle forces responsible for the formation of filler aggregates, to a point where the ultrasonication energy of the sonicator used for solvent-mixing became insufficient to break them apart, and ultimately led to poorly dispersed fillers. Compared to the sonicator, the extruder used for melt-mixing (like the one employed in the present investigation) delivered higher shear forces to break down the filler aggregates, and hence, led to more homogeneous filler dispersions even at high filler loadings.
In general, solvent-mixing achieves satisfactory filler dispersions in small-scale laboratory production when very thin films are cast over a small area [Citation62]. However, the masterbatches in this study are considered as highly concentrated nanocomposites with a 10 wt.% nanofiller concentration. Hence, the energy provided from ultrasonication was inadequate to break down extensive amounts of aggregates developed from strong interparticle interactions at high filler loadings, resulting in areas with significantly larger filler aggregates in the solvent- than melt-mixed masterbatches as shown in .
Figure 6. TEM images showing the distribution and dispersion of the fillers in the masterbatches of (a) solvent-mixed system; and (b) melt-mixed system. Scale bar: 5 µm for both images and 500 µm for the higher magnification image in 6b.
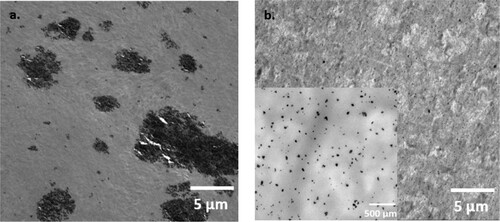
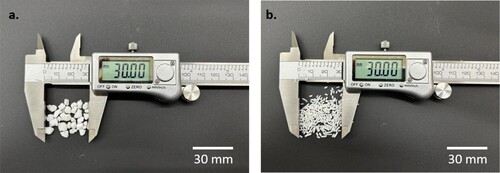
Furthermore, the masterbatches in this study were produced on a large scale to obtain enough masterbatches for fabricating all the filaments listed in . Thus, the solvent-mixing process involved using a substantial amount of solvent, which led to the production of relatively thick films (ranging between 0.2 and 0.5 cm) over a limited area of flat surfaces. The distribution of ZnO was visibly heterogeneous throughout the thickness of the films, being affected by the presence of aggregates and by the occurrence of nanofiller sedimentation at the bottom of the films. As experimentally observed, areas with numerous agglomerates or strong sedimentation (like those shown, for example, in a) were harder to be processed into uniformly-sized pellets, hence, the fragments of the solvent-mixed masterbatches were generally larger and more irregular than those of the melt-mixed ones (). During filament fabrication, it was easier for the small pellets of the melt-mixed masterbatches to flow into the extruder, whereas the large fragments of the solvent-mixed masterbatches often obstructed the feeder and could not be fed in. This resulted in the filler loss observed for the solvent-mixed systems. As opposed to this, the smaller pellets of the melt-mixed masterbatches achieved higher material flow rates, which led to filaments whose ZnO concentration closely matched or even exceeded the targeted composition.
Figure 7. Masterbatches after being processed into fragments in preparation for filament fabrication: (a) solvent-mixed; (b) melt-mixed.
The disparities in the actual ZnO concentrations pose substantial challenges for analysing the influence of the different mixing mechanisms (solvent-mixing vs. melt-mixing) on the properties and printability of the composite filaments discussed in the following sections. Nonetheless, it is still possible to compare the solvent-mixed system ‘5S (3.8)’ (actual concentration: 3.8 wt.%) and the melt-mixed system ‘3M (4.0)’ (actual concentration: 4.0 wt.%) due to their similar concentrations of untreated ZnO. It should be noted that the naming convention of the nanocomposites has been included in . For example, ‘5S (3.8)’ refers to targeted ZnO concentration of 5 wt.%, obtained from the solvent-mixed masterbatch, no surface treatment applied to ZnO particles, and containing 3.8 wt.% of actual ZnO concentration.
In essence, the solventless and high-shear mixing process of melt-mixing was more time-efficient for the large-scale production of masterbatches in this study and also contributed to more homogeneous filler dispersion as compared to solvent-mixing. Nevertheless, the ideal mixing strategy could only be confirmed after considering the impact of the mixing methods on the processability of the material. To achieve this, the following sections of this study will report the effect of solvent- and melt-mixing on the printability of the PLA-ZnO nanocomposites, taking into account the matrix MW and matrix-filler interactions, and the resulting thermal, rheological, and mechanical properties.
3.3. Effect of ZnO on the MW of PLA
shows the differential MW distribution curves of the original PLA pellets, the neat PLA filaments, the nanocomposite filaments 5S (3.8), and all the nanocomposite filaments produced from melt-mixed masterbatches, whereas shows the respective weight average molecular weight (Mw) and number average molecular weight (Mn), as well as the polydispersity index (PDI) calculated as the Mw/Mn ratio.
Figure 8. Differential MW distribution curves of PLA and nanocomposites.
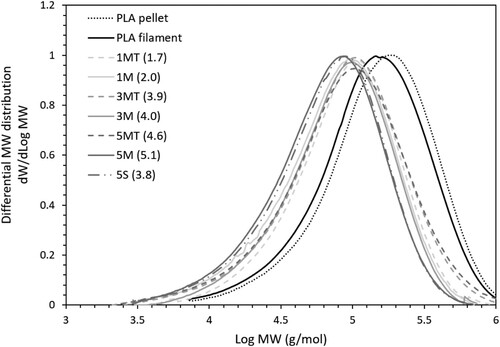
Table 3. Weight average molecular weight (Mw), number average molecular weight (Mn) and polydispersity index (PDI) of PLA and nanocomposites; average and standard deviation determined from two specimens per sample.
From , Mw and Mn of the neat PLA filaments decreased from the original values of the pellets, clearly indicating the chain scission that occurred after exposure to high processing temperatures and shear stresses [Citation63,Citation64]. In the presence of ZnO fillers, the chain cleavage at high temperature was worsened by the –OH groups on the surface of ZnO, resulting in further reductions in MW of the PLA matrix [Citation65,Citation66]. However, silanisation of the fillers partially removed the –OH groups from their surface as confirmed by FTIR spectra, protecting PLA from thermal degradation, and leading to Mw that were 12–40% higher than the nanocomposites filled with untreated fillers. The silane coating on the surface of ZnO is particularly useful for mitigating the degradative mechanisms at high filler loadings, to the point that, when filler loading was increased from the (nominal) concentration of 1 wt.% to the maximum (nominal) concentration of 5 wt.% tested in this study, surface-treated ZnO only decreased the Mw by 6.5%, as opposed to 13.5% without surface treatment.
The MW of the solvent-mixed 5S (3.8) and melt-mixed 3M (4.0) systems was also compared to evaluate the influence of the mixing strategy on the degradation of the PLA matrix. In , the Mw of 5S (3.8) was 14% lower than that of 3M (4.0), suggesting that the matrix experienced a higher degradation when the filament was fabricated using a solvent-mixed masterbatch than a melt-mixed one. Currently, the role of the solvent used in solvent-mixing on the degradation of PLA-ZnO composites is not as well understood as the effect of the high processing temperatures used in melt-mixing. Moreover, since different polymers and solvents may have different consequences, the results obtained for an individual polymer or solvent cannot be automatically translated to others, which makes the assessment of the effect of solvent-mixing on polymer degradation extremely complicated.
As thermal processing triggers the chain scission of PLA, there is a general expectation that the thermal degradation of the polymer can potentially be reduced with the use of a low processing temperature, such as in solvent-mixing [Citation57]. However, the benefits afforded by the low processing temperatures applied in solvent-mixing may be outweighed by the presence of solvents. Also, it is worth noting that the filaments in this study were all produced via melt-extrusion, which is a thermally driven process. Hence, all the filaments produced in this study have been thermally processed – once for the filaments fabricated from solvent-mixed masterbatches; and twice for the filaments fabricated from melt-mixed masterbatches. Therefore, the question now concerns if the additional thermal cycle experienced by the filaments of melt-mixed masterbatches imposed higher degradative effects on the nanocomposites.
Interestingly, despite undergoing only one thermal cycle, the filaments produced from solvent-mixed masterbatches experienced worse degradative effects than those produced from melt-mixed masterbatches. It is likely that the long duration of ultrasonic treatment of solvent-mixing has superseded the degrative effects induced by the high temperatures of melt-mixing. Tentatively, this may also be caused by the presence of residual traces of CHCl3 in the solvent-mixed masterbatches, which negatively affected the PLA matrix under elevated temperatures while extruding the filaments. Previously, similar outcomes were obtained by Narimissa et al. [Citation67], who reported that the successive melt extrusion of solvent-mixed PLA composites accelerated the degradation of the matrix due to the interaction between the trapped residuals of dichloromethane (the organic solvent used), and the polymer matrix at elevated temperatures. Moreover, Rueda et al. [Citation68] showed the potential for poly (lactic-L (+)-co-glycolic acid) (PLGA) to degrade in CHCl3. PLGA is a copolymer of lactic acid units and glycolic acid units [Citation69], where poly(glycolic acid) degrades similarly to PLA via the hydrolysis of ester linkages [Citation70]. Thus, it is reasonable to expect that CHCl3 residuals may promote the degradation of the PLA matrix while processing at high temperature.
MW strongly links to the basic properties of the polymer, such that a drop in MW generally results in poorer material properties [Citation71]. The MW of PLA decreased after the addition of ZnO, but this effect can be mitigated by pre-treating the filler's surface. In addition, matrix degradation could be reduced by producing filaments from melt-mixed masterbatches instead of solvent-mixed ones, as this avoids exacerbated degradation imposed by the long ultrasonication and the presence of trapped solvent residuals during thermal processing. In the following sections, the effect of the MW change will be further discussed with special attention for the material properties that govern the printability and the mechanical performance of PLA and its nanocomposites.
3.4. Thermal behaviour
3.4.1. DSC
shows the first heating, cooling and second heating steps in the DSC thermograms of PLA, 1ST (0.5) and 5M (5.1). The thermograms of all the other nanocomposites follow the same trend as 5M (5.1) and can be found in Figure S2. The Tg, Tcc, ΔHcc, Tm, ΔHm and Xc of the filaments derived from the first heating curves are listed in .
Figure 9. DSC curves of PLA, 1ST (0.5) and 5M (5.1): (a) first heating; (b) cooling; and (c) second heating.
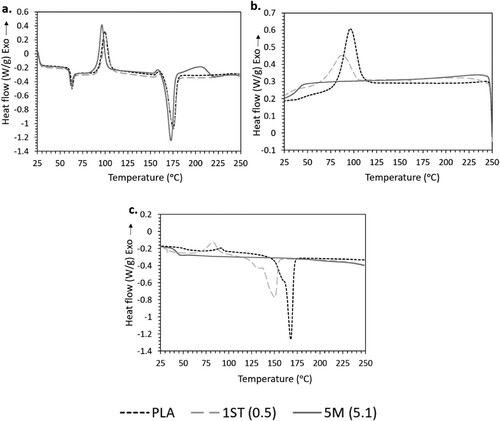
Table 4. Glass transition temperatures (Tg), cold crystallisation temperatures (Tcc), cold crystallisation enthalpies (ΔHcc), melting temperatures (Tm), melting enthalpies (ΔHm) and degree of crystallinity (Xc) of PLA and nanocomposite filaments derived from the first heating.
On first heating (a), neat PLA and its nanocomposites showed similar endothermic and exothermic events within the experimental temperature range. The gradual slope change around 59–62°C identifies the glass transition, i.e. the transition of the amorphous phase from a glassy to a rubbery state [Citation72], while the weak endothermic peak near the end is associated with molecular relaxation [Citation73]. The exothermic peak around 91–100°C represents cold crystallisation, and the endothermic peak around 172–175°C is due to the melting of PLA crystallites. The small exothermic shoulder prior to melting of the samples belongs to the transition of PLA crystallites from a disordered α’ to an ordered α phase [Citation74,Citation75].
On cooling (b), crystallisation peaks were only present in neat PLA and in 1ST (0.5). Conversely, crystallisation peaks were absent in the thermograms of the other composites, as exemplified by 5M (5.1).
Subsequently, on second heating (c), the exo- and endo-thermic peaks disappeared for all samples except for neat PLA and for the nanocomposites 1ST (0.5) and 1S (0.5) (the latter being shown in Figure S2c). The glass transition was still detectable for all samples, however, it was shifted towards lower temperatures in comparison to first heating. For samples with melting peaks, Tm also decreased during second heating and a double melting peak emerged.
As summarised in , the Tg and Tm of the nanocomposites as obtained from the first heating step remained very close to the values of neat PLA, with a difference of only 1–3°C. Notably, the thermal properties of PLA-ZnO composites have been widely researched, but without consensus. On the one hand, ZnO can decrease the Tg and Tm of PLA by increasing the chain mobility, due to accelerated chain scission and the resulting high chain-end concentration and excess free volume [Citation27,Citation32,Citation76,Citation77]. On the other hand, ZnO can increase the Tg and Tm of PLA, by obstructing the mobility of the polymer chains [Citation23].
Furthermore, the addition of either untreated or treated ZnO increased the Xc of PLA. This is because the nanocomposites possessed a greater chain mobility to crystallise, attributed to their shorter polymeric chains (previously discussed in Section 3.3) caused by the chain scission effects of ZnO [Citation78]. Noticeably, for nanocomposites with (actual) ZnO concentrations below 2.0 wt.%, surface treatment of the fillers appeared to impair the crystallisation of PLA with respect to the nanocomposites having comparable (actual) concentration of untreated ZnO. This is because chain scission was mitigated in the presence of the silane, leading to longer polymer chains with lower mobility, and thus, hindered crystallisation [Citation28,Citation79]. In addition, the orderly packing of PLA chains was disrupted by the strong interfacial interactions between PLA and treated ZnO [Citation80,Citation81]. However, as the (actual) ZnO concentration increased beyond 2.0 wt.%, the crystallisation of the nanocomposites decreased regardless of ZnO being surface treated or not. This is due to the significant increase in the chain end concentration, which act as defects that reduce the crystal growth rates [Citation82]. Though still detectable, such impairment of crystallisation was less evident in the case of treated fillers, likely because the degradative mechanisms were less severe, which resulted in having lower chain end concentrations.
Interestingly, the nanocomposites only featured a strong propensity to crystallise in the first heating, but not on the subsequent cooling and heating steps. This phenomenon can be justified by two explanations. Firstly, the first heating curve reflects the effects of the thermal history imparted on the filaments, thus, it is reasonable to assume that the initial propensity to (cold) crystallise was induced by melt extrusion during the filament fabrication process. During extrusion, polymer melts were forced out through the die at high shear rates and this promoted the stretching, orientation, and disentanglement of polymer chains. This likely favoured the formation of ordered regions (crystallites) [Citation83]. However, the crystalline structures disintegrated into a disordered structure after melting during the first heating step. And without shear force being applied in the subsequent DSC steps, PLA chains struggled to rearrange into orderly structures upon cooling and second heating. Molecular motion was further impeded by ZnO nanofillers acting as ‘pinning points’. Secondly, PLA-ZnO nanocomposites may have undergone further thermal degradation during the first heating cycle, leading to polymer chains that were too short to crystallise [Citation78]. Since the degrative effects are proportional to the concentration of ZnO, this may explain the residual ability of neat PLA and of the nanocomposite with the lowest concentration of treated ZnO (1ST (0.5)) to recrystallise during cooling.
The shift towards lower values of Tg and, if present, of Tm observed during the second heating step can be related to the reduction in thermal stability due to the thermal degradative effects imposed from the first heating cycle. Furthermore, the presence of the disordered α’ and the more ordered α crystalline phases contributed to the double melting peaks observed in the second heating curves, replacing the exothermic shoulders observed in the first heating curves [Citation28,Citation84].
Following this, DSC was also performed on the printed parts of neat PLA and nanocomposites with the highest untreated and treated ZnO concentrations for both 0° and 90° rasters, as shown in Table S2 and S3, respectively. In principle, the additional heating experienced by the material during printing (the filament must be melted during extrusion through the printhead), and the successive cooling and reheating of the rasters and layers during the part's build-up may affect the thermal properties and crystallinity of the material. Based on the results in Tables S2 and S3, the printing process did not induce any significant changes to the characteristic temperatures (Tg, Tcc and Tm) of the materials. In terms of Xc, it was further enhanced by printing for the neat PLA parts (0° and 90° rasters). This indicates that shear-induced crystallisation also applies to the material extrusion process of PLA during printing. Nonetheless, the Xc enhancement was not observed in the printed specimens of 5ST (2.5), 5S (3.8), 5MT (4.6) and 5M (5.1). It is possible that the high processing temperatures during printing may have caused the matrices of these nanocomposites to degrade further in the presence of high filler loadings, which deteriorated the molecular chains and hindered their ability to arrange into orderly structures. The reduction in thermal stability of these nanocomposites was also proven by a slight decrease in their Tm. As for the print orientation, Xc was not significantly affected by the raster angle of the printed specimens, as shown from their similar Xc in Table S2 and S3.
3.4.2. TGA
The thermal properties of PLA and its nanocomposites were also investigated by TGA. shows the TGA curves of neat PLA, 1ST (0.5) and 5M (5.1). The curves of all the other nanocomposites lie between 1ST (0.5) (upper bound) and 5M (5.1) (lower bound), and can be found in Figure S3. The values of the onset degradation temperature (Tonset) and peak degradation temperature (Tpeak) of all the samples are summarised in .
Figure 10. TGA curves of PLA, 1ST (0.5) and 5M (5.1).
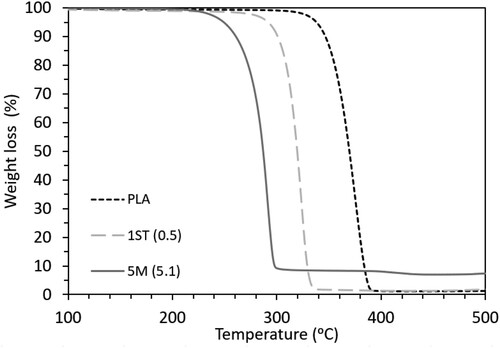
Table 5. Onset degradation temperatures (Tonset) and peak degradation temperatures (Tpeak) of PLA and nanocomposite filaments.
The degradation of PLA was shown to begin at 351°C and peak at 372°C, with a total weight loss of 98.5% resulting from the decomposition of PLA [Citation23,Citation85]. In , the curve of PLA clearly shifted towards lower temperatures after the incorporation of both untreated and treated ZnO, once again highlighting the catalytic role of the –OH groups of ZnO in the degradation of PLA [Citation23,Citation28,Citation86]. However, surface treatment of ZnO successfully improved the thermal stability of the nanocomposites, by increasing the Tonset and Tpeak of the nanocomposites by on average of 4% as compared to the nanocomposites filled with untreated ZnO. This corresponds to the ability of silane to increase the surface hydrophobicity of ZnO, contributing to a delay in water diffusion into PLA, which minimised the hydrolytic degradation of PLA [Citation25]. Moreover, as shown in and S3, an additional decomposition step appeared in the curves of PLA-ZnO nanocomposites around 390–450°C, and became more evident with increasing ZnO concentrations. This is a common occurrence in PLA-ZnO composites, due to the decomposition of PLA chains adsorbed on the surface of ZnO as a result of matrix degradation [Citation23,Citation65,Citation86].
According to , the thermal stability of the nanocomposites decreased with increasing filler concentration. However, further increasing the (actual) filler concentration above a threshold corresponding to 1.7 wt.% for treated ZnO and to 2.0 w.t% for untreated ZnO had marginal consequences on the thermal stability of the nanocomposites. Theoretically, the degradative effects should be proportional to the concentration of ZnO. Nevertheless, aside from catalysing the thermal degradation and hydrolysis of PLA as mentioned above, ZnO also acts as a thermal conductor in the nanocomposites [Citation87]. Thus, the inclusion of higher filler concentrations may have increased the thermal conductivity and hence the heat dissipation in the nanocomposites, consequently reducing the thermal degradative effects [Citation88]. While the benefits associated with the thermal conductivity of ZnO mainly depended on the composite composition and only became prominent when the (actual) concentration exceeded 2.0 wt.%, the effect of the mixing method on the thermal stability of the nanocomposites was negligible, as only minimal differences were observed between the thermal stability of solvent-mixed 5S (3.8) and melt-mixed 3M (4.0) (having comparable actual concentration of ZnO).
The thermal analysis through DSC and TGA confirmed the thermal sensitivity of PLA-ZnO nanocomposites, which may cause chain scission during melt extrusion and FFF printing. However, silane treatment was proven to be an effective solution for mitigating the degradative effect of ZnO and improving the thermal stability of the nanocomposites.
3.5. Phase analysis and crystallinity of the filaments and the printed parts through XRD
XRD was performed to further investigate the effect of ZnO nanoparticles on the crystallinity and phase composition of the filaments and the printed parts. The XRD results of the PLA, 1ST (0.5) and 5M (5.1) filaments and printed parts with 0° rasters are shown in a,b, respectively, whereas the diffractograms of the rest of the filaments and the printed parts can be found in Figure S4.
Figure 11. Diffractograms of PLA, 1ST (0.5) and 5M (5.1): (a) filaments; and (b) parts printed with 0° rasters.
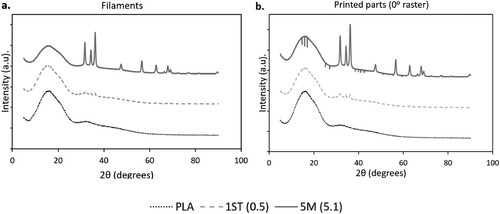
In , the XRD patterns did not present any peaks attributable to the crystalline phase(s) of PLA in both the filaments and the printed parts. Instead, the samples were characterised by a broad hump centring around 2θ = 16°, suggesting that PLA was mainly amorphous in all filaments, and remained such even after printing [Citation89-91]. The addition of ZnO generated new diffraction peaks in the XRD patterns, and according to the International Centre for Diffraction Data (ICDD) Powder Diffraction File (PDF) no. 00-36-1451, these new peaks at 2θ = 31.7°, 34.4°, 36.2°, 47.5°, 56.5°, 62.9°, 67.9°, 69.1° corresponded respectively to the (100), (002), (101), (102), (110), (103), (112) and (201) planes of the hexagonal wurtzite structure of ZnO [Citation92,Citation93].
Notably, the assessment of the crystallinity of PLA based on XRD diverged from the DSC results – XRD showed that all the filaments and the printed parts are amorphous; DSC showed some degree of crystallinity in both the filaments and the printed parts. This discrepancy arises from the difference in analytical method and from the distribution of crystalline and amorphous regions in the sample [Citation91]. DSC is a thermodynamical tool that determines crystallinity by comparing the enthalpy of fusion of the sample material (after subtracting the cold crystallisation enthalpy) to the enthalpy of fusion of 100% crystalline material at the equilibrium melting point. This thermal-analytical approach has been associated with a few disadvantages that impact the accuracy of crystallinity interpretation, including the potential overlapping of thermal events such as cold crystallisation, melting of crystalline domains with different structural perfection, recrystallisation, chain relaxation and melting of different crystal forms [Citation94]. Moreover, the degree of crystallinity estimated through DSC may be affected by the different temperature regions being considered for the assessment of the enthalpy of fusion of the experimental sample under exam and the 100% crystalline material [Citation95]. In contrast to DSC, XRD determines crystallinity under ambient conditions, where crystalline structures are identified from diffraction patterns based on the constructive interference of X-rays scattered from the crystal planes [Citation96]. For prevalently amorphous polymers, it was previously reported that the halo in the diffractogram may hide the weak peaks associated with the crystalline phases of samples with low crystallinity, which leads to the underestimation of the degree of crystallinity [Citation97]. However, one of the main factors that may explain the conflicting crystallinity measurements between the two analytical methods arises from their different testing conditions, especially in terms of temperature, as the degree of crystallinity of polymer matrices is sensitive to the changes in temperature experienced during DSC [Citation95]. Moreover, X-ray prevalently probe the surface of the samples, and it is very likely that the filaments after extrusion cool down more quickly on the surface than the core, providing less time for crystallisation to occur on the surface, and consequently leading to the more amorphous structure on the surface detected by XRD.
3.6. Rheological properties
The printability of a given material by FFF is strongly influenced by its rheological behaviour, which dictates two important characteristics, namely the flowability of the molten material through the print nozzle, and the dimensional stability of the printed structure. In extrusion-based printing, shear thinning (i.e. a reduction of the viscosity with increasing shear rate) is crucial to ensuring the processability of the material [Citation98]. During extrusion (and hence during printing), polymer melts are subjected to high shear rates; shear thinning results in low material viscosity to reduce the pressure needed for extrusion. On the other hand, at the nozzle exit, shear rates drop rapidly; shear thinning leads to high material viscosity to avoid premature extrusion and aids with extrudate shape retainment. Moreover, for viscoelastic materials like PLA, good printability relies on a balance between elastic and viscous responses of the material, described by G′ and G″, respectively. A material having a prevalent solid-like behaviour (G′ > G″) is ideal for shape retainment after printing, but can be difficult to be extruded from the print nozzle [Citation99]. Conversely, a fluid-like behaviour (G″ > G′) facilitates the interlayer adhesion of FFF parts, but causes premature dripping and poor shape retainment [Citation100].
a–c shows the complex viscosity, G′ and G″, respectively, of PLA and nanocomposites, plotted as a function of angular frequency. It must be emphasised that all the rheological measurements in this study were performed at 160°C instead of the print temperature of 230°C. This was necessary to account for the difference in residence time at elevated temperature during printing and during rheological experiments. During printing, the molten material resides in the heated liquefier for a few seconds before being extruded, which means that only a fraction of the material is actually heated up to the nominal print temperature [Citation101]. Conversely, during rheological measurements, the molten material resides between the heated plates of the rheometer for the whole duration of the test, which takes several minutes. As a result, it was necessary to lower the test temperature to 160°C to prevent premature degradation of the nanocomposites, and to achieve more reproducible and accurate rheological data.
Figure 12. Rheological properties of PLA and its nanocomposites: (a) complex viscosity; (b) storage modulus (G′); and (c) loss modulus (G″).
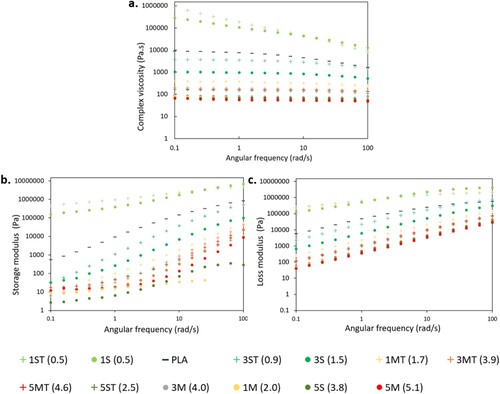
In a, the complex viscosity curve of PLA shows an initial plateau, indicating that molten PLA behaved like a Newtonian fluid, which then transitioned into a shear thinning non-Newtonian fluid whose viscosity decreased with frequency. This is because at low frequencies, deformation occurs very slowly such that the relaxation mechanism of the chains caused by Brownian motion has sufficient time to return the polymer molecules from a disturbed state back to their equilibrium configuration [Citation102]. However, as the frequency increases, polymer chains begin to disentangle and are forced to align with the flow [Citation103], leading to lower flow resistance and viscosity, a characteristic behaviour of shear thinning fluids. All nanocomposites exhibited shear thinning behaviour. However, the complex viscosity of PLA was higher than that of the nanocomposites at any given frequency except for 1ST (0.5) and 1S (0.5). Similarly, the curves in b,c also showed that all the nanocomposites except for 1ST (0.5) and 1S (0.5) exhibited lower G′ and G″ than PLA.
According to Osman and Atallah [Citation104], there are four main factors influencing the complex viscosity and the viscoelasticity (G′ and G″) of polymer composites: hydrodynamic effect, matrix properties, filler-matrix interactions, and filler-filler interactions. Firstly, the hydrodynamic effect relates to the increase in viscosity and modulus of the polymer after the inclusion of fillers, commonly expressed by the Guth-Gold equation (Equation 2), which is an extension of the Einstein viscosity equation for dilute, spherical particles to account for particle interactions at higher concentrations [Citation105]. In Equation (2), φ represents an effective volume fraction of filler, and η and ηo are the viscosities of the filled and unfilled polymer, respectively [Citation105,Citation106]. Considering the fact that particles are nearly always non-spherical, Equation (2) was modified to Equation (3) to account for the aspect ratio of rod-like fillers, represented by f, which can be further adjusted to accommodate for non-rod-shaped fillers [Citation105]. Both Equations (2) and (3) apply to the hydrodynamic reinforcement effect in the modulus of filled polymers.
(2)
(2)
(3)
(3) Nonetheless, not all the nanocomposites in this study conformed to the theoretical equations above, as evidenced by the decrease in both the complex viscosity and G′ of PLA after the addition of ZnO above (actual) 0.5 wt.%. This discrepancy can be justified by the remaining three factors including matrix properties, filler-matrix interactions, and filler-filler interactions.
The addition of ZnO lowered the MW of PLA and hence reduced the chain entanglement after processing. This increased the matrix chain mobility of the nanocomposites. This in turn decreased the flow resistance of the nanocomposites, leading to a reduction in the viscosity and G′. Following this, shear thinning effects of the nanocomposites also reduced due to the low density of chain entanglement. Interestingly, both 1ST (0.5) and 1S (0.5) behaved anomalously to the rest of the nanocomposites, exhibiting higher viscosity, shear thinning effects, and viscoelastic properties than neat PLA. It was also apparent that the frequency dependence of G′ of 1ST (0.5) and 1S (0.5) at low frequencies was weaker than that of neat PLA. Fundamentally, these phenomena have been commonly reported in composites when the filler concentration reaches a critical value known as the ‘rheological percolation threshold’ [Citation60,Citation107-109]. At the percolation threshold, filler-filler interactions are mediated by the polymer matrix, promoting the adhesion of polymer chains onto the surface of the fillers, ultimately leading to the development of a polymer-filler network [Citation104,Citation110]. As a result, frictional interactions between the dispersed fillers, and between the fillers and the polymer molecules increase significantly, leading to higher viscosity as well as a more solid-like behaviour, which corresponds to the transition of the viscoelastic behaviour of the polymer from liquid- to solid-like [Citation111]. Moreover, the enhancement in G′ is usually accompanied by a diminished frequency dependency of G′ at low frequencies, due to the restricted long-range polymer relaxations caused by the presence of network-like structures [Citation112,Citation113].
Based on the increase in viscosity and G′ of 1ST (0.5) and 1S (0.5), it can be deduced that the percolation concentration of ZnO in this study is around 0.5 wt.%. The percolation threshold was further determined from the viscoelastic liquid–solid transition of the materials shown in Figure S5. In Figure S5a, PLA exhibits a predominantly fluid-like behaviour (G″ > G′), with a G″ = G′ cross over point at approximately 40 rad/s. With the incorporation of (actual) 0.5 wt.% of untreated ZnO, another crossover point appeared in the low-frequency region of 1S (0.5) (Figure S5b). And with the addition of 0.5 wt.% of treated ZnO, the crossover points disappeared, showing two parallel lines dominated by G′ across the entire frequency range in exam, indicating a primarily solid-like behaviour of 1ST (0.5) (Figure S5c). Previously, Mun et al. [Citation114] described these changes in cross over points as the process of achieving rheological percolation in polymeric systems. Although both 1ST (0.5) and 1S (0.5) have the same nanofiller concentration, only 1ST (0.5) exhibited a complete solid-like behaviour across the entire frequency range under exam. The achievement of a fully solid behaviour in 1ST (0.5) may arise from the improved interfacial affinity between the fillers and the matrix in the presence of silane. This is because silane contains both inorganic and organic functional groups [Citation115] which can respectively bind with ZnO and react with PLA. Consequently, the enhancement in matrix-filler interfacial interactions promoted more chain bridging and chain adsorption, which increased the likelihood of forming an interconnected polymer-network structure.
According to Zhu et al. [Citation116], the MW of the polymer matrix is a crucial factor determining the interaction between the matrix and the fillers. A higher MW, i.e. the presence of longer polymer chains, promotes more efficient chain bridging, an effect deemed essential for the establishment of a continuous polymer-filler network. With regard to the PLA-ZnO composites under investigation, it may be hypothesised that the chain scission effect caused by ZnO was still limited at 0.5 wt.%, and hence outweighed by the networking effect. In other words, the MW of the matrix was still sufficient to mediate filler-filler interactions to increase the complex viscosity and solid-like behaviour of the matrix. However, when the filler concentration exceeded 0.5 wt.%, the chain scission effect dominated and prevailed on the networking ability of the system. In addition, the incorporation of higher filler loadings promoted the formation of filler aggregates, which reduced the real surface area of the fillers available for interacting with the matrix and increased the average distance between (secondary/aggregated) particles. Consequently, the drop in MW and the limited matrix-filler networking ability significantly reduced the matrix viscosity and favoured the fluid-like behaviour of PLA (). These results correlate well with the internal structures of the printed parts observed in the µCT scans as discussed below in Section 3.7. The highly filled nanocomposites, due to their prevalent viscoelastic-fluid behaviour and lower melt viscosities, manifested greater material outflow during printing than neat PLA. This largely increased the deposition flow rates of the nanocomposites, and caused difficulty for the rasters to retain their structural integrity and geometry. Meanwhile, this also increased the inter-raster and inter-layer fusion, which led to the indistinctive interfaces observed between adjacent rasters and layers, for example, in 3M (4.0) and 5M (5.1) shown in Figure S1.
Notably, as previously mentioned, while the rheological properties of the nanocomposites were at first strongly dependent on the filler loading (), they became nearly constant when the (actual) ZnO concentration was more than 1.7 and 2.0 wt.% for treated and untreated particles, respectively. Similarly, Zhu et al. [Citation116] reported that the rheological properties of polybutadiene (PBD)/silica composites became insensitive to the filler loading when the MW of PBD was too low to mediate filler-filler interactions. Accordingly, without matrix mediation, filler-filler interactions were dominated by direct association between filler particles, and ceased to depend on the MW of the polymer matrix [Citation116]. In the present study, it is deduced that when the MW of the polymer matrix dropped below a certain threshold (105.2 kDa for untreated ZnO and 125.2 kDa for treated ZnO), the matrix chain length became insufficient to enable effective chain adsorption and chain bridging for the formation of continuous polymer-filler networks. This led to the merging of the rheological curves following the increase in filler loadings above 1.7 and 2.0 wt.% of treated and untreated fillers, respectively. For this reason, comparing the results of the rheological analysis of the 5S (3.8) and 3M (4.0) nanocomposites does not allow to reach any conclusion regarding the role of the mixing strategy on the rheological behaviour, since both nanocomposites have dropped below the MW threshold for effective polymer-filler networking.
As shown from the results above, there is an important interplay between the matrix MW, matrix-filler interactions and filler-filler interactions on the rheological properties of the nanocomposites. At low levels of ZnO loadings, the retained MW of the polymer matrix and the presence of relatively few filler aggregates enabled the polymer chains to exert a bridging effect between filler particles and induced the formation of interconnected network structures. However, with increasing filler concentrations, the matrix-filler networking effects progressively diminished due to the increasing number of filler aggregates and the progressively shorter matrix chain length. The MW of the matrix eventually decreased below a threshold where the chains became too short to bridge the fillers, and as a result, the rheological properties became insensitive to any further decrease in matrix MW. Due to the limit imposed by MW, the effect of ZnO (actual) concentrations above 1.7 w.t% and 2.0 wt.% for untreated and treated filler, respectively, and the effect of different mixing strategies on the rheological properties of the nanocomposites became negligible. Nonetheless, the influence of the abovementioned factors on the printability of the nanocomposites can be appreciated through other means, including the mechanical characterisation elaborated in Section 3.8.
3.7. µCT and porosity
compares the porosity of the tensile specimens printed with both raster orientations for neat PLA and its nanocomposites. The X-Y and X-Z planes of the µCT scans of the tensile specimens printed with 0° rasters have been illustrated in Figures S1.1–S1.13.
Table 6. Porosity of the tensile specimens determined from a cut size of 20 mm × 20 mm × 3 mm.
As shown in Figures S1.1–S1.13, FFF parts are built progressively from the addition and welding of layers along the build direction, and of individual adjoining rasters within each layer. Under realistic FFF operating conditions, the rasters and layers will solidify before complete coalescence [Citation4], leading to the formation of internal voids between the rasters and layers. Therefore, porosity is inevitable in FFF parts due to their inherent raster- and layer-based structure, and is generally accompanied by weak inter-raster and -layer adhesion. Although the values in were measured on a single sample for each material formulation, the porosity values were obtained from a sample size (22mm × 25mm × 3 mm) that is reasonably representative of the whole tensile specimen. In , the porosity of neat PLA 3D printed coupons ranged between 17% and 18%, and was not significantly affected by the print orientation. Conversely, the porosity of the PLA-ZnO nanocomposites varied largely between 3% and 20%, and demonstrated higher sensitivity to the print orientation as shown, for example, by 3S (1.5), 3M (4.0), 5S (3.8), and 5M (5.1).
It is difficult to establish a correlation between the porosity of the 3D printed parts and the variables examined in this research, including ZnO concentration, surface treatment of ZnO, and mixing strategy of the masterbatch. In one respect, high concentrations of ZnO reduced the viscosity and G′ of the filaments, which assisted with the fusion between neighbouring rasters, contributed to the formation of smaller inter-raster gaps, and ultimately reduced the overall porosity, as visible for example in 5ST (2.5) (Figure S1.10). However, 5S (3.8) (Figure S1.11) was more porous than 5ST (2.5) in spite of being richer in ZnO (actual concentration of 3.8 vs. 2.5 wt.%) due to more abundant discontinuities, voids and non-uniformities being present within the individual rasters, all of which resulted in higher porosity.
Based on qualitative observations conducted while handling and printing the filaments, PLA filaments functionalised with untreated ZnO were more brittle than those functionalised with surface-treated ZnO. This empirical observation matched well the finding that the MW of the PLA matrix was on average lower for the samples containing untreated ZnO than for their counterparts functionalised with treated ZnO, as previously discussed in Section 3.3. In other words, the brittle behaviour was caused by low MW chains being easily separated from one another [Citation117], and this led to frequent filament breakage during printing. As a consequence, the disrupted material outflow from the nozzle resulted in uneven material extrusion, which is a major cause of print defects, as seen for instance in 5S (3.8) (Figure S1.11) and 5M (5.1) (Figure S1.13). Porosities that arise from print defects are unpredictable and may cause a large discrepancy in the porosity values of samples printed with the same feedstock material under different print orientations, as shown in for 3M (4.0), 5S (3.8) and 5M (5.1). For instance, the porosity of 3M (4.0), 5S (3.8) and 5M (5.1) was significantly higher when the samples were printed with 0° rasters than with 90° rasters. Tentatively, this may be related to the different path lengths imposed by the different print orientations, which are 200 mm for 0° rasters and just 22 mm for 90° rasters. Due to the longer raster deposition path required by the 0° rasters, the likelihood of generating raster discontinuities and non-uniformities increased during printing, which led to higher porosities in the samples printed with 0° rasters than their counterparts printed with 90° rasters. As opposed to this, filaments of neat PLA and those functionalised with surface-treated ZnO exhibited a similar porosity for both print orientations. These filaments containing treated ZnO could be printed in a more continuous and reliable fashion as compared to those with untreated fillers. Hence, the likelihood of generating print defects was relatively low regardless of the print orientation.
Porosities are known to negatively impact the mechanical performances of 3D printed parts [Citation118,Citation119], and it is therefore important to analyse the influence of the internal structure on the tensile properties of the printed parts, which will be elaborated in the following section.
3.8. Mechanical properties
The bar charts in show the average value and standard deviation of the ultimate tensile strength (σUTS) of the printed parts under different raster angles, whereas the line graphs show the corresponding porosity values. The average values and standard deviations of the elongation at break (ϵ) and the elastic modulus (E) of the tensile samples are plotted as bar charts in and , respectively.
Figure 13. Relationships between average and standard deviations of σUTS (tensile strength) and porosity of PLA and nanocomposites: (a) solvent-mixed systems (0° raster); (b) melt-mixed systems (0° raster); (c) solvent-mixed systems (90° raster); and (d) melt-mixed systems (90° raster).
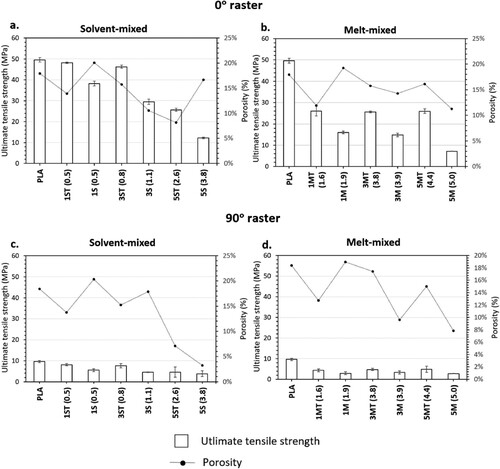
Figure 14. Average values and standard deviations of ϵ (elongation at break) of PLA and nanocomposites: (a) solvent-mixed systems; and (b) melt-mixed systems.
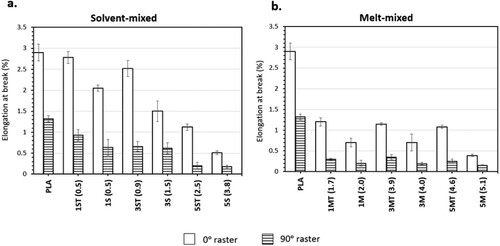
Figure 15. Average values and standard deviations of E (elastic modulus) of PLA and nanocomposites: (a) solvent-mixed systems; and (b) melt-mixed systems.
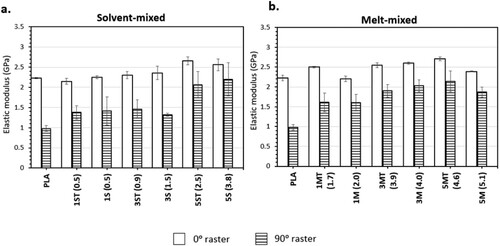
The effect of the raster angle on the σUTS, ϵ and E of PLA and PLA-ZnO nanocomposites is evident. all showed that a change in raster angle from 0° to 90° caused a notable reduction in the tensile properties (σUTS: 61–81%, ϵ: 54–82% and E: 4–56%). A detailed discussion on the anistropic behaviour induced by the change in raster angle has been published by these authors in a separate study [Citation45], where the anisotripc effects were mainly attributed to the difference in failure modes imposed by the raster orientation. Furthermore, as compared to the samples printed with 0° rasters, the standard deviations of the tensile data of the samples printed with 90° raster angle were much higher, and therefore less ideal to be used for interpretation and more difficult to be used for structural design purposes.
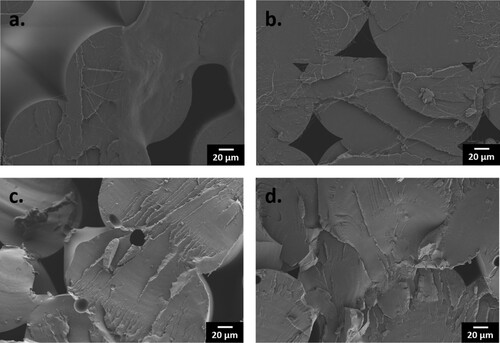
shows the fractured surfaces of PLA and nanocomposite parts printed with 0° rasters. The smooth fractured surfaces are inherent characteristics of a brittle failure, which is consistent with low ϵ of below 5% observed for these samples [Citation120]. However, it was also shown that the smooth fractured surfaces of PLA became rougher with increasing ZnO concentrations, due to more fillers obstructing the crack propagation [Citation121].
Figure 16. Fractured surfaces of the samples printed with 0° rasters: (a) PLA; (b) 1ST (0.5); (c) 3M (4.0); and (d) 5S (3.8). Scale bar: 20 µm for all micrographs.
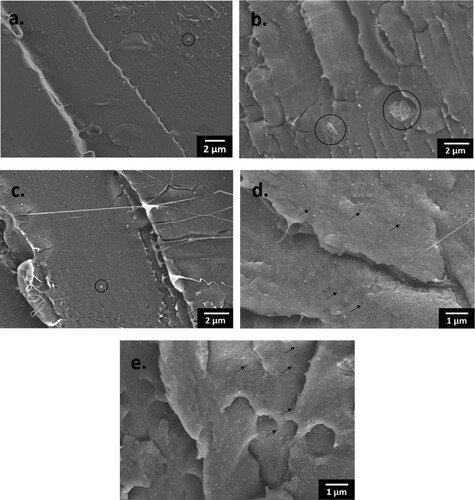
When printed with 0° rasters, neat PLA has a σUTS of 49.6 MPa, which dropped after the incorporation of either treated or untreated ZnO. σUTS measures the maximum tensile stress withstood by the material when subjected to tension. The σUTS of the nanocomposites decreased as a result of inefficient matrix-filler stress transfer, due to the presence of localised stress concentration sites generated by the filler aggregates within the matrices (b) [Citation34,Citation39,Citation122]. Moreover, there is evidence of weak matrix-filler interfacial adhesion, as indicated by the voids formed from the de-bonding of the fillers from the matrix, for example, shown in the fracture surfaces of 3M (4.0) (d) and 5S (3.8) (e).
Figure 17. Fractured surfaces showing filler aggregates (black circle) in (a) 1ST (0.5); (b) 3M (4.0); (c) 5MT (4.6), with a scale bar of 2 µm; and voids (black arrow) in (d) 3M (4.0); and (e) 5S (3.9), with a scale bar of 1 µm.
ϵ is a measure of the ability of the material to deform before breaking. The addition of ZnO reduced the ϵ of PLA, and hence its ability to accommodate a strain, because the matrix chain mobility was restricted by the presence of fillers and filler aggregates. Meanwhile, this restraining effect is also responsible for incresing the material's resistance to elastic deformation, which is the stiffness of the material, and this explains the increase in E of the nanocomposites.
Among the nanocomposites, 1ST (0.5) showed the best tensile properties and also the most comparable ones to PLA, due to the fact that 1ST (0.5) had the lowest filler concentration, and the fillers had been surface-treated. In a, it was shown that filler aggregation could not be completely avoided even for 1ST (0.5), owing to the strong surface energy and polarity of ZnO nanofilers [Citation123]. Nontheless, agglomeration was clearly less prominent than it was in the highly-filled nanocomposites, for example, shown in 3M (4.0) (b). Meanwhile, the tensile properties of 1ST (0.5) were also ameliorated by the use of treated fillers, which were associated with enhanced filler dispersion and improved matrix-filler interactions. The positive contribution of surface treatment can be further demonstrated by comparing the filler dispersion between 5MT (4.6) (treated ZnO) and 3M (4.0) (untreated ZnO). Despite having a higher filler concentration, 5MT (4.6) (shown in c) did not present the large filler clusters as shown in 3M (4.0) (b). The improvement in the dispersion of treated fillers increased the interfacial areas and led to better matrix-filler interactions, which contributed to the higher tensile properties observed for the all nanocomposites functionalised with treated fillers.
Matrix MW is another crucial aspect determinining the tensile properties of polymer composites [Citation124]. Low MW polymers tend to be brittle and mechanically weak as the polymer chains can easily slide past each other when stress is applied [Citation125]. The chain scission of PLA induced by thermal processing, and further exacerbated by the addition of ZnO, reduced the chain entanglement density of the polymer, and also decreased the number of ‘tie molecules’ responsible for the stress transfer between the crystalline and amorphous phases. As a result, in this study, comparable tensile properties were measured for nanocomposites whose matrix had comparable MW. For instance, with the MW being nearly the same, the σUTS of 1M (2.0) and 3M (4.0) was 16.0 and 14.8 MPa, respectively, and the ϵ was 0.7% for both nanocomposites. This observation was even more pertinent to the nanocomposites functionalised with treated fillers. The σUTS and ϵ of 1MT (1.7), 3MT (3.9), 5ST (2.5) and 5MT (4.6) levelled off around 25–26 MPa, and around 1.1–1.2%, respectively, despite having different filler concentrations. This was likely due to the comparable MW of the PLA matrix in the filaments used for printing them, as listed in . The effect of the matrix MW can also explain the effect of different mixing strategies on the tensile properties of the nanocomposites. Given the lower MW of the PLA matrix, the tensile properties of the solvent-mixed 5S (3.8) system were slightly lower than those of the melt-mixed 3M (4.0) system (with the actual concentration of the filler being comparable for the two nanocomposites).
Moreover, the MW of the polymer matrix helps explain the apparently counterintuitive result that the highly-filled nanocomposites still exhibited significantly weaker tensile properties than PLA, in spite of having lower porosity (). According to the observation by Levenhagen et al. [Citation126], the addition of low MW additives into PLA filaments reduced the void spaces and improved the interlayer adhesion of the printed parts and led to stronger mechanical properties, attributed to the fact that low MW polymers more readily diffuse across the inter-raster and-layer interfaces. However, an imperative prerequisite for this to happen is that the low MW chains must have sufficient length to entangle across the adjacent interfaces [Citation126]. In this case, it is justified to conclude that the chain lengths of the low MW nanocomposites were too short to effectively entangle across the adjacent layers, leading to weak interfacial bonding. As a result, despite having lower porosities, the tensile properties the nanocomposites remained inferior to that of the PLA samples, which presented higher void contents, but also greater inter-raster and -layer chain entanglement density.
Based on the results, the majority of the nanocomposites prepared starting from solvent-mixed masterbatches showed better tensile properties than the parts obtained starting from melt-mixed masterbatches. This can be attributed to their lower (actual) filler concentrations as discussed in Section 3.2. Hence, the nanocomposites of solvent-mixed systems were less impacted by filler aggregates than those of melt-mixed systems, leading to better tensile properties. However, apart from the effect of the actual filler concentration, the use of melt-mixed masterbatches led to nanocomposites with better tensile properties. This was evident, for example, comparing 5S (3.8) and 3M (4.0), which had nearly the same (actual) filler loading. The difference was due to the lower extent of matrix degradation experienced by the melt-mixed masterbatches upon thermal processing. Finally, surface treatment of ZnO significantly improved the tensile properties by enhancing both the matrix-filler interfacial adhesion and the matrix properties (mitigated chain scission) of the nanocomposites. Notably, whilst the strength of the nanocomposites containing untreated fillers kept decresing for increasing filler loadings, the tensile properties remained unaffected when the concentration of treated fillers was increased above 1.7 wt.% up to the maximum concentration tested in this study. This shows that silane treatment can be a potential solution for fabricating nanocomposites requiring high ZnO concentrations to achieve specific functionalities without compromising their mechanical properties.
4. Conclusion
This study has successfully developed and printed PLA-ZnO nanocomposites filled with up to 5 wt.% of ZnO nanofillers, and systematically investigated the printability of the nanocomposites by evaluating the effects of three main parameters: (i) masterbatch mixing strategy, (ii) ZnO filler concentration and (iii) surface treatment (silanisation) of ZnO on the thermal behaviour, rheological and mechanical properties of the nanocomposites. ZnO nanofillers are notorious for accelerating the matrix degradation and for aggregating in PLA matrices, which all negatively impact the printability and the mechanical performances of the nanocomposites. This study has shown the potential to improve both the printability and the tensile properties of the nanocomposites by properly choosing and adjusting the abovementioned parameters. In particular, the most significant improvement was achieved by functionalising the surface of the fillers with silane, which effectively mitigated the degradative effects of ZnO at all filler concentrations regardless of the masterbatch mixing strategy. Additionally, the effects of masterbatch mixing strategy and filler concentration are summarised as follows:
Effect of masterbatch mixing strategy: The use of melt-mixed as compared to solvent-mixed masterbatches for filament fabrication improved the matrix properties of the nanocomposites in this study. This was mainly due to the absence of matrix degradation induced by the solvent residuals upon thermal processing, which directly increased the mechanical performance of the printed nanocomposites. Moreover, due to its solvent-free and high-shear mixing process, melt-mixing was more time-efficient to produce the masterbatches in this study (highly concentrated PLA-ZnO nanocomposites) on a large scale, and achieved better filler dispersion in comparison to solvent-mixing.
Effect of ZnO concentration: The matrix properties of the nanocomposites reduced with increasing filler concentrations, which negatively impacted the processability of the nanocomposites. Specifically, the printability of the filaments decreased due to increased filament brittleness accompanied by reduced melt viscosities. This increased the generation of print defects and decreased the quality of the printed parts. Furthermore, the low chain entanglement density across the inter-layer and inter-raster interfaces of the printed parts significantly reduced the mechanical performances of the nanocomposites. Nonetheless, surface treatment successfully mitigated the degradative effects of ZnO, such that the tensile properties of the nanocomposites remained almost unaffected when the concentration of the treated fillers was increased beyond 1.7 wt.%.
Supplemental Material
Download MS Word (2.4 MB)Acknowledgements
CW, YL and PW are supported by the Australian Research Council (ARC) through the discovery grant DP210101862. AS and DPS are supported by the Commonwealth Scientific and Industrial Research Organisation (CSIRO) Research Office through the ‘Science Leader in Active Materials’ grant. The authors would like to acknowledge Jacinta White from the CSIRO Manufacturing Morphology and Structure Group within the Materials Characterisation and Modelling Program for her TEM contribution to this project. The authors would like to acknowledge Terry Turner from Micronisers Pty. Ltd. for supplying the ZnO nanoparticles used in this project.
Disclosure statement
No potential conflict of interest was reported by the author(s).
Data availability statement
Data will be made available on request.
Additional information
Funding
References
- Bachtiar EO, Erol O, Millrod M, et al. 3D printing and characterization of a soft and biostable elastomer with high flexibility and strength for biomedical applications. J Mech Behav Biomed Mater. 2020;104:103649. doi:10.1016/j.jmbbm.2020.103649
- International Organization for Standardization Standard/Technical Committee 261. ISO/ASTM 52900:2021. 2nd ed. International Organization for Standardization Standard, Switzerland, Geneva, 2021.
- Izdebska-Podsiadły J. Materials for 3D printing. In: Izdebska-Podsiadły J, editor. Polymers for 3D printing: Methods, properties, and characteristics. 1st ed. San Diego, CA: Elsevier Science and Technology; 2022. p. 35–49.
- Tao Y, Kong F, Li Z, et al. A review on voids of 3D printed parts by fused filament fabrication. J Mater Res Technol. 2021;15:4860–4879. doi:10.1016/j.jmrt.2021.10.108
- Sola A. Materials requirements in fused filament fabrication: a framework for the design of next-generation 3D printable thermoplastics and composites. Macromol Mater Eng. 2022;307:2200197. doi:10.1002/mame.202200197
- Maguire A, Pottackal N, Saadi MASR, et al. Additive manufacturing of polymer-based structures by extrusion technologies. Oxf Open Mater. 2021;1:itaa004. doi:10.1093/oxfmat/itaa004
- Bayart M, Charlon S, Soulestin J. Fused filament fabrication of scaffolds for tissue engineering; how realistic is shape-memory? A review. Polym. 2021;217:123440. doi:10.1016/j.polymer.2021.123440
- Darling CJ, Curtis C, Sciacca BJ, et al. Fused filament fabrication of complex anatomical phantoms with infill-tunable image contrast. Addit Manuf. 2022;52:102695. doi:10.1016/j.addma.2022.102695
- DeStefano V, Khan S, Tabada A. Applications of PLA in modern medicine. Eng Regen. 2020;1:76–87. doi:10.1016/j.engreg.2020.08.002
- González-Henríquez CM, Sarabia-Vallejos MA, Hernandez JR. Antimicrobial polymers for additive manufacturing. Int J Mol Sci 2019;20:1210. doi:10.3390/ijms20051210
- Gruber P, Hoppe V, Grochowska E, et al. Material extrusion-based additive manufacturing of poly(lactic acid) antibacterial filaments - A case study of antimicrobial properties. Polym. 2021;13:4337. doi:10.3390/polym13244337
- Podstawczyk D, Skrzypczak D, Połomska X, et al. Preparation of antimicrobial 3D printing filament: in situ thermal formation of silver nanoparticles during the material extrusion. Polym Compos. 2020;41:4692–4705. doi:10.1002/pc.25743
- Hamad K, Rehman Z. Review of recent advances in polylactic acid/TiO2 composites. Mater. 2019;12:3659. doi:10.3390/ma12223659
- Sefidan AM. Novel silicon dioxide-based nanocomposites as an antimicrobial in poly(lactic acid) nanocomposites films. J Nanomed Res. 2018;3:65–70. doi:10.22034/nmrj.2018.02.002
- Form Futura. Copper 3D PLActive. The Netherland: Form Futura [cited 2023 Aug 30]. Available from: https://formfutura.com/product/plactive/.
- 3DXTECH. BioGuard antibacterial PLA. Michigan: 3DXTECH [cited 2023 Aug 30]. Available from: https://www.3dxtech.com/product/antibacterial-pla/.
- Almatroudi A. Silver nanoparticles: synthesis: characterisation and biomedical applications. Open Life Sci. 2020;15:819–839. doi:10.1515/biol-2020-0094
- Gudikandula K, Maringanti SC. Synthesis of silver nanoparticles by chemical and biological methods and their antimicrobial properties. J Exp Nanosci. 2016;11:714–721. doi:10.1080/17458080.2016.1139196
- Naz S, Gul A, Zia M. Toxicity of copper oxide nanoparticles: a review study. IET Nanobiotechnol. 2020;14:1–13. doi:10.1049/iet-nbt.2019.0176
- Hou J, Liu H, Wang L, et al. Molecular toxicity of metal oxide nanoparticles in Danio rerio. Environ Sci Technol. 2018;52:7996–8004. doi:10.1021/acs.est.8b01464
- Anreddy RNR. Copper oxide nanoparticles induces oxidative stress and liver toxicity in rats following oral exposure. Toxicol Rep. 2018;5:903–904. doi:10.1016/j.toxrep.2018.08.022
- Ridwan R, Rihayat T, Suryani S, et al. Combination of poly lactid acid zinc oxide nanocomposite for antimicrobial packaging application. IOP Conf. 2020;830:042018. doi:10.1088/1757-899X/830/4/042018
- Kim SY, Karthika V, Gopinath K, et al. Poly(Lactic Acid)/ZnO bionanocomposite films with positively charged ZnO as potential antimicrobial food packaging materials. Polym. 2019;11:1427. doi:10.3390/polym11091427
- Rashedi SM, Ramin K, Abosaeed R, et al. Ovel PLA/ZnO nanofibrous nanocomposite loaded with tranexamic acid as an effective wound dressing: in vitro and in vivo assessment. Iran. J Biotechnol. 2021;19:38–47. doi:10.30498/IJB.2021.220458.2737
- Chong WJ, Shen S, Li Y, et al. Biodegradable PLA-ZnO nanocomposite biomaterials with antibacterial properties,: tissue engineering viability, and enhanced biocompatibility. Smart Mater Manuf. 2023;1:100004. doi:10.1016/j.smmf.2022.100004
- Ghozali M, Triwulandari E, Meliana Y, et al. Thermal properties of polylactic acid/zinc oxide biocomposite films. AIP Conf Proc. 2018;2024:020032. doi:10.1063/1.5064318
- Anžlovar A, Kržan A, Žagar E. Degradation of PLA/ZnO and PHBV/ZnO composites prepared by melt processing. Arab. J Chem. 2018;11:343–352. doi:10.1016/j.arabjc.2017.07.001
- Murariu M, Benali S, Paint Y, et al. Adding value in production of multifunctional polylactide (PLA)–ZnO nanocomposite films through alternative manufacturing methods. Mol. 2021;26:2043. doi:10.3390/molecules26072043
- Dadashi P, Babaei A, Abdolrasouli MH. Investigating the hydrolytic degradation of PLA/PCL/ZnO nanocomposites by using viscoelastic models. Polym Eng Sci. 2022;62:869–882. doi:10.1002/pen.25893
- Benali S, Aouadi S, Dechief AL, et al. Key factors for tuning hydrolytic degradation of polylactide/zinc oxide nanocomposites. Nanocomposites. 2105;1:51. doi:10.1179/2055033214Y.0000000007
- Shojaeiarani J, Bajwa D, Jiang L, et al. Insight on the influence of nano zinc oxide on the thermal,: dynamic mechanical, and flow characteristics of Poly(lactic acid)– zinc oxide composites. Polym Eng Sci. 2019;59:1242–1249. doi:10.1002/pen.25107
- Murariu M, Doumbia A, Bonnaud L, et al. High-performance Polylactide/Zno nanocomposites designed for films and fibers with special end-use properties. Biomacromol. 2011;12:1762–1771. doi:10.1021/bm2001445
- Rokbani H, Ajji A. Rheological properties of poly(lactic acid) solutions added with metal oxide nanoparticles for electrospinning. J Polym Environ. 2018;26:2555–2565. doi:10.1007/s10924-017-1155-6
- Jayaramudu J, Das K, Sonakshi M, et al. Structure and properties of highly toughened biodegradable polylactide/ZnO biocomposite films. Int J Biol Macromol. 2014;64:428–434. doi:10.1016/j.ijbiomac.2013.12.034
- Karim SFA, Jai J, Saiful NA, et al. Effect of different red palm oil volume on characteristics and degradation of polylactic acid/zinc oxide film. IOP Conf. 2021;1176:012002. doi:10.1088/1757-899X/1176/1/012002
- Therias S, Larché JF, Bussière PO, et al. Photochemical behavior of Polylactide/ZnP nanocomposite films. Biomacromol. 2012;13:3283–3291. doi:10.1021/bm301071w
- Arfat YA, Ahmed J, Al Hazza A, et al. Comparative effects of untreated and 3-methacryloxypropyltrimethoxysilane treated ZnO nanoparticle reinforcement on properties of polylactide-based nanocomposite films. Int J Biol Macromol. 2017;101:1041–1050. doi:10.1016/j.ijbiomac.2017.03.176
- Mallakpour S, Madani M. Use of silane coupling agent for surface modification of zinc oxide as inorganic filler and preparation of poly(amide-imide)/zinc oxide nanocomposite containing phenylalanine moieties. Bull Mater Sci. 2012;35:333–339. doi:10.1007/s12034-012-0304-8
- Jamnongkan T, Jaroensuk O, Khankhuean A, et al. A Comprehensive evaluation of mechanical,: thermal, and antibacterial properties of PLA/ZnO nanoflower biocomposite filaments for 3D printing application. Polym. 2022;14:600. doi:10.3390/polym14030600
- Kumar R, Singh R, Singh M, et al. ZnO nanoparticle-grafted PLA thermoplastic composites for 3D printing applications: tuning of thermal,: mechanical, morphological and shape memory effect. J Thermoplast Compos. 2020;35:799–825. doi:10.1177/0892705720925119
- Singh M, Singh R, Kumar R, et al. On 3D-printed ZnO-reinforced PLA matrix composite: tensile,: thermal, morphological and shape memory characteristics. J Thermoplast Compos. 2022;35:1510–1153. doi:10.1177/0892705720935961
- Junpha J, Wisitsoraat A, Prathumwan R, et al. Electronic tongue and cyclic voltammetric sensors based on carbon nanotube/polylactic composites fabricated by fused deposition modelling 3D printing. Mater Sci Eng. 2020;117:111319. doi:10.1016/j.msec.2020.111319
- NatureWorks. Ingeo Biopolymer 3D850 Technical Data Sheet. Minnetonka: NatureWorks [cited 2023 Aug 30]. Available from: https://www.natureworksllc.com/~/media/Files/NatureWorks/Technical-Documents/Technical-Data-Sheets/TechnicalDataSheet_3D850_monofilament_pdf.pdf?la = en.
- Micronisers. Nanosun Zinc oxide P99/30. Australia: Microniser [cited 2023 Aug 30]. Available from: https://www.micronisers.com/nanosun-zinc-oxide-p99-30/.
- Sola A, Chong WJ, Simunec DP, et al. Open challenges in tensile testing of additively manufactured polymers: a literature survey and a case study in fused filament fabrication. Polym Test. 2022;117:107859. doi:10.1016/j.polymertesting.2022.107859
- American Society for Testing and Materials. ASTM D3039/D3039M-08 Standard test method for tensile properties of polymer matrix composite materials. Pennsylvania (PA): ASTM; 2014.
- Qi S, Gao X, Su Y, et al. Correlation between welding behavior and mechanical anisotropy of long chain polyamide 12 manufactured with fused filament fabrication. Polym. 2021;213:123318. doi:10.1016/j.polymer.2020.123318
- Li W, Li L, Cao Y, et al. Effects of PLA film incorporated with ZnO nanoparticle on the quality attributes of fresh-cut apple. Nanomater. 2017;7:207. doi:10.3390/nano7080207
- Hu Y, Hou X, Hu X, et al. Improvement in the mechanical and friction performance of poly(ether ether ketone) composites by addition of modificatory short carbon fibers and zinc oxide. High Perform Polym. 2017;30:643–656. doi:10.1177/0954008317723445
- Zabihi O, Khayyam H, Fox BL, et al. Enhanced thermal stability and lifetime of epoxy nanocomposites using covalently functionalized clay: experimental and modelling. New J Chem. 2015;39:2269–2278. doi:10.1039/C4NJ01768D
- Chandran AM, Varun S, Karumuthil SC, et al. Zinc oxide nanoparticles coated with (3-Aminopropyl)triethoxysilane as additives for boosting the dielectric,: ferroelectric, and piezoelectric properties of poly(vinylidene fluoride) films for energy harvesting. ACS Appl Nano Mater. 2021;4:1798–1809. doi:10.1021/acsanm.0c03214
- Noei H, Qiu H, Wang Y, et al. The identification of hydroxyl groups on ZnO nanoparticles by infrared spectroscopy. Phys Chem Chem Phys. 2008;10:7092–7709. doi:10.1039/B811029H
- Ahangaran F, Navarchian AH. Recent advances in chemical surface modification of metal oxide nanoparticles with silane coupling agents: a review. Adv Colloid Interface Sci. 2020;286:102298. doi:10.1016/j.cis.2020.102298
- Duong HP, Hung CH, Dao HC, et al. Modification of TiO2 nanotubes with 3-aminopropyl triethoxysilane and its performances in nanocomposite coatings. New J Chem. 2018;42:8745–8751. doi:10.1039/C8NJ00642C
- Pasternack RM, Amy SR, Chabal YJ. Attachment of 3-(Aminopropyl)triethoxysilane on Silicon oxide surfaces: dependence on solution temperature. Langmuir. 2008;24:12963–12971. doi:10.1021/la8024827
- Sándor M, Nistor CL, Szalontai G, et al. Aminopropyl-Silica hybrid particles as supports for humic acids immobilization. Materials (Basel). 2016;9:34. doi:10.3390/ma9010034
- Marras SI, Zuburtikudis I, Panayiotou C. Solution casting versus melt compounding: effect of fabrication route on the structure and thermal behavior of poly(l-lactic acid) clay nanocomposites. J Mater Sci. 2010;45:6474–6480. doi:10.1007/s10853-010-4735-6
- Ercan N, Durmus A, Kaşgöz A. Comparing of melt blending and solution mixing methods on the physical properties of thermoplastic polyurethane/organoclay nanocomposite films. J Thermoplast Compos Mater. 2015;30:950–970. doi:10.1177/0892705715614068
- Sharip NS, Ariffin H, Yasim-Anuar TA, et al. Melt- vs. Non-melt blending of complexly processable ultra-high molecular weight polyethylene/cellulose nanofiber bionanocomposite. Polym. 2021;13:404. doi:10.3390/polym13030404
- Ke K, Wang Y, Liu XQ, et al. A comparison of melt and solution mixing on the dispersion of carbon nanotubes in a poly(vinylidene fluoride) matrix. Compos B Eng. 2012;43:1425–1432. doi:10.1016/j.compositesb.2011.09.007
- Spinelli G, Lamberti P, Tucci V, et al. Morphological: rheological and electromagnetic properties of nanocarbon/poly(lactic) acid for 3D printing: solution blending vs. melt mixing. Materials (Basel). 2018;11:11. doi:10.3390/ma11112256
- Sanchez JY, Iojoiu C, Alloin F, et al. Fuel cells – proton-exchange membrane fuel cells | Membranes: non-fluorinated. In: J Garche, editor.. Encyclopedia of Electrochemical Power Sources. Amsterdam: Elsevier; 2009. p. 700–715.
- Velghe I, Buffel B, Vandeginste V, et al. Review on the degradation of Poly(lactic acid) during melt processing. Polym. 2023;15:2047. doi:10.3390/polym15092047
- Aldhafeeri T, Alotaibi M, Barry CF. Impact of melt processing conditions on the degradation of polylactic acid. Polym. 2022;14:2790. doi:10.3390/polym14142790
- Qu M, Tu H, Amarante M, et al. Zinc oxide nanoparticles catalyze rapid hydrolysis of poly(lactic acid) at low temperatures. J Appl Polym Sci. 2014;131; doi:10.1002/app.40287
- Puglisi R, Scamporrino AA, Dintcheva NT, et al. Photo- and water-degradation phenomena of ZnO bio-blend based on poly(lactic acid) and polyamide 11. Polym. 2023;15:1434. doi:10.3390/polym15061434
- Narimissa E, Gupta RK, Kao N, et al. The comparison between the effects of solvent casting and melt intercalation mixing processes on different characteristics of polylactide-nanographite platelets composites. Polym Eng Sci. 2015;55:1560–1570. doi:10.1002/pen.23996
- Rueda C, Vallejo I, Corea M, et al. Degradation study of poly(lactic-l (+)-co-glycolic acid) in chloroform. Rev Mex Ing Quim. 2015;14:813–827.
- Makadia HK, Siegel SJ. Poly Lactic-co-Glycolic Acid (PLGA) as biodegradable controlled drug delivery carrier. Polym. 2011;3:1377–1397. doi:10.3390/polym3031377
- Niaounakis M. Properties. In: Niaounakis M, editor. Biopolymers: processing and products. Oxford: William Andrew Publishing; 2015. p. 79–116.
- Jasso-Gastinel CF, Soltero-Martínez JFA, Mendizábal E. Modifiable characteristics and applications. In: Jasso-Gastinel CF, Kenny JM, editors. Modification of polymer properties. Boston, MA: Elsevier; 2017. p. 1–21.
- Becker H, Locascio LE. Polymer microfluidic devices. Talanta. 2002;56:267–287. doi:10.1016/S0039-9140(01)00594-X
- Texas Instruments. Interpreting Unexpected Events and Transitions in DSC Results. TA Instrument [cited 2023 Aug 30]. Available from: https://www.tainstruments.com/pdf/literature/TA039.pdf.
- Zhang J, Tashiro K, Tsuji H, et al. Disorder-to-order phase transition and multiple melting behavior of poly(l-lactide) investigated by simultaneous measurements of WAXD and DSC. Macromol. 2008;41:1352–1357. doi:10.1021/ma0706071
- Clarkson CM, El Awad Azrak SM, Schueneman GT, et al. Crystallization kinetics and morphology of small concentrations of cellulose nanofibrils (CNFs) and cellulose nanocrystals (CNCs) melt-compounded into poly(lactic acid) (PLA) with plasticizer. Polym. 2020;187:122101. doi:10.1016/j.polymer.2019.122101
- Lizundia E, Penayo MC, Guinault A, et al. Impact of ZnO nanoparticle morphology on relaxation and transport properties of PLA nanocomposites. Polym Test. 2019;75:175–184. doi:10.1016/j.polymertesting.2019.02.009
- Brady J, Dürig T, Lee PI, et al. Developing Solid Oral Dosage Forms. 2nd ed. Boston: Academic Press; 2017. p. 181–223.
- Fukushima K, Tabuani D, Dottori M, et al. Effect of temperature and nanoparticle type on hydrolytic degradation of poly(lactic acid) nanocomposites. Polym Degrad Stab. 2011;96:2120–2129. doi:10.1016/j.polymdegradstab.2011.09.018
- Bussiere PO, Therias S, Gardette JL, et al. Effect of ZnO nanofillers treated with triethoxy caprylylsilane on the isothermal and non-isothermal crystallization of poly(lactic acid). Phys Chem Chem Phys. 2012;14:12301–12308. doi:10.1039/C2CP41574G
- Sahraeian R, Davachi SM, Heidari BS. The effect of nanoperlite and its silane treatment on thermal properties and degradation of polypropylene/nanoperlite nanocomposite films. Compos B: Eng. 2019;162:103–111. doi:10.1016/j.compositesb.2018.10.093
- Gao B, Jiang Z, Zhao C, et al. Enhanced pervaporative performance of hybrid membranes containing Fe3O4@CNT nanofillers. J Membr Sci. 2015;492:230–241. doi:10.1016/j.memsci.2015.05.035
- Carvalh JL, Cormier SL, Lin N, et al. Crystal growth rate in a blend of long and short polymer chains. Macromol. 2012;45:1688–1691. doi:10.1021/ma202429q
- Northcutt LA, Orski SV, Migler KB, et al. Effect of processing conditions on crystallization kinetics during materials extrusion additive manufacturing. Polym. 2018;154:182–187. doi:10.1016/j.polymer.2018.09.018
- Nonato RC, Mei LHI, Bonse BC, et al. Nanocomposites of PLA containing ZnO nanofibers made by solvent cast 3D printing: production and characterization. Eur Polym J. 2019;114:271–278. doi:10.1016/j.eurpolymj.2019.02.026
- Keshavarzi S, Babaei A, Goudarzi A, et al. ZnO nanoparticles as chain elasticity reducer and structural elasticity enhancer: correlating the degradating role and localization of ZnO with the morphological and mechanical properties of PLA/PP/ZnO nanocomposite. Polym Adv Technol. 2019;30:1083–1095. doi:10.1002/pat.4542
- Rodríguez-Tobías H, Morales G, Grande D. Improvement of mechanical properties and antibacterial activity of electrospun poly(d,l-lactide)-based mats by incorporation of ZnO-graft-poly(d,l-lactide) nanoparticles. Mater Chem Phys. 2016;182:324–331. doi:10.1016/j.matchemphys.2016.07.039
- Tan MA, Yeoh CK, The PL, et al. Effect of zinc oxide suspension on the overall filler content of the PLA/ZnO composites and cPLA/ZnO composites. E-Polym. 2023;23:231–236. doi:10.1515/epoly-2022-8113
- Mat Yazik MH, Sultan MTH, Jawaid M, et al. Effect of nanofiller content on dynamic mechanical and thermal properties of multi-walled carbon nanotube and montmorillonite nanoclay filler hybrid shape memory epoxy composites. Polym. 2021;13:700. doi:10.3390/polym13050700
- Pantani R, Gorrasi G, Vigliotta G, et al. PLA-ZnO nanocomposite films: water vapor barrier properties and specific end-use characteristics. Eur Polym J. 2103;49:3471–3482. doi:10.1016/j.eurpolymj.2013.08.005
- Chu Z, Zhao T, Li L, et al. Characterization of antimicrobial poly (lactic acid)/nano-composite films with Silver and Zinc oxide nanoparticles. Materials (Basel). 2017;10:659. doi:10.3390/ma10060659
- Silverajah VSG, Ibrahim NA, Yunus WMZW, et al. A comparative study on the mechanical,: thermal and morphological characterization of poly(lactic acid)/epoxidized palm oil blend. Int J Mol Sci. 2012;13:5878–5898. doi:10.3390/ijms13055878
- Zeljković S, Balaban M, Gajić D, et al. Mechanochemically induced synthesis of N-ion doped ZnO: solar photocatalytic degradation of methylene blue. Green Chem Lett Rev. 2022;15:869–880. doi:10.1080/17518253.2022.2108343
- Aragaw SG, Sabir FK, Andoshe DM, et al. Green synthesis of p-CO3O4/n-ZnO composite catalyst with Eichhornia Crassipes plant extract mediated for methylene blue degradation under visible light irradiation. Mater Res Express. 2020;7:095508. doi: 10.1088/2053-1591/abb90e
- Tarani E, Arvanitidis I, Christofilos D, et al. Calculation of the degree of crystallinity of HDPE/GNPs nanocomposites by using various experimental techniques: a comparative study. J Mater Sci. 2023;58:1621–1639. doi:10.1007/s10853-022-08125-4
- Kong Y, Hay JN. The measurement of the crystallinity of polymers by DSC. Polym. 2002;43:3873–3878. doi:10.1016/S0032-3861(02)00235-5
- Raval N, Maheshwari R, Kalyane D, et al. Copolymers and block copolymers in drug delivery and therapy. In: Tekade RK, editor. Basic fundamentals of drug delivery. London, England: Academic Press; 2019. p. 369–400.
- Doumeng M, Makhlouf L, Berthet F, et al. A comparative study of the crystallinity of polyetheretherketone by using density: DSC, XRD, and Raman spectroscopy techniques. Polym Test. 2021;93:106878. doi:10.1016/j.polymertesting.2020.106878
- Arrigo R, Frache A. FDM printability of PLA based-materials: the key role of the rheological behavior. Polym. 2022;14:1754. doi:10.3390/polym14091754
- Abdulridha SA. High sensitivity photoconductive for ZnO:MgO nanoparticles. Energy Procedia. 2019;157:355–361. doi:10.1016/j.egypro.2018.11.200
- Kimbell G, Azad MA. 3D printing: Bioinspired materials for drug delivery. In: Nurunnabi Md, editor. Bioinspired and biomimetic materials for drug delivery. San Diego, CA: Elsevier Science and Technology; 2021. p. 295–318.
- Pigeonneau F, Xu D, Vincent M, et al. Heating and flow computations of an amorphous polymer in the liquefier of a material extrusion 3D printer. Addit Manuf. 2020;32:101001. doi:10.1016/j.addma.2019.101001
- Dealy JM, Wissbrun KF. Linear viscoelasticity. In: Dealy JM, Wissbrun KF, editors. Melt rheology and its role in plastics processing. New York: Springer; 2013. p. 42–102.
- Crow Polymer Database. Flow properties of polymers. Crow polymer database [cited 2023 Aug 30]. Available from: https://polymerdatabase.com/polymer%20physics/Viscosity2.html.
- Osman MA, Atallah A. Interparticle and particle–matrix interactions in polyethylene reinforcement and viscoelasticity. Polym. 2005;46:9476–9488. doi:10.1016/j.polymer.2005.07.030
- Roland CM. Reinforcement of elastomers. In: Hashmi S, editor. Reference module in materials science and materials engineering. Amsterdam, Netherlands: Elsevier; 2016. p. 1–9.
- Donnet JB. Black and white fillers and tire compound. Rubber Chem Technol. 1998;71:323–341. https://api.semanticscholar.org/CorpusID:137523645
- Saha S, Bhowmick AK. Effect of structure development on the rheological properties of PVDF/HNBR-based thermoplastic elastomer and its vulcanizates. J Appl Polym Sci. 2020;137:48758. doi:10.1002/app.48758
- Taghavimehr M, Navid Famili MH, Shirsavar MA. Effect of nanoparticle network formation on electromagnetic properties and cell morphology of microcellular polymer nanocomposite foams. Polym Test. 2020;86:106469. doi:10.1016/j.polymertesting.2020.106469
- Lee KP, Brandt M, Shanks R, et al. Rheology and 3D printability of percolated graphene–polyamide-6 composites. Polym. 2020;12:2014. doi:10.3390/polym12092014
- Carreau PJ, Vergnes B. Rheological characterization of fiber suspensions and nanocomposites. In: Chinesta F, Ausias G, editors. Rheology of non-spherical particle suspensions. London, England: Elsevier Science; 2015. p. 19–58.
- Sun L, Boo WJ, Liu J, et al. Effect of nanoplatelets on the rheological behavior of epoxy monomers. Macromol Mater Eng. 2009;294:103–113. doi:10.1002/mame.200800258
- Mahi H, Wilhelm M, Rodrigue D. A rheological criterion to determine the percolation threshold in polymer nano-composites. Rheol. 2014;53:869–882. doi:10.1007/s00397-014-0804-0
- Palacios-Aguilar E, Bonilla-Rios J, Sanchez-Fernandez V-MA, et al. Comparing the elasticity of the melt and electrical conductivity of the solid of PP-HDPE copolymer CNT composites obtained by direct compounding versus dilution of a PP masterbatch. J Intell Mater Syst Struct. 2021;32:1105–1115. doi:10.1177/1045389×20969836
- Mun SC, Kim M, Prakashan K, et al. A new approach to determine rheological percolation of carbon nanotubes in microstructured polymer matrices. Carbon N Y. 2014;67:64–67. doi:10.1016/j.carbon.2013.09.056
- Pang M, Zuo Q, Cao B, et al. Understanding the role of a silane-coupling agent in bio-based polyurethane nanocomposite-coated fertilizers. ACS Omega. 2021;6:32663–32670. doi:10.1021/acsomega.1c04348
- Zhu Z, Thompson T, Wang SQ, et al. Investigating linear and nonlinear viscoelastic behavior using model silica-particle-filled polybutadiene. Macromol. 2005;38:8816–8824. doi:10.1021/ma050922s
- Morris BA. Commonly used resins and substrates in flexible packaging. In: Morris BA, editor. The science and technology of flexible packaging. Oxford: William Andrew Publishing; 2017. p. 69–119.
- Liao Y, Liu C, Coppola B, et al. Effect of porosity and crystallinity on 3d printed PLA properties. Polym. 2019;11:1487. doi:10.3390/polym11091487
- Wang X, Zhao L, Fuh JY, et al. Effect of porosity on mechanical properties of 3d printed polymers: experiments and micromechanical modeling based on X-ray computed tomography analysis. Polym. 2019;11:1154. doi:10.3390/polym11071154
- Astakhov VP. Mechanical properties of engineering materials: relevance in design and manufacturing. In: Davim JP, editor. Introduction to mechanical engineering. 1st ed. Cham: Springer; 2018. p. 3–41
- Cree D, Soleimani M. Bio-based white eggshell as a value-added filler in poly(lactic acid) composites. J Compos Sci. 2023;7:278. doi:10.3390/jcs7070278
- Murariu M, Paint Y, Murariu O, et al. Current progress in the production of PLA–ZnO nanocomposites: beneficial effects of chain extender addition on key properties. J Appl Polym Sci. 2015;132; doi:10.1002/app.42480
- Chen ZY, Shao WZ, Li WJ, et al. Suppressing the agglomeration of ZnO nanoparticles in air by doping with lower electronegativity metallic ions: implications for Ag/ZnO electrical contact composites. ACS Appl Nano Mater. 2022;5:10809–10817. doi:10.1021/acsanm.2c02129
- Nunes RW, Martin JR, Johnson JF. Influence of molecular weight and molecular weight distribution on mechanical properties of polymers. Polym Eng Sci. 1982;22:205–228. doi:10.1002/pen.760220402
- Deshoulles Q, Le Gall M, Dreanno C, et al. Origin of embrittlement in Polyamide 6 induced by chemical degradations: mechanisms and governing factors. Polym Degrad Stab. 2021;191:109657. doi:10.1016/j.polymdegradstab.2021.109657
- Levenhagen NP, Dadmun MD. Bimodal molecular weight samples improve the isotropy of 3D printed polymeric samples. Polym. 2017;122:232–241. doi:10.1016/j.polymer.2017.06.057