
 ?Mathematical formulae have been encoded as MathML and are displayed in this HTML version using MathJax in order to improve their display. Uncheck the box to turn MathJax off. This feature requires Javascript. Click on a formula to zoom.
ABSTRACT
In feedback control systems of wire-arc additive manufacturing (WAAM), timely adjustments before the occurrence of deviations (feedforward control) would reduce excessive requirements on the sensitivity and accuracy of characteristic parameters of control systems. However, the search for characteristic parameters suitable for feedforward control is extremely rare in the WAAM field. Herein, based on ‘mass-spring' theory, a model of droplet oscillation momentum (DOM) is developed to describe the dynamic behavior of a pendant droplet and its influencing mechanism on surface roughness. The model combines the contribution of wire movement to droplet displacement with experimental correction of the spring/damping coefficients. The results show that the predictions of the model are in good agreement with the experimental values, and DOM is quadratically correlated with the surface roughness. Therefore, the model can be expected as a characteristic parameter to elucidate the development of surface-forming quality of WAAM-fabricated components.
1. Introduction
Wire-arc additive manufacturing (WAAM) is a prospective technique for the fabrication of large-scale metallic components owing to its low production cost and high deposition rate [Citation1–3]. However, WAAM is susceptible to slight variations in process parameters, including the arc current, arc voltage, and travel speed. The consequent disturbances in the inter-layer temperature and previous forming geometry result in poor controllability of the component geometry and high surface roughness, severely limiting the application of WAAM [Citation4,Citation5]. On the other hand, surface roughness plays a key role in the geometric characteristics of the component in terms of not only the stabilisation of the WAAM process but also the mechanical performance of WAAM-fabricated components [Citation6,Citation7]. The fabrication of WAAM components with excellent surface-forming quality requires extracting characteristic parameters reflecting the physical nature of the WAAM process for real-time control [Citation8,Citation9].
In practice, various types of characteristic parameters, such as spectrum and acoustics are monitored for quality management and control. The spectrum often contains information related to shielding gas and metal vapours, intrinsically linked to the defects of WAAM-fabricated components. For instance, Hauser et al. [Citation10] utilised light emission spectroscopy to detect the spectral-wavelength intensity and noticed a relationship between the changes in intensity and the exothermic reaction of the substance during oxidation. Huang et al. [Citation11] established a portable spectrometer system capable of real-time collection and processing of characteristic spectral lines for diagnosis and detection of porosity defects. For acoustics, several studies showed an association between acoustic emission and information related to cracks and porosity defects. For instance, Pal, Bhattacharya, and Pal [Citation12] fabricated a sound sensor to analyse the arc sound and determine the metal transfer modes. Bhattacharya, Pal and Pal [Citation13] found that sound signal kurtosis can be used as an indicator of weld spatter, and noticed an increase in the kurtosis value as a function of spatter loss. Surovi and Soh [Citation14] proposed a method to identify geometric defects by recognising acoustic signals during the WAAM process. The control system based on spectral and acoustic characteristic parameters has the advantages of simple equipment and low cost, but it can only be used as an auxiliary means of online monitoring/detection because of the disadvantages of less information obtained and only qualitative analysis.
The visual characteristic parameters have widely been used as monitoring targets to enhance surface-forming quality owing to their advantages, such as intuitive information, excellent anti-interference, and rich information. Given this, Xiong et al. [Citation15] developed a passive visual sensor system for obtaining bead geometry and realisation of online control of the width of the deposited beads through tuning process parameters. Subsequently, they employed the system to monitor and control the distance between the nozzle tip and the workpiece [Citation16]. Zhan et al. [Citation17] used a camera to monitor the deviations in the wire-feeding position by developing software to extract the wire edges and measure the wire deflection. Diao et al. [Citation18] developed a passive imaging system to monitor the dimension of the molten pool, and Bonaccorso, Cantelli, and Muscato [Citation19] presented an image process-based approach to calculate the arc length and molten pool dimensions. Yang, Wang, and Zhang [Citation20] employed an infrared camera to measure the surface temperature of the thin-wall components and achieved a reliable deposition surface. Tang et al. [Citation21] attempted to detect surface layer defects, such as depressions, porosity, and humps. As a result, many visual objects can be used as characteristic parameters for surface defect monitoring and geometric deviation measurement, which can help promote the development of WAAM surface-forming quality monitoring technology.
The next step after obtaining the characteristic parameters is real-time control of WAAM. Currently utilised feedback control with the characteristic parameters as input signals is mainly used to stabilise the deposition process, compensate for errors, and reduce defects [Citation6]. Alternatively, advanced control strategies, such as internal model control [Citation22], neural self-learning control [Citation4], and adaptive control [Citation16] have been used to realise closed-loop control. Feedback control is essentially an ex-post factor control, meaning already occurred targeted calibration and correction based on a deviation. In this process, the corresponding control system tends to rely excessively on real-time environmental information [Citation6], so that only monitoring systems with high sensitivity and high precision for process monitoring can achieve highly reliable and high-quality control of WAAM processes.
The excessive demand on the monitoring system can be effectively overcome by adjusting the interference before the occurrence of deviation, meaning the control system is combined with feed-forward control. However, to the best of our knowledge, research on characteristic parameters suitable for feedforward control is rarely reported in the WAAM field. In recent years, droplet transfer has been widely used in process control as a visual monitoring object [Citation23,Citation24]. In droplet formation and growth, the pendant droplet at the tip of the wire may result in oscillation by forces, such as Lorentz force and surface tension [Citation25]. For instance, Ersoy, Kannatey-Asibu, and Hu [Citation26] confirmed the influence of oscillation on droplet transfer behaviour. Wu, Chen, and Li [Citation27] found that the droplet oscillation period depends on current waveform parameters, and the droplet detachment can be enhanced by the intentional excitation of droplet oscillation. Xiao et al. [Citation28] suggested the enhancement of droplet detachment at low currents by active droplet oscillation. Accordingly, some unexpected benefits may occur. The first consists of improved controllability of metal transfer by the utilisation of droplet oscillation. The second has to do with oscillating droplets in the droplet formation stage, not yet affected the molten pool, and found suitable for eliminating the interference of the characteristic parameters in the budding stage. However, the suitable information about the oscillating droplet that can be regarded as a characteristic parameter is still unclear.
Herein, the characteristic parameter characterising the surface-forming quality of the WAAM-fabricated component was explored by studying the droplet oscillation momentum (DOM) and its mathematical model. The proposed model was verified by the multi-layer deposition experiments, and the influencing mechanism of current on the surface roughness of the WAAM-fabricated component was investigated. This study aimed to guide the implementation of a feedforward control strategy to provide a novel control idea for the fabrication of high-performance components.
2. Droplet oscillation momentum
2.1. Conceptual development
The welding system containing a droplet and a molten pool, as well as the droplet transfer process is presented in . In this system, a wire was introduced into the welding arc. Under the interaction of forces like gravity, Lorentz, and plasma drag force, the molten metal at the tip of the wire would form a droplet and impact the molten pool (a) [Citation29,Citation30]. During droplet transfer ((b–d)), three phases of droplet behaviour (oscillation, detachment, and impact) on the molten pool were included. During the droplet oscillation phase and under the resultant force F0, the pendant droplet at the tip of the wire resulted in oscillation. In this case, the droplet changed cyclically among the three states of contraction, balance, and elongation ((b)). The droplet's mass mOS increased linearly with time, while velocity varied periodically. Thus, the corresponding droplet oscillatory momentum (DOM) can be expressed by Equation (1). As the mass of the oscillating droplet increased from
to m1, the resultant force F0 on the droplet exceeded its maximum surface tension, thereby detaching away from the end of the wire ((c)). At this moment, the corresponding momentum can be expressed by the formula:
, where
is the instantaneous velocity of the oscillating droplet at the moment of detachment. Subsequently, the droplet crossed the arc space to come into contact with the surface of the molten pool and enter the pool with momentum p2 ((d)).
(1)
(1) where
and
represent the mass and oscillation velocity of the pendant droplet, respectively.
Figure 1. Conceptual framework of droplet oscillation momentum (DOM). (a) General view, (b) droplet oscillating, (c) moment of droplet detachment, and (d) moment of droplet contact with the molten pool.
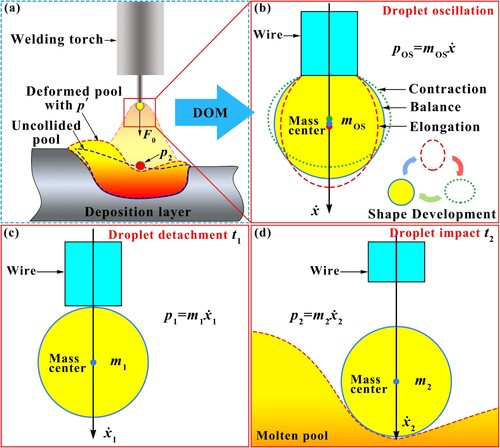
The droplet can be used to determine the geometry of the molten pool since momentum and energy transferred to the molten pool by the droplets would deform the molten pool [Citation31]. Before the collision of the detached droplet with the molten pool, the latter would be in a dynamic equilibrium under arc pressure [Citation32]. After the collision, the detached droplet would become completely integrated into the molten metal in the molten pool, with momentum carrying the deformation of the molten pool. By assuming no change in arc pressure during the collision between the detached droplet and the molten pool, the collision between both would satisfy the conservation of momentum. In this case, the detached droplet momentum p2 would be equal to the deformation momentum p’ of the molten pool. Therefore, the reduction of detached droplet momentum p2 can decrease the geometric deformation of the molten pool, maintain the stability of the molten pool geometry [Citation33], and improve the surface-forming quality of WAAM-fabricated components.
Relevant literature has shown that droplet oscillation directly affects droplet transfer behaviour [Citation24,Citation25,Citation28,Citation34,Citation35]. Therefore, more focus was paid to the oscillatory growth phase before the droplet detachment from the tip of the wire, not yet affecting the molten pool. This can provide characteristic parameters for feedforward control. The data suggested detached droplets lost negligible mass due to high-temperature evaporation as they passed through the high-temperature arc space [Citation36,Citation37]. Therefore, the mass of the oscillating droplet at the moment of detachment m1 was equal to the mass of the droplet at the moment of impact with the molten pool m2. Furthermore, the droplet moved toward the molten pool with an essentially constant acceleration a [Citation36]. Thus, , where t = t2-t1, denotes the time interval between the droplet detachment moment and the droplet impacting the molten pool moment,
is the velocity of the droplet at the moment of impact on the molten pool. Accordingly, a clear linear relationship existed between p2 and p1, and DOM (calculated with Equation 1) would determine the detached droplet momentum p2. Based on this, it can be deduced that DOM would determine the geometric deformation of the molten pool, and the reduction of DOM can provide a way to improve the surface-forming quality of WAAM-fabricated components.
2.2. Model formulation
To simplify calculations, several assumptions were made.
The pendant droplet is connected to the end of the wire by a virtual spring and damping, with the whole system considered a ‘mass-spring’ system with symmetry around the wire.
The wire has a constant melting rate, with the pendant droplet mass increasing linearly with time.
The small displacement of the pendant droplet in the direction perpendicular to the wire is neglected.
The current density on the surface of a pendant droplet is constant.
The pendant droplet has a spherical shape and the metal transfer mode is a spherical droplet transition.
The oscillation not occurring until the droplet reached 1.2-fold the diameter of the wire.
For constant wire feeding speed and by considering the continuous growth of the droplet, the pendant droplet oscillation would follow a time-varying second-order differential equation [Citation38], which can be expressed as follows:
(2)
(2)
(3)
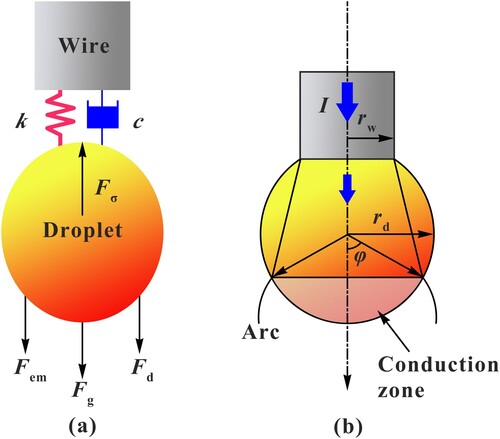
(3) where x represents the displacement of a pendant droplet's centre of mass, c is the damping coefficient, and k refers to the spring constant; and Fg, Fem, and Fd are the gravitational force, Lorentz force, and plasma drag force, respectively.
For constant current and wire extension under a stable arc environment, the mass of the pendant droplet would increase linearly with time [Citation25].
(4)
(4) where ρs denotes the density of solid wire, Ae is the cross-section area of the wire, and vm represents the wire melting speed.
The vm is expressed as a function of current and wire extension [Citation39].
(5)
(5) where α is the arc resistance coefficient, β refers to the wire resistance coefficient, le is the wire extension, and I denote the current.
The gravitational force of the pendant droplet can be calculated by Equation (6) [Citation37].
(6)
(6) where rd refers to the droplet radius, g is the gravitational acceleration, and
denotes the density of the pendant droplet.
Assuming a uniform current density on the droplet surface ((b)), the equation for the Lorentz force on the pendant droplet can be formulated by integrating the Maxwell stress on the droplet surface [Citation36].
(7)
(7) where μ0 is the magnetic permeability in space, rw is the radius of the wire, φ represents the arc half-cone angle, and represents the droplet form coefficient
as given by Equation (8):
(8)
(8) The Lorentz force on the pendant droplet would be related to its shape coefficient
, revealing the interfering aspect of the tip profile with the value of the Lorentz force [Citation37]. Note that the magnitude of the Lorentz force would depend on the square of the current and the shape factor
of the pendant droplet, without significant changes in arc half-angle above 60° [Citation37].
Figure 2. Schematic diagram of (a) forces on the pendant droplet and (b) the current path in the droplet.
A protective gas flow around a spherical droplet would generate the plasma drag force, similar to the force acting on a spherical particle immersed in a liquid stream [Citation37], given by Equation (9):
(9)
(9) where ρp is the plasma density, Cd is the dimensionless drag coefficient, and vp is the speed of the arc plasma around the droplet.
The role of surface tension was to hold the metal droplet on the wire. The magnitude of surface tension would be proportional to the radius of the droplet during the growth of a metal droplet at the tip of the wire [Citation37], which can be expressed by Equation (10):
(10)
(10) where γ is the surface tension coefficient.
When the theoretical maximum value of the holding force exceeds what the surface tension can give, the criteria for droplet detachment should be based on the retention force required to keep the droplet from detaching [Citation38].
(11)
(11) The surface tension of the droplet provided the spring force for the model presented in (a), and the spring coefficient k can be calculated by solving Equation (12) [Citation37].
(12)
(12) where U represents the surface potential energy, and Fs refers to the spring force.
The damping coefficient can be calculated as follows [Citation38]:
(13)
(13) where μ is the viscosity coefficient and V denotes the droplet volume.
However, The calibration of the spring and damping coefficients was considered because of the significant calculation errors using the Equation (12) and Equation (13), and the difficulty of accurately describing the changes in droplet shape and other parameters during the droplet oscillation process [Citation36]. A high-speed camera was used to record the whole oscillation of the droplet, and the displacement of the droplet centre of mass and droplet size were measured from the high-speed image sequence. When the pendant droplet is in free oscillation, its oscillation time is only a dozen milliseconds. Thus, the growth of the droplet throughout the oscillation cycle can be neglected, and the droplet mass and its accompanying spring and damping coefficients can be treated as constants [Citation24].
By defining,
,
, as well as solving Equation (2), the following analytical solution can be obtained:
(14)
(14) where A and
depend on the initial displacement and velocity of the droplet.
The oscillation cycle can be expressed by Equation (14):
(15)
(15) where T denotes one complete oscillation period of the pendant droplet.
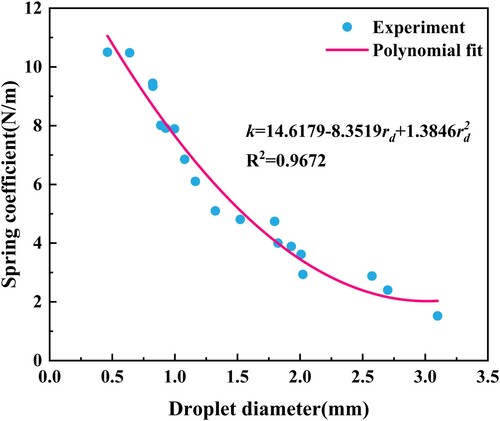
Because in Equation (15), the spring coefficient can be simplified according to Equation (16):
(16)
(16) Using Equation (16), a mathematical model of the spring coefficient was fitted by measuring and calculating a series of images of the pendant droplet ().
Figure 3. Experimental results of spring coefficients.
In the DOM model, the spring coefficients can be calculated by solving Equation (17):
(17)
(17) The damping coefficient can be simplified by Equation (18) [Citation24].
(18)
(18) where A1 and Aj + 1 denote the two amplitudes of the droplet system vibration at j periods apart.
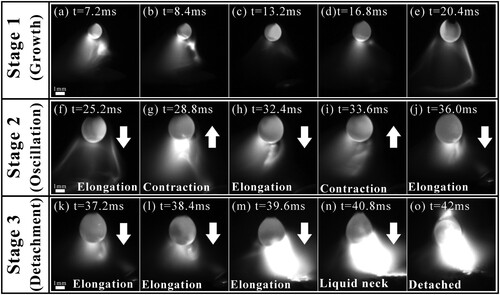
To calibrate the damping coefficients, high-speed cameras were used to analyse the three stages of droplet growth, oscillation and detachment (). During the growth stage, the damping coefficient was set to zero, meaning the droplet grew to 1.2-fold the wire diameter due to the very small droplet mass corresponding to this stage in the order of 10−7 kg, resulting in only small oscillations. In the oscillation stage, the damping coefficient was set to 0.0032 in the experimental calibration. In other words, based on the high-speed camera and the calculation method of Equation (18), the damping coefficient can be calculated by measuring the two adjacent amplitudes of the droplet displacement. During the detachment stage, the droplet was stretched downward by the combined force, no upward displacement was produced, and the damping coefficient decayed rapidly. Thus, the damping coefficient in this stage was also set to zero.
Figure 4. The three stages of droplet growth, oscillation and detachment.
2.3. Additional displacement of droplet
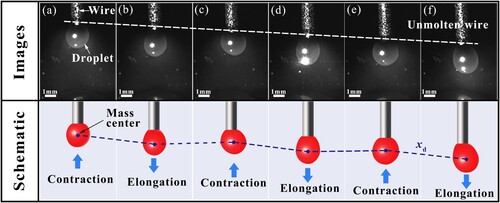
As the arc started to work, the wire formed a droplet at high temperatures, which then moved vertically toward the molten pool. An interesting phenomenon related to the speed of wire feeding, which was always slightly faster than that of wire melting was noticed, and aimed to ensure a smooth deposition process. In , the length of the unmolten wire above the white dotted line increased linearly as a function of droplet displacement, represented by the dotted blue line. This contributed significantly to the droplet displacement value. According to Equation (1), ignoring the extra displacement of droplets would result in small droplet displacement and velocity, which in turn would increase the error of DOM calculation values. Therefore, correcting this blind spot in the calculation of droplet displacement and velocity was important to accurately calculate the DOM.
Figure 5. Phenomenon related to the additional displacement of the droplet. Six frames of droplet images and schematic diagrams were taken by the high-speed camera. The white dotted line indicates the junction line between the droplet and the wire. The dark blue dotted line connects the center of mass of the droplet, representing the displacement xd of the droplet. In addition to oscillatory displacement, the droplet is pushed an additional distance by the extra unmolten wire.
The calibrated droplet displacement and velocity
can be calculated by the following Equation (19):
(19)
(19) where Δl is the additional displacement of the droplet.
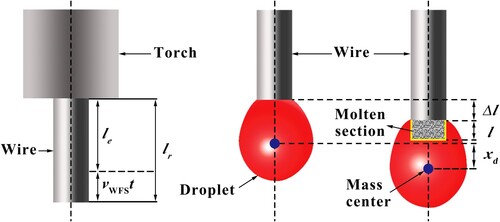
As shown in , the unmolten wire pushed the droplet downward, causing an additional displacement. The contribution of the unmolten wire to the droplet displacement can be expressed by Δl, representing the difference between the total wire elongation lr and the wire melting length l. This can be given as follows:
(20)
(20) Here, the wire extension le, the current I, and its corresponding wire feed speed
were all known quantities. Therefore, the total length lr of wire extension can be expressed by Equation (21):
(21)
(21)
Figure 6. Contribution of wire displacement to droplet displacement. The droplet at two different moments, in this case, the displacement of the mass center of the droplet is xd, the contribution of the unmolten wire to the droplet displacement is Δl, the total length of wire extension is lr, the molten wire length is l the wire extension is le, and the wire feed length is .
Assuming a content melting rate of the wire, Equations (4) and (5) would suggest a link between the length l of the wire melting and droplet mass, as follows:
(22)
(22) The mathematical analytical model of the DOM was established by combining the above analysis and the derivation of Equations (1) to (22).
3. Experimental setup and analysis methods
3.1. Experimental setup
The experimental setup consisting of a deposition and vision system is shown in . The deposition system consisted of a gas metal arc welding (GMAW) power source (MIG 350 II Bin Go) and a welding torch clamped by a six-axis industrial robot (ABB). It is worth noting that GMAW, as a traditional welding process, is one of the technical foundations of WAAM [Citation40]. The GMAW power supply has an operating voltage of 380 V, an open circuit voltage (OCV) of 70 V, and a current regulation range of 20A-350A. The current and voltage are adjusted in a unified way, and the relationship between wire feeding speed and current is shown in . In addition, the deposition experiments were conducted using the DCEP method as described in (the torch is connected to the positive polarity and the substrate is connected to the negative polarity). To obtain a clear image of the droplet, in addition to a Basler high-speed camera (acA640-750um), the vision system included an infrared filter of 650 nm band, a filter with a transmittance of 5%, and a clear protective lens filtering out the intense arc light during deposition. ER 50–6 mild steel wire with 1.0 mm diameter and Q235B mild steel plate with 5 mm thickness were used in this study. The substrate surface with dimensions of 200 mm × 200 mm × 5 mm was first polished to remove the oxide layer and then cleaned with ethanol. lists the chemical compositions of the substrate and wire.
Figure 7. Schematic diagram of deposition and vision system.
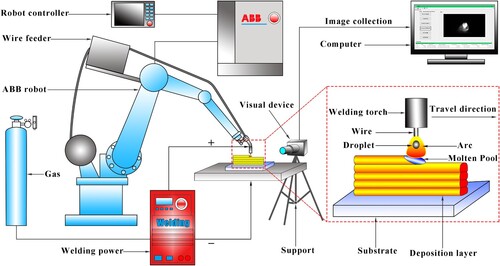
Figure 8. Relationship between wire feed speed and current.
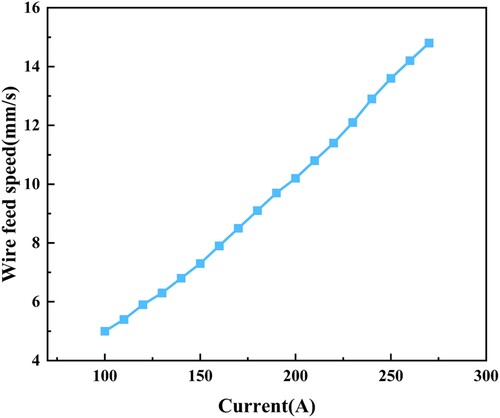
Table 1. Chemical compositions of ER 50–6 wire and Q235B substrate.
During the multilayer deposition process, droplet transfer occurs only when the wire is in contact with the molten pool in the short-circuit transfer mode. The molten pool is deformed by the downward pressure of the wire and the impulse generated by the explosion of the liquid neck. In the spray transfer mode, the droplets passes through the arc in a stream at a higher velocity with minimal oscillation. In the globular transfer mode, the droplet transfers along the wire axis through the arc space and oscillates before impacting the molten pool. This mode is ideal for analysing droplet oscillations in the transition mode, because it avoids the interference of wire pressure, liquid neck explosion impulse and liquid streaming beams mentioned above, allowing us to focus on analysing the impact of the DOM of on the molten pool deformation. In GWAM, currents less than 200 A correspond to globular transfers [Citation41]. Therefore, the effect of current on DOM was examined by setting it to 120A, 140A, 160A and 180A. Here, the deposition length was fixed to 120 mm, and a total of 20 layers were deposited in a staggered manner, with an interlayer dwell time of 120s. The other main parameters consisted of travelling speed of 5 mm/s, gas flow rate of 15 L/min, wire extension of 12 mm, and contact tip-work distance (CTWD) of 12 mm. It is worth noting that to eliminate the effect of variations in the distance between the torch nozzle and the top of the preformed component on the droplet formation and transfer process, the torch is raised a predetermined layer height after the completion of each layer to ensure that the CTWD is maintained at approximately 12 mm.
3.2. Calculation of DOM experimental values
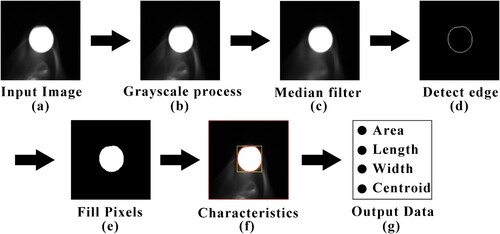
The flow of the high-speed camera images during droplet transfer used to calculate the DOM is provided in . The very small droplet displacement during a few milliseconds of the transfer process allowed selecting a fixed area of 190 × 186 pixels for uniform cropping of the original image sequence to facilitate simplification and speed up the subsequent calculation. In Step 1, the images were inputted ((a)). In Step 2, the RGB mode image was converted to a grayscale image ((b)). In Step 3, the images were denoised using the median filtering algorithm, with the filtering area settled to 10 × 10 units ((c)). In Step 4, the Laplacian of Gaussian (LOG) algorithm was applied to detect the edges of the droplets ((d)). In Step 5, the edge selected area was filled to get the image ((e)). In Step 6, the key data of the droplet, such as area, long axis, short axis, and mass centre were calculated by the self-developed function ((f)). In Step 7, output data were collected ((g)). Subsequently, the volume of the droplet was obtained by the micro-element method, meaning volume obtained by rotating the two-dimensional image by 360° along the central axis regarded as the droplet volume [Citation42]. The following droplet mass was obtained by multiplying the droplet density by the droplet volume. The velocity of the droplet is derived from the displacement of the centre of mass in the vertical direction divided by the time corresponding to the number of image frames. In the process of calculating the DOM, the time interval between droplet images was set to 1 ms [Citation28], and DOM profile of each complete droplet oscillation cycle were obtained by measuring at least 40 images. In addition, three consecutive and complete droplet oscillation cycles were selected for each set of data and averaged over DOMs.
Figure 9. High-speed image processing flow for obtaining DOM.
3.3. Measurement of surface roughness
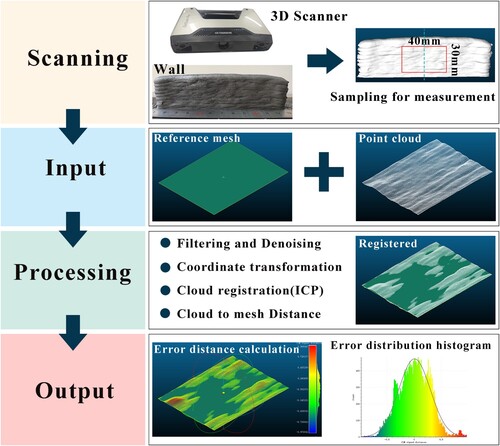
As illustrated in , a handheld 3D scanner was used to scan the surface profile of the WAAM-fabricated components. The scanner was equipped with a high-definition camera assisted by dual lasers to facilitate laser-accurate measurements in 3D space with captured models up to 210 mm × 150 mm and a scanning resolution of 0.1 mm. To improve the scanning accuracy, the size of the original point cloud sample was set to (1.2–1.7) × 105 points. To simplify subsequent calculations, a rectangular area with the size of 30 mm ×40 mm was intercepted as the region of interest (ROI). A grid with the same size as the ROI was created as the reference surface, which was imported into CouldcopareTM software with the point cloud set at the same time used for filtering and coordinate conversion. Herein, it is considered that the Iterative Closest Point (ICP) algorithm does not need to segment the extracted point cloud features at the time of alignment, and the continuous iterative operation is able to approach the ideal accuracy value indefinitely[Citation43,Citation44]. Therefore, the scanned clouds were finely aligned using the ICP algorithm, with a target root mean square difference of 1 × 10⁻⁵ units and a final overlap of 100%. To finely align the positions of the scanned point cloud on the reference grid, the number of intersection points per iteration was fixed to 20 units. The average and maximum error distances from the scanned point cloud to the reference mesh (C–M distance) were calculated using the distance calculation tool. Subsequently, a typical histogram of the error distance distribution and a Gaussian fit curve was obtained, with error distances following a normal distribution. A lower error distance corresponded to a better fit of the test sample to the reference grid, as well as a lower surface roughness [Citation45].
Figure 10. Analysis of WAAM-fabricated surface profile using error distance distribution.
4. Results and discussion
4.1. Model evaluation
The model of DOM was verified by the multi-layer deposition experiments, and the parameters used in the model are listed in . shows the prediction and experimental DOM curves at four currents. Obviously, the prediction curves are very close to the experimental ones. The fluctuations of the two curves gradually increased with time at different current conditions until the moment of droplet detachment. The reason can be attributed to the fact that in the early stage of wire melting, the droplet mass increases relatively slowly, the small droplets just formed oscillate weakly, and therefore the corresponding DOM curve fluctuates smoothly. The prediction and experimental curves show a decrease in the maximum magnitude of DOM as a function of current prior to droplet detachment. This is because the short time between droplet formation and detachment corresponded to a small droplet mass under high current conditions, which resulted in a decreasing trend of the maximum magnitude of DOM curves.
Figure 11. Evolution of droplet oscillation momentum (DOM). Note: the numbers in the figure are the DOM values at the peak and at the moment of detachment.
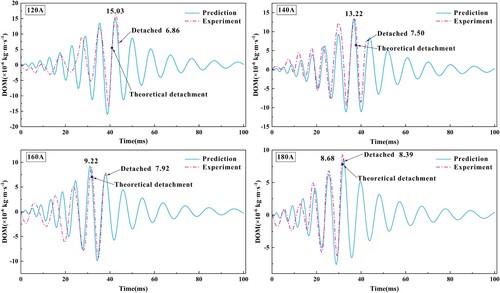
Table 2. Parameters for calculation.
also shows a difference between the prediction and experimental values of DOM within the first 20 ms. The difference can be attributed to the following reasons. In the early stage of droplet formation, the droplet oscillates weakly, and the movement of the droplet is significantly affected by the wire feed and current fluctuations during the deposition process, which leads to minor deviations in the experimental values of droplet displacement and DOM. In the range of 20–50 ms, the predicted values are in good agreement with the experimental values. This is because the growth of the droplet tends to be stable and exhibits regular oscillations during this period [Citation41]. In conclusion, the prediction values are in good agreement with the experimental values, indicating that the proposed DOM model has good accuracy.
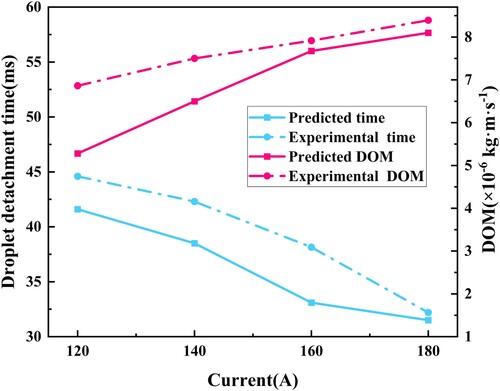
further presents the predicted and experimental values of droplet detachment time and DOM at the corresponding moments. It can be observed that as the current increases, droplet detachment time decreases. At the moment the droplet detaches from the end of the wire, its volume and mass were considered constant, meaning no change in gravitational force on the droplet. However, Equations (7) reveal an increment in the current increases the Lorentz forces. The change results in a large downward combined force F0 (calculated by Equation (3)) and a fast oscillation rate of the droplet, thereby promoting droplet detachment with a large DOM in a short period. Meanwhile, there is an error between the prediction and experimental values, and the maximum error value for DOM and time at droplet detachment do not exceed 5.0 ms and 1.58 × 10⁻⁶ kg·m·s−1, respectively (). In the real environment, the droplet does not detach at the theoretical detachment point (critical conditions described in Equation (11)), since it requires continuous holding of the oscillation for about a few milliseconds to accumulate enough energy to tear the neck of the droplet. Some authors argued that the resultant force F0 of the pendant droplet would exceed the maximum retention force provided by the surface tension, which is necessary but not sufficient for droplet detachment [Citation24]. As a result, it is a great challenge to offset the energy cost for breaking the connection between the droplet and the wire without sufficient oscillation rate before droplet detachment.
Figure 12. Evolution of droplet detachment time and droplet oscillation momentum (DOM) at droplet detachment.
4.2. Surface roughness and its evolution mechanism
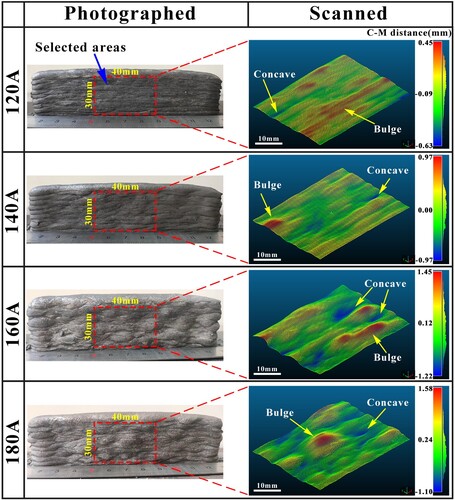
shows the macroscopic patterns and area scan point clouds of WAAM-fabricated components under different current conditions. The colour jet showed an error distance profile of the scanned cloud concerning the reference mesh. The component of 120A exhibited a good surface-forming quality with only a little splash point on its surface. The absolute values of the maximum error distance of the concave and convex areas were estimated to be 0.60 and 0.45 mm, respectively. The mixing phenomenon between layers was not apparent, with an external appearance resembling a plain, which implies that the deformation of the molten pool was weak during the WAAM process. As the current increased to 140A, obvious mixing between the layers took place. Significant bulges and depressions appeared on the component surface, with a slight increase in the degree of undulation. At the current reaching 160 A, the surface of the component developed bulging and depressed areas similar to natural mountains and lakes, resulting in poor surface-forming quality. The maximum error distance of the concave and convex areas reached 1.22 and 1.45 mm (absolute values), respectively. At a current of 180 A, the surface of the component exhibited a mountainous profile with a maximum error distance of 1.58 mm.
Figure 13. Macroscopic images and scanned point clouds of WAAM-fabricated components at four currents. In scanned components, red and blue indicate the high and low points from the reference plane, respectively.
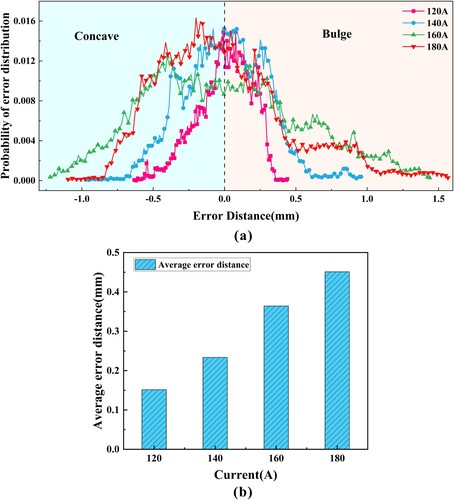
The probability of the error distance distribution of the scan cloud is depicted in (a). The alignment method for the point cloud was to fit the scan cloud to the reference mesh with as many points as possible. Therefore, the left axis in (a) was negative and represented the distance distribution in the concave region of WAAM-fabricated component. By comparison, the right axis was positive, indicating the distance distribution of the bulged region of WAAM-fabricated component. Meanwhile, the overall error distribution of the error distance was conforming to the Gaussian normal distribution. The quantitative analysis of the surface-forming quality of WAAM-fabricated component was conducted by selecting the required data. According to the literature of [Citation45], the average error distance was used as a single-value quantifier of the surface-forming quality of WAAM-fabricated components. (b) shows the average error distances of the WAAM-fabricated components with different current parameters. The results showed that the surface-forming quality of WAAM-fabricated components tended to decrease with the increase in current.
Figure 14. Analysis of error distances from the scanned point cloud to the reference mesh (C-M distance). (a) Error distance distribution and (b) average error distance of the four WAAM-fabricated components.
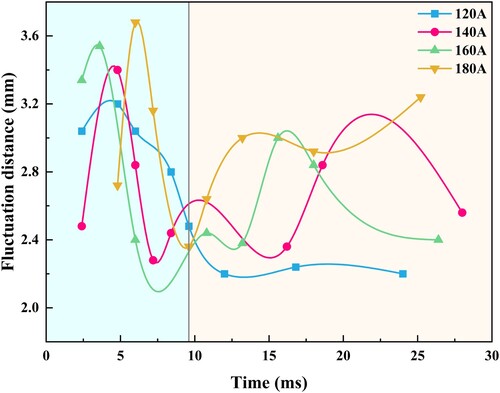
From the perspective of molten pool deformation, the influencing mechanism of current on the surface-forming quality of WAAM-fabricated component was analysed by high-speed image sequences of the molten pool. In WAAM, as the number of deposited layers increases, heat input and dissipation will reach equilibrium [Citation46], the overall temperature difference of the molten pool tends to decrease, the Marangoni convection effect inside the molten pool is weakened, and the dimensions of the molten pool will tend to stabilise [Citation47]. Obviously, this situation is not suitable for observing the molten pool deformation. Therefore, the first layer of molten pool height fluctuation data was recorded for some time after the droplet transfer. shows the behaviour of the molten pool height fluctuations taken with the high-speed camera. Under four different current conditions, after the droplet impact into the molten pool, the rapid transfer of molten metal from the front to the tail of the molten pool was observed, leading to different fluctuations in the molten pool height. Subsequently, four sets of molten pool fluctuation distances with different currents were counted, and the corresponding curves are given in . Obviously, the maximum fluctuation amplitude of the molten pool in all four groups tended to increase with the current within 9 ms after the droplets hit the molten pool (cyan area in ). In the following 20 ms (orange area in ), the molten pool fluctuations slowed down in a different trend. At 120 A, after the molten pool fluctuation distance reached the maximum, the molten pool gradually became flat with only slight fluctuations. This behaviour was in contrast to those of the molten pool fluctuation obtained with the other three sets of parameters (140A-180A), in where the molten pool still underwent an active fluctuation behaviour. In addition, the tolerance of the four data sets, meaning the range of the molten pool fluctuation distance for the corresponding current parameters, was counted. The data revealed a range for the molten pool fluctuation distance of 1.00 mm under 120 A current, as well as a maximum of 1.36 mm under 180 A, equivalent to an increase of 36%. The result indicated that the increase in current led to a significantly enhanced fluctuation time and fluctuation range error of the molten pool.
Figure 15. Images of the molten pool after droplet detachment at different currents.
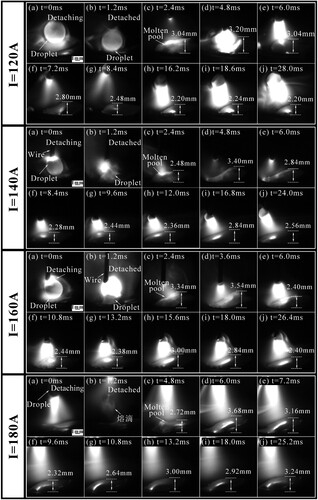
Figure 16. Analysis of fluctuation distance of the molten pool. Cyan area indicates the molten pool fluctuations that reach a maximum level and then decrease rapidly, while orange area indicates a decreasing trend of the molten pool fluctuations.
The intrinsic mechanism of molten pool fluctuations was analysed in the context of molten pool forces. The two stages of molten pool fluctuations are provided in . In the first stage, the droplet impact led to fluctuations in the surface of the molten pool ((a)). In the second stage, after complete immersion of the droplet in the molten pool, the molten pool was subjected to the combined action of the droplet impact force, arc pressure, Lorentz force, buoyancy, plasma drag force, and Marangoni convection, resulting in an upward bulge in the tail of the molten pool ((b)).
Figure 17. Schematic diagram of the molten pool fluctuation process: (a) droplet impact on the molten pool and (b) fluctuations and forces in the molten pool after droplet impacts.
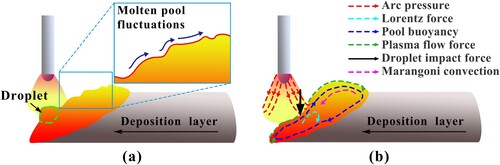
In the process of droplet impact, the impact force has a significant effect on the periodic flow of the molten pool [Citation48]. The molten metal flowed to the bottom and then to the tail of the molten pool, resulting in an upward expansion of the tail of the molten pool [Citation49] and an increase in the length and width of the molten pool [Citation50], as shown in (b). Increasing the current can make the phenomenon more pronounced, which is due to the momentum of the droplet increasing with the increase of current. During the WAAM process, the molten pool fluctuation was mainly affected by the arc pressure and the droplet impact force. The potential energy change in the molten pool fluctuation process was equal to the work of arc pressure and the droplet impact force [Citation51]. As the droplet hit the molten pool, the droplet momentum was completely transferred to the molten pool. And the molten metal flowed toward the tip and tail of the molten pool centered on the impact point, forming a convection cycle and increasing deformation of the molten pool [Citation52]. DOM determines the momentum of detached droplets. Therefore, an increase in DOM is the main reason for the severe fluctuations and deformation of the molten pool surface.
In addition, the melting rate of the wire became faster as the current increased, and the injection of large amounts of molten metal enhanced the magnitude of the molten pool fluctuations [Citation39]. The high heat input at a high current enhanced the molten pool temperature and oscillations [Citation51,Citation53]. In summary, the increase in DOM and the combined effects of various forces lead to irreversible collapse and deformation of the molten pool, which contributes to the degradation of surface-forming quality of WAAM-fabricated component.
4.3. Relationship between DOM and surface roughness
Various curves, including DOM, the Range of molten pool fluctuation distance (where Range represents the range error), and average error distance under different current conditions, are shown in (a). The curves displayed a consistent upward trend with an increase in current. For the range of 120A to 180A, the DOM underwent a transition from 6.86 × 10⁻⁶ kg·m·s−1 to 8.39 × 10⁻⁶ kg·m·s−1, an improvement of 22.3%. Meanwhile, the Range of molten pool fluctuation distance increased from 1.00 mm to 1.36 mm, a considerable rise of 36%. This emphasises the significant impact of DOM magnitude on the stability of the molten pool. Notably, the assessment of average error distances indicated a measurement of 0.15 mm at 120A and 0.45 mm at 180A, reflecting a substantial increase of 200%. The finding implies there is a robust positive correlation between DOM and the Range of molten pool fluctuation, while the Range of molten pool fluctuation is significantly positively correlated with average error distance. This result indicates that DOM affects surface-forming quality by acting on the stability of the molten pool.
Figure 18. (a) Evolution of droplet oscillation momentum (DOM), Range of molten pool fluctuation distance, and average error distance at different currents. (b) Mapping analysis of DOM and average error distance. Note that the average error distance corresponds to the surface roughness.
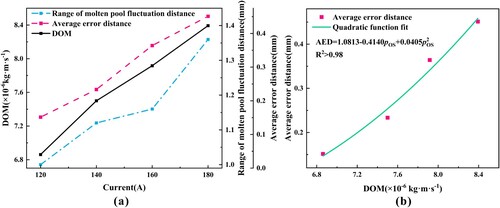
(b) presents the mapping between DOM and average error distance. By fitting the data and regression analysis, it was found that DOM and average error distance conformed to a quadratic relationship, as shown in Equation (23), with a coefficient of determination R2 > 0.98. The functional relationship can deepen our understanding of the WAAM process, and open up avenues for optimising surface-forming quality of WAAM-fabricated component.
(23)
where AED represents average error distance.
4.4. Model limitations
As mentioned above, the model of DOM can be used to: (I) analyse the droplet oscillatory growth behaviour and its effect on molten pool deformation; (II) predict the development of surface roughness. However, there are some limitations and challenges. Firstly, the model of DOM does not consider the effects of some factors during layer-by-layer deposition process, such as droplet density at high temperatures, or droplet oscillations caused by wire feeding and current fluctuations during the deposition process. Secondly, the modelling process assumes that the droplets are globular, which limits the model to assessing only the DOM and the surface-forming quality of WAAM-fabricated component in the globular droplet transfer mode, ignoring the spray transfer.
5. Conclusion
The effects of DOM on the surface-forming quality of WAAM-fabricated components were investigated for the first time and the main results can be summarised as follows:
A novel model of DOM was proposed to analyse droplet oscillatory growth behaviour, and its effect on molten pool deformation. The model fully considered the contribution of the wire motion to the droplet displacement, as well as provided experimental corrections for the spring and damping coefficients.
DOM has a significant effect on surface-forming quality of WAAM-fabricated component. This is because the reduction of DOM can decrease the geometric deformation of the molten pool, thereby maintaining the stability of the molten pool geometry.
The proposed model can effectively predict the development of surface roughness, and the relationship between DOM and surface roughness conforms to a quadratic function. Hence, DOM can be expected as a characteristic parameter to describe the surface-forming quality of WAAM-fabricated components.
In this work, globular droplet transfer is investigated. Future research could include improving the proposed model to accommodate different droplet transfer modes (e.g. short-circuit droplet transfer). This requires detailed consideration of the droplet separation criteria for different transfer modes, as well as the conditions when the transfer mode is switched. In order to deeply understand the the influence mechanism of DOM on surface-forming quality, it is necessary to further expand the process parameter window. In addition, the stability of droplet transfer during WAAM should be analysed in detail to assess the defect generation of the formed components and to develop preventive strategies. Overall, in order to make the proposed model play a role in precision additive manufacturing, its robustness and engineering feasibility need to be further investigated to ensure the stability of droplet transfer.
Disclosure statement
No potential conflict of interest was reported by the author(s).
Data availability statement
The data that support the findings of this study are available from the corresponding author upon reasonable request.
Additional information
Funding
References
- Huan P-C, Wang X-N, Zhang Q-Y, et al. Study on droplet transition behavior, bead geometric characteristics and formability of wire + arc additively manufactured Inconel 718 alloy by using CMT MIX+ Synchropulse process. J Mat Res Technol. 2022;17:1831–1841. doi: 10.1016/j.jmrt.2022.01.153
- Vora J, Parmar H, Chaudhari R, et al. Experimental investigations on mechanical properties of multi-layered structure fabricated by GMAW-based WAAM of SS316L. J Mat Res Technol. 2022;20:2748–2757. doi: 10.1016/j.jmrt.2022.08.074
- Chen Z, Han C, Gao M, et al. A review on qualification and certification for metal additive manufacturing. Virtual Phys Prototyp. 2022;17(2):382–405. doi: 10.1080/17452759.2021.2018938
- Xiong J, Yin Z, Zhang W. Closed-loop control of variable layer width for thin-walled parts in wire and arc additive manufacturing. J Mater Process Technol. 2016;233:100–106. doi: 10.1016/j.jmatprotec.2016.02.021
- Zhu L, Wang S, Lu H, et al. Investigation on synergism between additive and subtractive manufacturing for curved thin-walled structure. Virtual Phys Prototyp. 2022;17(2):220–238. doi: 10.1080/17452759.2022.2029009
- Laghi V, Palermo M, Gasparini G, et al. On the influence of the geometrical irregularities in the mechanical response of wire-and-arc additively manufactured planar elements. J Constr Steel Res. 2021;178:106490. doi: 10.1016/j.jcsr.2020.106490
- Xia C, Pan Z, Polden J, et al. A review on wire arc additive manufacturing: Monitoring, control and a framework of automated system. J Manuf Syst. 2020;57:31–45. doi: 10.1016/j.jmsy.2020.08.008
- Pattanayak S, Sahoo SK. Gas metal arc welding based additive manufacturing—a review. CIRP J Manuf Sci Technol. 2021;33:398–442. doi: 10.1016/j.cirpj.2021.04.010
- Xiong J, Li Y, Li R, et al. Influences of process parameters on surface roughness of multi-layer single-pass thin-walled parts in GMAW-based additive manufacturing. J Mater Process Technol. 2018;252:128–136. doi: 10.1016/j.jmatprotec.2017.09.020
- Hauser T, Reisch RT, Breese PP, et al. Oxidation in wire arc additive manufacturing of aluminium alloys. Addit Manuf. 2021;41:101958. doi: 10.1016/j.addma.2021.101958
- Huang Y, Wu D, Zhang Z, et al. EMD-based pulsed TIG welding process porosity defect detection and defect diagnosis using GA-SVM. J Mater Process Technol. 2017;239:92–102. doi: 10.1016/j.jmatprotec.2016.07.015
- Pal K, Bhattacharya S, Pal SK. Investigation on arc sound and metal transfer modes for on-line monitoring in pulsed gas metal arc welding. J Mat Proc Technol. 2010;210(10):1397–1410. doi: 10.1016/j.jmatprotec.2010.03.029
- Bhattacharya S, Pal K, Pal SK. Multi-sensor based prediction of metal deposition in pulsed gas metal arc welding using various soft computing models. Appl Soft Comput. 2012;12(1):498–505. doi.org/10.1016/j.asoc.2011.08.016
- Surovi NA, Soh GS. Acoustic feature based geometric defect identification in wire arc additive manufacturing. Virtual Phys Prototyp. 2023;18(1):e2210553. doi: 10.1080/17452759.2023.2210553
- Xiong J, Zhang G, Qiu Z, et al. Vision-sensing and bead width control of a single-bead multi-layer part: material and energy savings in GMAW-based rapid manufacturing. J Clean Prod. 2013;41:82–88. doi: 10.1016/j.jclepro.2012.10.009
- Xiong J, Zhang G. Adaptive control of deposited height in GMAW-based layer additive manufacturing. J Mater Process Technol. 2014;214(4):962–968. doi: 10.1016/j.jmatprotec.2013.11.014
- Zhan Q, Liang Y, Ding J, et al. A wire deflection detection method based on image processing in wire + arc additive manufacturing Int J Adv Manuf Technol. 2017;89(1-4):755–763. doi: 10.1007/s00170-016-9106-2.
- Diao C, Ding J, Williams S, et al. A passive imaging system for geometry measurement for the plasma arc welding process. IEEE Trans Ind Electron. 2017;64(9):7201–7209. doi: 10.1109/TIE.2017.2686349
- Bonaccorso F, Cantelli L, Muscato G. An arc welding robot control for a shaped metal deposition plant: Modular software interface and sensors. IEEE Trans Ind Electron. 2011;58(8):3126–3132. doi: 10.1109/TIE.2011.2114311
- Yang D, Wang G, Zhang G. Thermal analysis for single-pass multi-layer GMAW based additive manufacturing using infrared thermography. J Mater Process Technol. 2017;244:215–224. doi: 10.1016/j.jmatprotec.2017.01.024
- Tang S, Wang G, Zhang H, et al. An online surface defects detection system for AWAM based on deep learning. Paper Presented at the 2017 International Solid Freeform Fabrication Symposium. 2017.
- Doumanidis C, Kwak Y-M. Multivariable adaptive control of the bead profile geometry in gas metal arc welding with thermal scanning. Int J Press Vessels Pip. 2002;79(4):251–262. doi: 10.1016/S0308-0161(02)00024-8
- Gao X, Wang Y, Chen Z, et al. Analysis of welding process stability and weld quality by droplet transfer and explosion in MAG-laser hybrid welding process. J Manuf Process. 2018;32:522–529. doi: 10.1016/j.jmapro.2018.03.024
- Zhang X, Gao H, Li Z. Forces analysis of droplets and accurate control of metal transfer in GMAW by utilizing droplet resonance. J Manuf Process. 2021;70:121–131. doi: 10.1016/j.jmapro.2021.08.028
- Yudodibroto BYB, Hermans MJM, Hirata Y, et al. Pendant droplet oscillation during GMAW. Sci Technol Weld Joining. 2006;11(3):308–314. doi: 10.1179/174329306X101409
- Ersoy U, Kannatey-Asibu E, Hu SJ. Analytical modeling of metal transfer for GMAW in the globular mode. J Manuf Sci Eng. 2008;130(6). doi: 10.1115/1.3006317
- Wu CS, Chen MA, Li SK. Analysis of excited droplet oscillation and detachment in active control of metal transfer. Comput Mat Sci. 2004;31(1-2):147–154. doi: 10.1016/j.commatsci.2004.02.002
- Xiao J, Zhang GJ, Zhang WJ, et al. Active metal transfer control by utilizing enhanced droplet oscillation part 1: experimental study. Weld J. 2014;93(8):282–291.
- Chang YL, Liu XL, Lu L, et al. Impacts of external longitudinal magnetic field on arc plasma and droplet during short-circuit GMAW. Int J Adv Manuf Technol. 2014;70:1543–1553. doi: 10.1007/s00170-013-5403-1
- Wong Y-R, Ling S-F. An investigation of dynamical metal transfer in GMAW—Effects of argon shielding gas. J Mater Process Technol. 2014;214(1):106–111. doi: 10.1016/j.jmatprotec.2013.08.003
- Murphy AB. A self-consistent three-dimensional model of the arc, electrode and weld pool in gas–metal arc welding. J Phys D Appl Phys. 2011;44(19):194009), doi: 10.1088/0022-3727/44/19/194009.
- Sun J-S, Wu C-S. The influence of arc pressure on the MIG weldpool dimensions. Acta Metall Sin (China). 2001;37(4):434–438.
- Zhang Y, Chen Y, Li P, et al. Weld deposition-based rapid prototyping: a preliminary study. J Mater Process Technol. 2003;135(2-3):347–357. doi: 10.1016/S0924-0136(02)00867-1
- Xiao J, Zhang GJ, Zhang WJ, et al. Active metal transfer control by utilizing enhanced droplet oscillation part II: modeling and analysis. Weld J. 2014;93(8):321–330.
- Zhang X, Gao H, Zhang G. Current-independent metal transfer by utilizing droplet resonance in gas metal arc welding. J Mater Process Technol. 2020;279:116571. doi: 10.1016/j.jmatprotec.2019.116571
- Jones LA, Eagar TW, Lang JH. Magnetic forces acting on molten drops in gas metal arc welding. J Phys D Appl Phys. 1998;31(1):93), doi: 10.1088/0022-3727/31/1/013
- Kim YS, Eagar TW. Aip conference proceedings. Welding J. 2019;2133:030019. doi: 10.1063/1.5114003.
- Choi JH, Lee J, Yoo CD. Dynamic force balance model for metal transfer analysis in arc welding. J Phys D Appl Phys. 2001;34(17):2658. doi: 10.1088/0022-3727/34/17/313.
- Lesnewich A. Control on melting rate and metal transfer in gas shielding metal arc welding. Weld. J. 1958;37(8):343–353.
- Guan Q. Generalized additive manufacturing based on welding/joining technologies. Автоматическая сварка. 2013;2013(10-11):33–37.
- Scotti A, Ponomarev V, Lucas W. A scientific application oriented classification for metal transfer modes in GMA welding. J Mat Proc Technol. 2012;212(6):1406–1413. doi: 10.1016/j.jmatprotec.2012.01.021
- Lv X, Wang Z, Su H, et al. Analysis of droplet growth of positive and negative electrode on cold metal transfer welding of aluminum wire. J Manuf Process. 2022;78:330–340. doi: 10.1016/j.jmapro.2022.04.026
- Besl PJ, McKay ND. Method for registration of 3-D shapes. Paper presented at the Sensor fusion IV: control paradigms and data structures, 1992.
- Kozjek D, Porter C, Carter FM, et al. Iterative closest point-based data fusion of non-synchronized in-situ and ex-situ data in laser powder bed fusion. J Manuf Syst. 2023;66:179–199. doi: 10.1016/j.jmsy.2022.12.007
- Nair SA, Sant G, Neithalath N. Mathematical morphology-based point cloud analysis techniques for geometry assessment of 3D printed concrete elements. Addit Manuf. 2022;49:102499. doi: 10.1016/j.addma.2021.102499.
- Wu B, Ding D, Pan Z, et al. Effects of heat accumulation on the arc characteristics and metal transfer behavior in Wire Arc Additive Manufacturing of Ti6Al4V J Mater Process Technol. 2017;250:304–312. doi: 10.1016/j.jmatprotec.2017.07.037
- Zhou S, Xie H, Ni J, et al. Metal transfer behavior during CMT-based Wire Arc Additive Manufacturing of Ti-6Al-4V alloy. J Manuf Process. 2022;82:159–173. doi: 10.1016/j.jmapro.2022.07.063
- Cheon J, Venkata Kiran D, Na S-J. CFD based visualization of the finger shaped evolution in the gas metal arc welding process. Int J Heat Mass Transf. 2016;97:1–14. doi: 10.1016/j.ijheatmasstransfer.2016.01.067
- Cadiou S, Courtois M, Carin M, et al. 3D heat transfer, fluid flow and electromagnetic model for cold metal transfer wire arc additive manufacturing (Cmt-Waam). Addit Manuf. 2020;36:101541. doi: 10.1016/j.addma.2020.101541
- Cao H, Huang R, Yi H, et al. Asymmetric molten pool morphology in wire-arc directed energy deposition: Evolution mechanism and suppression strategy. Addit Manuf. 2022;59:103113), doi: 10.1016/j.addma.2022.103113.
- Chen J, Schwenk C, Wu CS, et al. Predicting the influence of groove angle on heat transfer and fluid flow for new gas metal arc welding processes. Int J Heat Mass Transf. 2012;55(1-3):102–111. doi: 10.1016/j.ijheatmasstransfer.2011.08.046
- Cho D-W, Song W-H, Cho M-H, et al. Analysis of submerged arc welding process by three-dimensional computational fluid dynamics simulations. J Mater Process Technol. 2013;213(12):2278–2291. doi: 10.1016/j.jmatprotec.2013.06.017
- Zhou X, Zhang H, Wang G, et al. Three-dimensional numerical simulation of arc and metal transport in arc welding based additive manufacturing. Int J Heat Mass Transf. 2016;103:521–537. doi: 10.1016/j.ijheatmasstransfer.2016.06.084
- Arif N, Lee JH, Yoo CD. Modelling of globular transfer considering momentum flux in GMAW. J Phys D Appl Phys. 2008;41(19):195503. doi: 10.1088/0022-3727/41/19/195503