
 ?Mathematical formulae have been encoded as MathML and are displayed in this HTML version using MathJax in order to improve their display. Uncheck the box to turn MathJax off. This feature requires Javascript. Click on a formula to zoom.
ABSTRACT
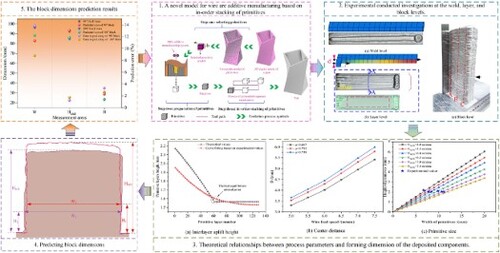
To address the issue of low accuracy of directed energy deposition-arc (DED-Arc) and expand its use in producing large-sized components, a novel concept called “in-order stacking of primitives” has been proposed. This concept aims to simplify the additive manufacturing (AM) planning process and improve forming accuracy. Experiments at the weld, layer, and block levels examined relationships between process parameters and primitive dimensions, offset distance, and interlayer lift height. Increasing heat and mass transfer significantly increased primitive width and surface roughness but had little effect on height variation (1.95-2.27 mm). The impact of offset distance on the forming precision for layer-level components varied by the stacking path used, with Zig-Zig level parts showing more deterioration than Zig-Zag level parts. Thermal equilibrium in block components was achieved within a critical height range of 88.2 to 112.0 mm. The stacking path has a substantial impact on the surface temperature and is a crucial factor for ensure accurate workpiece formation. This study establishes a physical relationship between component forming quality and process parameters through mathematical expressions that are supported by experimental results. Future research will focus on optimizing the physical model and refining the mathematical expressions.
GRAPHICAL ABSTRACT
1. Introduction
Directed energy deposition-Arc (DED-Arc) is a technology that utilises a welding arc as a heat source to deposit metal wire or powder layer by layer. This technique offers numerous advantages, including high forming efficiency, high material utilisation, low cost, and the ability to produce unrestricted part sizes [Citation1–3]. Its technical and economic benefits have made DED-Arc a popular choice for manufacturing large-scale components [Citation2, Citation4, Citation5]. High strength aluminum alloys are widely used in aerospace, automotive, and shipbuilding due to exceptional strength-to-weight ratio and weldability [Citation6, Citation7]. While additive manufacturing (AM) has expanded aluminum alloy applications through increased design freedom, DED-Arc aluminum components still face precision limitations.
Limited forming accuracy remains a major challenge restricting widespread DED-Arc adoption [Citation8, Citation9]. The high heat input of DED-Arc causes variable heat dissipation and solidification rates across layers during deposition [Citation10]. Faster cooling regions exhibit greater layer heights compared to slower cooling areas, producing cumulative height differences that compromise part quality [Citation11]. This forming defect also demonstrates substantial hereditary characteristics between layers [Citation12–14].
To improve the low forming accuracy in DED-Arc, researchers have explored closed-loop control methods, optimised deposition paths and parameters, reduced interlayer heat accumulation, and mitigated residual stresses. Notable approaches include Xiong et al.’s neuro model for adaptive height regulation through arc voltage-wire extension matching and deposition width control with a single neuron module [Citation15, Citation16]. Li et al. investigated the influence of deposition paths and interlayer overlapping parameters on the forming accuracy of DED-Arc. By optimising these factors, they successfully improved the forming accuracy of the DED-Arc process [Citation17, Citation18]. Another common approach to enhance forming accuracy is by reducing heat accumulation during the additive process. Da et al. [Citation19] studied the relationship between interlayer heat dissipation and forming accuracy of components using a water bath cooling method. Heinrich et al. [Citation20] achieved a 50% reduction in interlayer cooling time by utilising an actively cooled heat exchanger system on the substrate. Furthermore, Zhao and Alhakeem employed finite element models to predict part thermal cycles and identify deposition strategies with minimal heat accumulation [Citation11, Citation20]. Regarding the issue of forming accuracy affected by residual stresses, Amal et al. [Citation21] addressed this by defining appropriate deposition paths to adjust the impact of stress on forming accuracy. Numerous researchers have conducted extensive studies to improve the forming accuracy of the component fabricated by DED-Arc. These studies utilise diverse techniques including parameter modulation, deposition path optimisation, and interlayer heat dissipation enhancement. However, the efficacy of these methods for precise forming control remains restricted, particularly for complex geometries. For example, adjusting toolpaths in DED-Arc at intersecting features can moderately reduce protrusions. Nevertheless, path planning alone cannot enable accurate fabrication of such structures. Thus, novel methodologies must be developed to resolve forming precision limitations in DED-Arc.
To further enhance forming quality of intricate geometries in additive manufacturing, it is imperative to comprehend the fundamental physics and refine process control at a more granular level. This entails transitioning from prevalent layer-by-layer planning around weld beads to more discrete process modelling and regulation at the scale of stacked primitives (points/blocks). By coordinating heat source, material responses, and forces, improved mastery over the additive forming process can be attained. Zhou et al. [Citation22] developed a simulation technique for the thermal behaviour in DED-Arc that significantly boosted prediction efficiency and accuracy over conventional methods. In another study, Zhou et al. [Citation23] addressed degraded thermomechanical properties and resultant defects in DED-Arc components through deposition path planning that refined thermo-mechanical attributes. Experiments showed this approach reduced thermomechanical variations along the path by 87% and decreased Von Mises stress by 32 MPa [Citation23]. These works exemplify in-order stacking primitives in DED-Arc, focused on regulating subdivided units to achieve precise melting and solidification.
Cold metal transition (CMT), as a novel welding method, greatly reduces the heat input during the additive process by adopting intermittent arc starting and extinguishing transition [Citation24, Citation25]. Therefore, it is considered an ideal heat source for DED-Arc aluminum alloys. To achieve better control over DED-Arc, it is necessary to move away from conventional methods and further segment the process planning and control from the welds/layers-level linear planning to the points/blocks-level planning after discrete segmentation of the welds/layers. This study introduces the concept of in-order stacking primitives for DED-Arc and provides an overview of the process and design principles involved. Experiments are designed at various levels, including the weld, layer, and block, to explore the correlation between component forming accuracy and primitive stacking paths. The main objective is to establish a precise control concept for DED-Arc based on ‘elemental structures’, which will serve as the basis for optimising the control of component forming accuracy, structure, and properties at a micro-element level.
2. Methods
2.1. In-order stacking of primitives
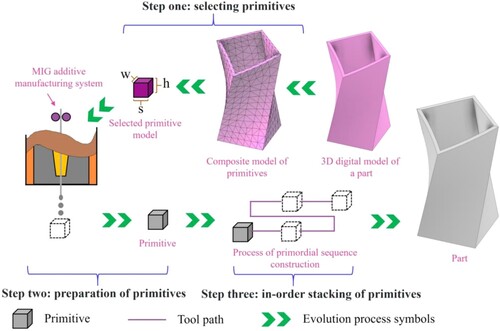
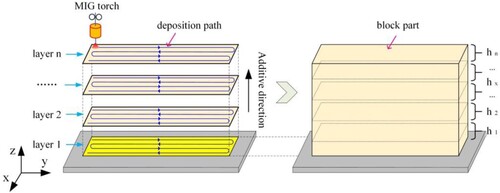
Compared to conventional layer-by-layer DED-Arc, in-order stacking of point/block primitives enables more precise control over forming accuracy by utilising smaller volume additively manufactured units. The complex shape is decomposed into simpler primitives that can be easily manufactured. By decomposing the complex shape into these simpler primitives, each individual primitive is deposited accurately. outlines the primitive stacking process, comprising three key stages. First, the shape and size of the primitives are determined based on the component's 3D model, defining length s, width w and height h. Appropriate primitive selection ensures suitable inter-connectivity during stacking, averting defects like uneven surfaces from issues like ‘crowding’ or ‘sparsity’. Second, the characteristics and transitions of melt droplets are customised by adjusting the feedstock composition, feeding method, wire feed speed, current waveform, and voltage to achieve the desired primitive dimensions and morphology. Moreover, optimising these parameters can also ensure the deposition efficiency of the parts. Third, the generated primitives are stacked sequentially along predefined toolpaths to manufacture the part. At this stage, the physical and mathematical expressions of the quality of workpiece formation and process parameters guide the stacking of the primitives in an orderly manner, ensuring that each primitive can accurately deposit and follow the defined order. This approach provides greater flexibility and precision, allowing for better control and optimisation of the manufacturing process. Moreover, optimal path planning further improves additive manufacturing accuracy [Citation21]. More path options during stacking promote growth in the desired direction, enhancing accuracy.
Figure 1. Schematic diagram of the process of in-order stacking of primitive in WAAM.
2.2. Design principles
The in-order stacking process highlights that properly designed primitive shapes and sizes are critical for ensuring forming accuracy. Hence, primitive design is an essential prerequisite for implementing this approach in DED-Arc. The following factors should be considered when determining shape and size: (1) Component geometry: primitives should conform to the component shape and adequately fill space to enable layer-by-layer stacking. (2) Precision requirements: smaller primitives allow better adaptation to surfaces and reduce errors for high accuracy components, while larger ones improve efficiency when dimensional needs are less stringent. (3) Molten pool flow: excessively large primitives can hinder control over the molten pool, while very small ones may cause transition difficulties. Appropriate sizes balance quality and efficiency. (4) Metal type – different surface tension and thermal conductivity influence molten pool flow and solidification, necessitating consideration of material properties. (5) Machine specifications: distinct equipment exhibits different arc transition speeds, accuracy and power that impact achievable primitive sizes and shapes. Hence, comprehensive analysis balancing component shape, accuracy needs, material attributes and machine capabilities are required to select optimal primitives that match the part and process control. Active exploration and validation through theoretical calculations, experiments and other means is necessary to determine the best primitive design.
To illustrate the fundamental concept of in-order stacking of primitives and simplify calculations of their geometric dimensions, a cube has been selected as the primitive model in previous studies [Citation23, Citation26]. The geometric dimensions of the primitives include the width and height at the weld level. Given the challenges involved in directly determining the geometric dimensions of complex-shaped primitives using traditional geometric relations, Equation (1) has been established to compute the volume of the primitives based on the perspective of molten volume relationships. This approach effectively overcomes the difficulties associated with calculating the volumes of intricate primitives. where represents the wire feeding time (in minutes),
represents the wire diameter (in millimeters), and
represents the wire feed speed (in meters per minute).
(1)
(1)
2.2.1. Energy balance
The influence of heat input on primitive size is the result of the coupling effect of various factors, including process parameters and other variables. This makes it difficult to directly study the relationship between these factors and primitive size. Therefore, it is necessary to establish a theoretical model to simplify this relationship.
i: According to the relationship of energy balance, it can be determined that under energy balance, the energy inputted into the preform is equal to the energy
dissipated from the preform per unit time [Citation27]:
(2)
(2) where
represents the energy inputted into the preform per unit time, and
represents the energy dissipated from the preform per unit time.
ii: Reference [Citation28] provides a method for calculating the heat input in arc welding, as shown in equation (3):
(3)
(3) where η is the heat input coefficient,
is the arc voltage in volts, and
is the arc current in amperes.
iii: Heat conduction (), heat convection (
), and heat radiation (
) are the modes of heat dissipation.
should be the sum of heat dissipated through these three modes, as shown in Equation (4) [Citation27]:
(4)
(4) It should be emphasised that in most cases, the amount of heat dissipated through convection and radiation is negligible [Citation10, Citation27]. This is particularly true when the deposited part has a small volume and is in close contact with the substrate. Consequently, it is assumed in this study that heat is exclusively dissipated through thermal conduction, making
the energy dissipated from the preform [Citation27]. Therefore, the equation can be simplified as follows:
(5)
(5) where
is the heat flux density on the isothermal surface of the object,
is the temperature at the top surface of the primitives,
is the temperature of the substrate during thermal equilibrium,
is the heat conductivity coefficient in W/m·K,
is the heat transfer area between the primitives and the substrate, and
is the height of the primitives.
iiii: is the heat transfer area between the primitives and the substrate. Based on the longitudinal section geometry characteristics of the primitives, it can be determined that it is a rectangle, with the length direction being the arc moving direction. Therefore, we have:
(6)
(6) where
is the travel speed,
is the width,
is the constant unit of time.
iiiii: By combining Equations (3) to (6), we can obtain:
(7)
(7) Equation (7) clearly demonstrates the relationship between the width and height of the primitives and the substrate temperature, the travel speed, and arc current voltage. Increasing the substrate temperature or arc current voltage can decrease the height of the primitives. On the other hand, increasing the travel speed leads to an increase in the height of the primitives. This indicates that the dimensions of the primitives can be adjusted by manipulating these parameters.
2.2.2. Volume balance
Considering that the primitive is a unit with length, width, and height, it is ideal to restrict the primitive to a specific shape by ensuring that the volume of the melted wire material is equal to the volume of the solidified component [Citation29]. Literature [Citation30]; [Citation32] indicates that the cross-sectional profile of the weld bead can be approximated by circular arc, parabola, and cosine curve. To compare the adaptability of these three profile models, the ranges of constraints on the width and height of the primitives for each model are presented. The derivation process for the constraint range of the circular arc profile model is as follows:
i: Based on the volume equivalence between the melted wire material and the solidified component, Equation (8) is obtained:
(8)
(8) where
is the volume of melted wire material per unit time, and
is the volume of solidified component per unit time.
ii: The volume of melted wire material per unit time is given by:
(9)
(9) iii: Calculating the volume of
as shown in , when the cross-sectional profile of the primitive is circular arc, the minor axis of the ellipse corresponds to the width (
) of the primitive, and the polar axis corresponds to the height (
) of the primitive. The values of
and
satisfy Equation (10):
(10)
(10) The double integration of the circular arc profile as the cross-sectional profile, with the volume integration length being
, yields the volume
of the solidified component:
(11)
(11) By combining Equations (7), (8), (9), and (11), the following solutions are obtained:
(12)
(12)
(13)
(13) Similarly, the constraint ranges for the width and height of the primitives for parabolic and cosine profile models can be determined using the same derivation method. provides the constraint ranges for these three profile models. The values of
,
, and
differ depending on the material and welding heat source.
Table 1. Geometric models and dimensional constraint ranges of the primitive cross-sectional profiles.
2.2.3. Heat balance
As the height of deposition increases, the layer height of primitives undergoes a significant reduction followed by a stable stage. This height change is directly influenced by the temperature of the overlaying layer. During the stage of reduction, the heat input to the workpiece is greater than the heat dissipated
from the workpiece, resulting in a continuous increase in the workpiece temperature and a reduction in the layer height of primitives. As the workpiece temperature rises, the temperature gradient intensifies, leading to an increase in heat dissipated
. When the workpiece temperature reaches a certain value, the heat input
becomes equal to the heat dissipation
, indicating that the workpiece has reached a heat balance state. In this state, the layer height of primitives remains constant. Based on this heat balance relationship, a thermal equilibrium equation is established to calculate the critical height
at which the workpiece reaches thermal equilibrium. The expression for the critical height in thermal equilibrium is as follows:
(14)
(14) Where:
represents the temperature at the top surface of the workpiece when thermal equilibrium is reached,
is the temperature of the substrate,
(m2) is the heat conductive area,
is the heat efficiency coefficient of the welder [Citation27], ranging from 0.65 to 0.9 for MIG/MAG welding, and
(V) and
(A) represent the current and voltage, respectively.
(m2
K
W−1) stands for the thermal resistance between the layer of primitives and the substrate [Citation27].
The fluctuation in layer height poses a challenge for determining the interlayer lifting height of the welding torch. Based on the relationship between the height of the primitives and the height of the component, the lifting height of the welding torch can be divided into a height decreasing segment and a height stable segment, with the critical height value of thermal equilibrium as the boundary. In the height stable segment, the height of the primitives remains steady, and the welding torch can be lifted at a fixed distance. However, in the height decreasing segment, the height of the primitives continuously decreases, resulting in varying interlayer lifting heights of the welding torch. Therefore, determining the range of welding torch lifting height through theoretical calculation and reducing the impact of inappropriate lifting height on the forming accuracy of the workpiece is a relatively simple way. The process of establishing the equation for welding torch lifting height is as follows:
i: To maintain a constant distance between the welding torch nozzle and the substrate, it is necessary to ensure that the interlayer lifting height of the welding torch is equal to the height of the primitives of that layer. Based on this condition, equation (15) can be established:
(15)
(15) where
is the temperature of the current cladding layer.
ii: Calculate the temperature of the current cladding layer. In the height decreasing segment of the primitives, the temperature of the cladding layer increases layer by layer until it reaches the temperature
at thermal equilibrium of the workpiece. Within a short period of time, the temperature increase in the cladding layer approximately follows a linear relationship. Based on this condition, Equation (16) can be established:
(16)
(16) where
is the temperature of the substrate,
is the number of primitives at critical thermal equilibrium, and
is the number of primitive layers.
iii: By combining Equations (15) and (16), Equation (17) for the interlayer lifting height of the welding torch can be obtained:
(17)
(17) Based on energy balance and volume balance, an equation relationship between process parameters and primitive geometric dimensions has been established for predicting the length and width of the primitives under different process conditions. Subsequently, based on the heat balance relationship, predictive models for the critical height of heat balance in the vertical direction of the bulk component and the layer-by-layer height prediction model during the heat imbalance stage of the primitive layers have been established, providing theoretical basis for accurate deposition of complex components.
3. Experiments
3.1. Materials and processes
Experiments were conducted using the DED-Arc platform shown in . The experiments involved additive manufacturing at the weld level, layer level, and block level. The platform comprised a CMT welding power, a wire feeder, a KUKA 6-axis robotic arm, a robot control cabinet, a MIG welding torch, and a workbench. Pure argon (100%) served as the shielding gas for the molten pool, and a 1.2 mm diameter 2319 aluminum alloy welding wire was used as the filler metal. During the DED-Arc process, the welding power was set to the single-pass mode, and the component was additively manufactured onto a 5183 rolled-state aluminum alloy plate measuring 300 mm × 300 mm × 5 mm. The chemical elements and composition of the filler metal and substrate are specified in . It is worth noting that, considering the influence of interlayer temperature on the accuracy of part formation, the interlayer waiting time has been set at 40 s, and the distance from the welding gun nozzle to the surface of the part is 12 mm.
Figure 2. The robotic WAAM platform: (a) schematic diagram of the WAAM system; (b) CMT welding equipment.
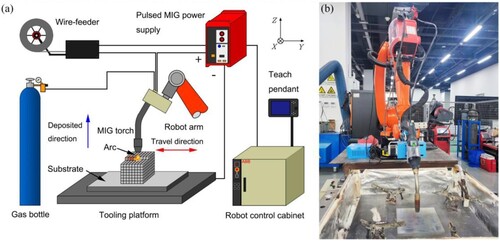
Table 2. Chemical composition of the substrate plate and filler metal.
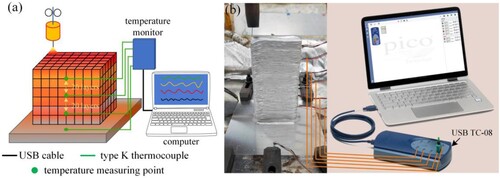
To precisely capture the three-dimensional dimensions of the components, a 3D scanner (OKIO-5M-400 model) developed by Beijing Tianyuan Company was employed. The equipment comprised a 3D scanner, scanner driver software, and a workbench. The 3D scanner featured two industrial cameras with 5-megapixel resolution, which scanned the component’s surface through raster scanning. Geomagic Qualify software was utilised to process the component’s three-dimensional data. This software could extract cross-sectional profiles, measure dimensions of the component (with a measurement accuracy of ±0.015 mm), and convert shape information into point cloud data. A temperature monitoring system, as shown in , was set up to measure the surface temperature at different height positions during the additive manufacturing process of the block. The system mainly consists of a USB TC-08 thermocouple data logger, several K-type thermocouples, and a computer running PicoLog 6 software. The temperature measurement range of the USB TC-08 thermocouple data logger is −270–1820°C, with a measurement accuracy of 0.025°C. After temperature measurement begins, the USB TC-08 thermocouple data logger is operated through the user interface of the PicoLog 6 software to collect electrical signals transmitted by the thermocouples in real-time. Temperature measurements are taken every second. To characterise the surface temperature at different heights of the block, adjacent measurement points are set at intervals of 20 layers. After the temperature measurement is completed, the temperature monitoring data is exported using the PicoLog 6 software. Subsequently, these data are imported into Origin software for further analysis.
Figure 3. Temperature monitoring system: schematic diagram (a) and actual photograph (b) of temperature measurement for the bulk component.
3.2. Weld-level
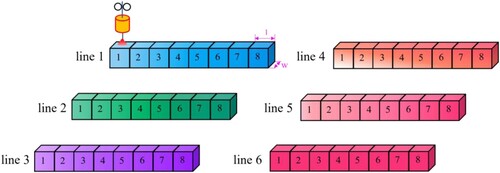
The aforementioned CMT additive manufacturing platform was used to conduct weld-level experiments based on in-order stacking of primitives, aiming to study the impact of heat and mass transfer on forming accuracy of the deposited weld. depicts a schematic diagram illustrating the discretization of the weld into several primitives. The size of the primitives is closely related to the heat input. By controlling the process parameters associated with heat, such as travel speed, welding current and voltage, the geometric dimensions of the primitives can be adjusted to ensure the forming accuracy of the parts [Citation10]. In the DED-Arc process, the heat of the component is distributed among the primitives through in-order stacking, allowing adjustment of the heat density of the deposited components by controlling the heat of the primitives.
Figure 4. Schematic diagram of in-order stacking primitives in DED-Arc at the weld level.
During the actual DED-Arc process, the welding current, voltage, and the travel speed are essential parameters that determine the density of welding heat input. In the single-pass mode of the welding power, the welding current and arc voltage are associated with the wire feed speed. Unlike the travel speed, the wire feed speed not only affects the heat of the molten pool but also influences the quality and volume of the molten pool. Hence, the wire feed speed was selected as the experimental variable for the process parameters. It is noteworthy that key preliminary experiments were conducted within the typical range of wire feed speeds (3∼8 m/min) and arc travel speeds (0.005∼0.02 m/min). After careful evaluation, process parameters that demonstrated stable performance and yielded excellent formability were selected for the current experiment. The specific parameters are detailed in .
Table 3. WAAM process parameters used in this experiment.
3.2. Layer-level
Select the process parameters with good forming of the weld (wire feed speed of 5 m/min, travel speed of 0.01 m/min) for the layer-level experiments, as shown in , aiming to explore the influence of the overlapping distance (also known as offset distance) between the beads and stacking paths of primitives in DED-Arc on layer-level forming accuracy. Unlike the one-dimensional stacking path at the weld level, layer-level additive manufacturing allows for stacking primitives along straight or curved paths. Reducing the offset distance may result in heat concentration and part deformation. Optimising the stacking paths can improve heat distribution and enhance part dimensional accuracy. Therefore, the rational selection and control of these parameters are the key to manufacturing metal parts with excellent performance and precise shape. In this experiment, the process parameters at the layer level were identical to those at the weld level. Based on the research findings of Suryakumar, Ding, Fang, and others regarding the weld bead contour overlap model, offset distances of 0.667w, 0.713w, and 0.738w were chosen [Citation31, Citation32, Citation52]. These values encompass the ideal offset distances. The Zig-Zig ((a)) and Zig-Zag ((b)) paths were employed as the stacking paths of the primitives.
Figure 5. Schematic diagram of in-order stacking at the layer level: (a) Zig-Zig path; (b) Zig-Zag path.
The surface quality of the layer level can be quantified using the root mean square deviation of the contour () and the skewness of the contour (
) [Citation33]. The formulas for calculating these two parameters are provided by Equation (18) and Equation (19) respectively. The root means square deviation (
) signifies the extent to which the surface contour deviates from the reference plane, providing information about height and spacing, and it is the average value over the entire surface. The skewness of the contour (
) reflects the symmetry of the surface contour relative to the central plane, characterising the surface contour shape.
(18)
(18)
(19)
(19) Where:
represents the deviation, i.e. the distance from the actual point to the fitted plane.
and
indicate the numbers of points in the computed area.
Since the layer is constructed by stacking a series of primitives along a planned path, the difference between the sum of the primitive volumes and the volume of the layer represents the forming accuracy of layer-level additive manufacturing. The volume removal rate can be used as an indicator to quantify the forming accuracy of additive manufacturing. The calculation method is defined by Equation (20), where V represents the volume of the layer calculated using the method mentioned in reference [Citation34]. V’ represents the sum of the volumes of the primitives, and R represents the degree to which the additive manufactured part deviates from the stacking model of the primitives. A smaller value of indicates that the volume of the additive manufactured part is closer to the desired volume, indicating higher forming accuracy.
(20)
(20)
3.3. Block-level
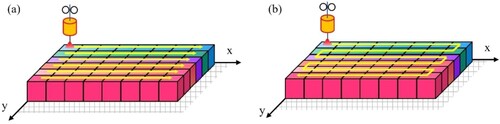
In DED-Arc at the block level, the stacking paths of primitives can be planned in three dimensions – the x-axis, y-axis, or z-axis. Block-level stacking additive manufacturing adds the z-axis dimension compared to layer-level stacking. Studying the influence of the z-axis dimension on the forming accuracy of layer-level parts can reflect the forming accuracy of the block-level parts. Although the x-axis and y-axis directions are determined, the height in the z-axis direction (number of deposited layers) and the angle between adjacent primitive layer (stacking path) in block-level components can be freely adjusted. Therefore, the number of deposited layers [Citation10] and the stacking path [Citation35–37] are factors that affect the forming accuracy of block-level components. To investigate the influence of these two factors on the forming accuracy of block components and reveal the relationship between the forming accuracy and these factors, block-level additive manufacturing experiments were conducted using well-performing process parameters, including a wire feed speed of 5 m/min and a travel speed of 0.01 m/min, as well as a Zig-Zag filling pattern.
shows the height stacking experiment, which mainly explores the variation of primitive layer height during layer-by-layer accumulation. The experiment used process parameters and stacking paths (Zig-Zag) that demonstrated good forming quality at the layer level. Each primitive layer was deposited layer-by-layer along the z-axis, with a waiting time of 40 s between layers. The distance between the welding torch nozzle and the top surface of the primitive layer was maintained at 12 mm. A total of 130 layers were stacked. The height of each primitive layer was measured layer by layer using a height gauge (accuracy ±0.01 mm), and the average of three height measurements at different positions was taken as the height of the current primitive layer. K-type thermocouples are used to measure the temperature at specific positions in the layer block part. The selected temperature measurement positions were the substrate, the 10th layer of the block, the 30th layer, the 50th layer, the 70th layer, the 90th layer, and the 110th layer.
Figure 6. Schematic of height stacking experiment for block-level component.
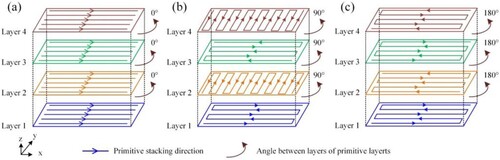
Furthermore, the influence of stacking paths on the forming accuracy of block-level components was studied. (a–c) show schematic diagram of different typical stacking primitive paths: single direction stacking path, grid stacking path, and multiple layer Zig-Zag stacking path. In other words, the single direction stacking path rotates the layers around the z-axis by 0°, the grid stacking path rotates the layers around the z-axis by 90°, and multiple layer Zig-Zag stacking path rotates the layers around the z-axis by 180°.
Figure 7. Schematic diagram of different typical stacking primitive paths for block-level components: (a) single direction stacking path, (b) grid stacking path, (c) multiple layer Zig-Zag stacking path.
Similarly, the volume removal rate can also be used as a quantitative indicator to evaluate the forming accuracy of the block-level components. At this point, unlike the forming accuracy of the layer-level parts in the quantisation,
represents the volume of the block, and
represents the sum of the volumes of the primitives used to construct it. The forming quality on its upper surface is quantified using
and
. By studying the values of
,
, and
, the influence of the z-axis dimension on the forming accuracy of volumetric components can be analysed.
4. Results and discussion
4.1. Heat and mass transfer on weld-level
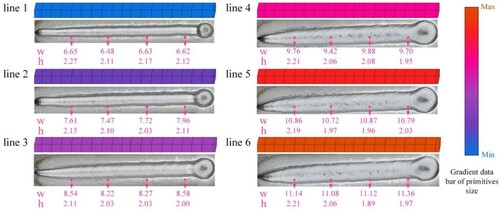
illustrates that a weld is formed by stacking multiple primitives along a one-dimensional path. The width, height, and surface roughness of the weld reflect the width, height, and surface roughness of the primitives used to form the weld. Increasing the heat and mass transfer results in a significant increase in the width and surface roughness of the primitives. To quantify the influence of the heat and mass transfer on the geometric morphology of the primitives and reveal the relationship between the heat and mass transfer and primitive geometric dimensions, the cross-sections of the welds were equidistantly captured using 3D scanning software, and then the width and height of these cross-sectional profiles were measured respectively. Due to the fact that the travel speed at the beginning and end of a weld is lower than the set speed of 0.01 m/s, the stable section of the travel speed was chosen for measuring the weld dimensions. As shown in , the average minimum width and height within the smallest heat and mass transfer weld were 6.59 and 2.17 mm, respectively. In contrast, the maximum width and height within the largest heat and mass transfer weld were 11.13 and 2.03 mm. With increasing heat and mass transfer, weld width increased 40.8% while height decreased just 6.9%. This suggests heat and mass transfer have a greater effect on weld width compared to height [Citation40].
Figure 8. Morphology and dimensions of the weld at different wire feed speeds.
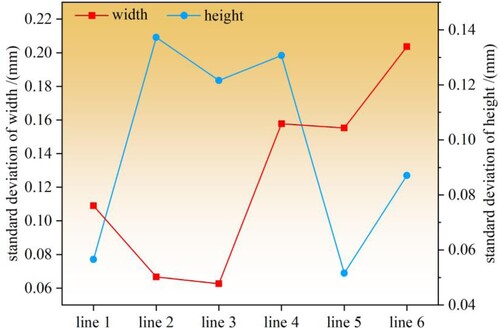
shows the standard deviations of measured primitive widths and heights, reflecting dimension stability and forming accuracy. Initially, increasing heat and mass transfer improved width stability, but higher levels decreased it. Primitive widths were more stable at low and high heat and mass transfers, with greater variability at intermediate levels. Primitive height stability exhibited the opposite trend, decreasing then increasing with heat and mass transfer. As higher transfers increased surface roughness [Citation41], primitives with lower heat and mass transfer are preferable for component forming. The weld-level experiments have revealed the relationship between thermal energy input and elemental size, serving as the foundation for selecting process parameters in the subsequent hierarchical testing.
Figure 9. Standard deviations of the weld dimensions at different wire feed speeds.
shows the mapping between wire feed speed and current-voltage for the experimental DED-Arc system. Substituting this into Equation 7 allowed predicting primitive width and height at different wire speeds (). Increasing wire speed decreased primitive height sensitivity to width, explaining improved height stability. Experimental and theoretical primitive dimensions agreed well, validating Equation 7 for elucidating the impact of parameters on primitive dimensions and accurately predicting them.
Figure 10. Trend of width and height variation of primitives at different wire feed speeds.
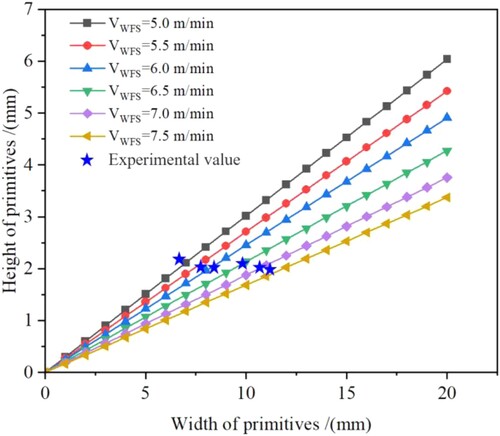
Table 4. The one-way mapping relationship between the wire feed speed and the current-voltage values.
In , the curves representing the width and height of the primitives extend infinitely upwards from the origin of the coordinate axis. This is because there are no constraints set for the dimensions of the primitives when establishing the Equation (7) based on thermal equilibrium. By setting constraints for the dimensions of the primitives, the width and height of the primitives can be determined for given process parameters. This provides a reference for selecting the process parameters for a DED-Arc component with different sizes and accuracy requirements, thereby achieving the desired effect of manufacturing parts according to specific needs.
displays the process parameters used this study, with Tsub representing the substrate surface temperature. By substituting the parameter values from into the respective equations, the width and height of the primitives can be calculated accordingly, as shown in .
Figure 11. Trend of theoretical and experimental values of the primitive dimensions with different wire feed speeds: (a) and (d) height and width of primitives based on circular arc model, (b) and (e) height and width of primitives based on parabola model, (e) and (f) height and width of primitives based on cosine curve model.
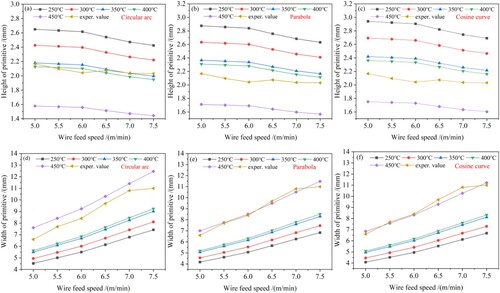
Table 5. Parameter values for the Equations in .
The predicted trends in primitive width and height agreed well with experimental values (), confirming the established model is reasonable and accurate. Deviation between theoretical and experimental values was smallest using a circular arc profile, indicating primitives in these process conditions have cross-sections most similar to a circular arc shape. To narrow down the range of , theoretical values of the height and width of the primitives are calculated and compared with the experimental values for
values of 250, 300, 350, 400 and 450°C, respectively. From , it can be observed that the theoretical values of the height and width of the primitives are closest to the experimental values when
is 350°C, while for
of 400°C, the theoretical values of the height and width of the primitives are smaller than the experimental values. This suggests that the substrate’s thermal equilibrium temperature is 350°C.
4.2. Overlapping and stacking path on layer-level
illustrates the morphology and cross-sectional profile of the layer-level parts fabricated using the process parameters of well-formed line 1 from section 4.1. The blue dashed line in indicates the location of the cross-sectional contour capture. These layer parts exhibit well-formed surfaces with no signs of poor adhesion defects. The region of continuous transition between the primitives appears relatively smooth, while the non-continuous transition region displays a ‘concave-convex’ morphology. In order to further quantify the surface quality and forming accuracy of these parts, Equations (18), (19), and (20) were used to calculate the root mean square deviation , the skewness value
, and the volume removal rate
of each layer, respectively. The results are presented in . The
values of the three layer-level parts with Zig-Zig stacking path are 0.139, 0.110, and 0.108 mm, and the
values are 0.035, 0.063, and 0.040, respectively. The
values of the other three parts with Zig-Zag stacking path are 0.119, 0.086, and 0.117 mm, and the
values are −0.562, −0.057, and −0.123, respectively. It can be observed that the
and
values on the surfaces of the two stacked path layer-level parts are relatively small, and do not change significantly with the offset distance increasing. This indicates that the surface quality of the layer parts is good, which is consistent with the observation results.
Figure 12. Geometry morphology and cross-sectional profiles of layer-level parts.
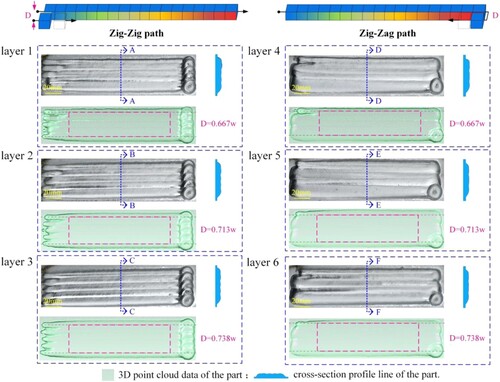
Table 6. quantitative results of layer-level part forming quality.
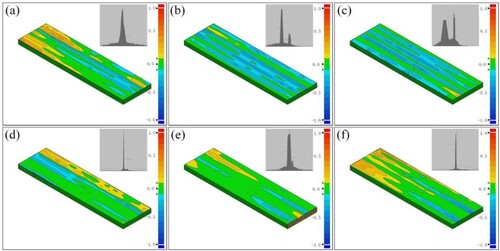
After performing Boolean subtraction on the layer components and their primitive models in , a size deviation chromatogram was obtained, as shown in . Among them, (a–c) correspond to layer 1, layer 2, and layer 3, respectively; (d–f) correspond to layer 4, layer 5, and layer 6, respectively. In , colour denotes deviation of layer part size from the model. As offset distance increased from 0.667w to 0.738w, the discontinuous transition region of Zig-Zig stacked layers exhibited substantially greater ‘concavity’ compared to Zig-Zag stacked layers.
Figure 13. Chromatogram depicting the layer-level parts obtained through a Boolean subtraction operation: (a)∼(b) represents layer 1, layer 2, and layer 3 with the Zig-Zig stacking path, while (d)∼(f) represents layer 4, layer 5, and layer 6 parts with the Zig-Zag stacking path.
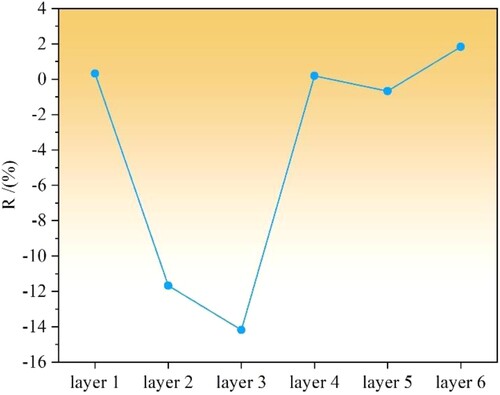
shows volume removal rates () for layer parts. Layers 1-3 are
values for Zig-Zig stacked layers, layers 4-6 are for Zig-Zag stacked layers. As offset distance
increased,
significantly decreased for Zig-Zig layers, indicating volume less than the model.
remained relatively constant for Zig-Zag layers. At the same offset distance,
was higher for Zig-Zag than Zig-Zig, reflecting superior forming precision with the Zig-Zag path. Both paths produced satisfactory surface quality from 0.667w to 0.738w offset distances. However, as distance increased, accuracy deteriorated more for Zig-Zig than Zig-Zag layers. Appropriate path selection can thus mitigate the impact of offset distance on forming precision. The layer-level additive manufacturing experiments revealed the influence of offset distance on the forming accuracy and established the range for selecting offset distance in the body-level additive manufacturing experiments.
Figure 14. Line graph of volume removal rate of layer-level parts.
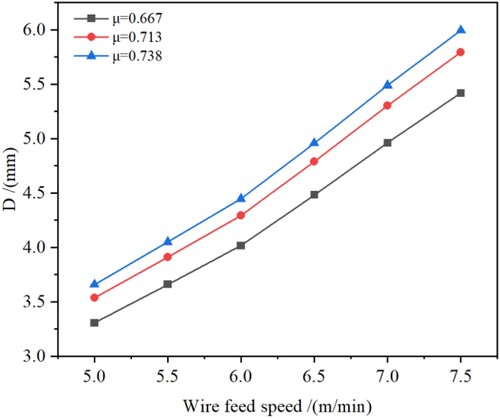
Characterisation of surface quality and forming accuracy showed both Zig-Zig and Zig-Zag paths produced good surface quality for layer-level components at 0.667w to 0.738w offset distances. However, Zig-Zag stacking yielded higher forming accuracy than Zig-Zig, which decreased rapidly with increasing offset distance. This accuracy difference primarily resulted from temperature variations induced by the stacking path on the substrate [Citation22]. The unidirectional multiple fillings of the Zig-Zig path cause lower temperature distribution continuity than the bidirectional Zig-Zag path. Larger offset distances increase likelihood of poor connections. Thus, appropriate offset distance selection is critical for high-quality forming. Based on the relationship between the offset distance and the primitive width [Citation30, Citation52], Equation (22) establishing the relationship between the offset distance and process parameters is derived from a theoretical perspective, providing a reference for determining the process parameters for additive manufacturing components of different widths. shows the variation trend of typical offset distance values with changes in the wire feed speed. The derivation process of Equation (22) is as follows:
Figure 15. The variation trend of typical offset distance values with changes in the wire feed speed.
i: Based on the relationship between the offset distance and the primitive width, it can be obtained that:
(21)
(21) where
is the proportion coefficient, with a value range of (0,1), and w is the primitive width.
ii: By combining Equations (12), (13) and (21) for the primitive with a circular arc shape cross-section, the equation relationship between the offset distance and process parameters can be obtained:
(22)
(22) From Equation (22), it can be observed that, when other parameters are consistent and
decreases, a smaller value of
is required to achieve optimal connections between discontinuous transitional primitives. This explains why the forming accuracy of the layer-level components using the Zig-Zig path is lower than that of the Zig-Zag path, and the forming accuracy significantly decreases with an increase in the offset distance.
4.3. Layer height on block-level formation
The fluidity of liquid metal is closely related to its viscosity and surface tension, with lower viscosity and surface tension resulting in better fluidity. The temperature plays a significant role in determining the viscosity and surface tension of the liquid metal, as higher temperatures lead to lower values for both [Citation42]. Previous research has demonstrated that with the increase of DED-Arc height, the heat accumulation becomes more prominent, resulting in higher temperature in the deposition layer [Citation10]. Excessively high temperature can lead to unstable flow of the molten pool, deteriorating the forming accuracy of the block-level part [Citation27]. Therefore, to achieve precise forming accuracy in DED-Arc, it is essential to investigate the relationship between primitive stacking height, temperature, and deposition layer height. To address this, a 130-layer block-level part was fabricated using DED-Arc, and the experimental results are shown in .
Figure 16. Experimental results of the 130-layers block height-layer height variation: (a) macroscopic appearance of the block; (b) widths of the primitive layer in the block; (c) heights of each layer in the block; (d) temperature curve of the block.
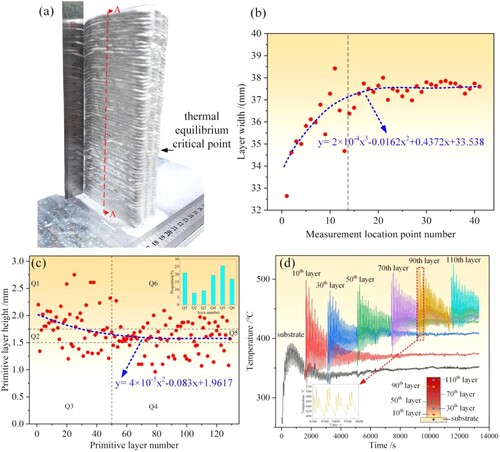
The fabricated block measured 210 mm height, 90 mm length, and 30 mm width ((a)). A 3D scanner reconstructed the block's shape model to quantify dimensions. The vertical cross-sectional profile of the block was captured at the A-A mark in (a), and the width of the block was measured at 5 mm intervals, as shown in (b). It can be observed from the fitted curve of the width variation in (b) that the width gradually increases and then stabilises in the region. Primitive layer heights were quantified from (c) and stratified into six regions: Q1 and Q6 (>1.75 mm), Q2 and Q5 (1.5-1.75 mm), and Q3 and Q4 (<1.5 mm). Comparing scatterplot distributions, layers 1-50 exhibited a maximum percentage in Q1 (20.9%) and minimum in Q2 (7.8%), while layers 51-130 showed a maximum in Q5 (25.6%) and minimum in Q6 (17.1%). These data demonstrate larger primitive layer heights exceeding 1.75 mm initially that decreased and stabilised between 1.5–1.75 mm in later additive manufacturing stages. The progressive reduction in layer height indicates optimisation of the fabrication process over time. This trend is consistent with the change trend of the fitting curve of the primitive layer height data (y = 4 × 10−5×2-0.0083x + 1.9617, x = 1∼130). The surface temperature field ranged 280–520°C during fabrication ((d)). Initial stages exhibited heat accumulation with input exceeding dissipation, yielding a continuous part temperature increase. This arose from low initial heat dissipation relative to constant heat input [Citation39]. In contrast to Zhao et al. [Citation10], who reported decreasing temperature gradients with deposition height, the present work found increasing gradients and dissipation due to rising part temperatures. Upon attaining thermal equilibrium where dissipation equaled input, temperature uniformity and consistent layer heights resulted [Citation39]. Temperature monitoring ((d)) showed equilibrium after 50-60 layers (88.2∼112.0 mm height) with stabilisation of the surface temperature field.
provides the parameter values for Equation 14. The welding voltage and current signals were acquired during fabrication using a data acquisition card and oscilloscope. The mean values of the waveform amplitudes were the welding voltage (11.6 V) and current (74 A).
Table 7. Parameter values used in equation (14).
According to references [Citation1, Citation40], the maximum temperature of the workpiece is assumed to be the melting point of the wire (560∼600°C), which is higher than the actual measured value of 500°C (as depicted in (d)). Considering the experimental error, it is reasonable to limit the highest temperature of the workpiece to be within 500∼600°C. As shown in (d), the substrate temperature is 350°C in thermal equilibrium. The cross-sectional area of the block is calculated to be 2.7 × 10⁻³ m3 based on measurements of its width and length. The values of other parameters in are constant and can be obtained by referring to literature [Citation27, Citation41]. By substituting the values of the parameters in into Equation (14), the range of the critical height
for thermal equilibrium of the block is determined to be 81.6∼138.3 mm, which coincides well with the range of experimental
values obtained from the experiments (88.2∼112.0 mm). This result confirms the reasonability of the previous discussion on the heat input and output during the additive manufacturing process of the block.
Equation 15's applicability was verified by substituting experimental block fabrication data () to obtain the theoretical torch lift height curve versus primitive layer number (). The calculated height variation showed similar decreasing then stable trends after thermal equilibrium as the empirical fit, conforming to experimental measurements of 1.25–2.75 mm in the decreasing range versus the predicted 1.57–2.18 mm. This validates Equation 15 for estimating the interlayer welding torch lift height.
Figure 17. Theoretical variation curve of the welding torch lifting height with the number of primitive layer increase.
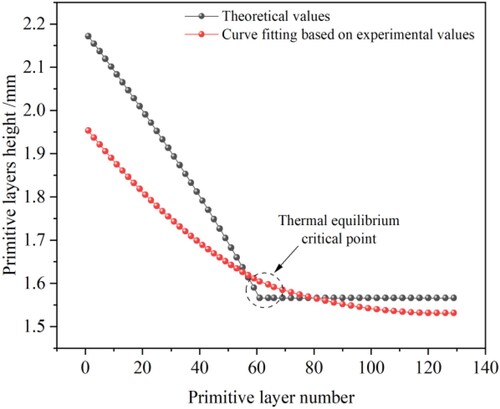
Table 8. Parameters used in the block additive manufacturing and partial test results.
4.4. In-order stacking of primitives on forming accuracy
In block-level DED-Arc, each primitive layer acts as the cladding base for the next layer. However, heat source constraints and nonuniform dissipation engender temperature variations along the cladding layer. These temperature differences during overlaying of new primitives yield size discrepancies that degrade part accuracy. Consequently, the primitive stacking path critically governs DED-Arc forming precision.
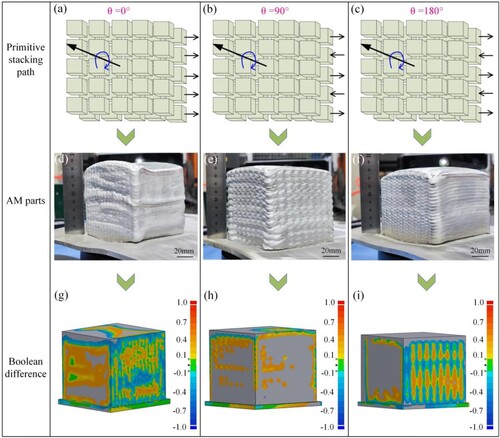
To examine the effect of primitive stacking path on block-level fabrication accuracy, three representative paths were designed (): 0° interlayer angle, 90° interlayer angle, and 180° interlayer angle. For clarity, the resulting block configurations are termed 0°, 90°, and 180° components based on the stacking angle. This nomenclature facilitates analysis of the relationship between build path and dimensional precision. The process parameters of well-formed Layer 1/Layer 4 from section 4.2 were utilised for additive manufacturing of the block-level components with the three stacking paths mentioned above. Primitive stacking sequences for the 0°, 90°, and 180° block configurations appear in (a–c), respectively, with corresponding as-built morphologies in 18d-f. Three-dimensional scanning and Boolean subtraction of the extracted dimensions from the preset model yielded the deviation heatmaps ((g–i)). The 90° component ((e)) exhibited the most regular shape with distinct edges/corners and no noticeable collapse. In contrast, the 0° geometry ((d)) showed poorer regularity with convex ends and a concave middle. The 180° configuration ((f)) displayed an intermediate regularity between the other two. Equation (20) presents the definition of the volume removal rate . This value also can be used to reflect the forming accuracy of the block-level component. The volume
of the block-level component in Equation (20) can be obtained using the method for calculating part volume mentioned in reference [Citation34]. The calculated
values for the three block-level components were −1.595%, −6.071%, and −17.686%, respectively. The negative deviation signifies the as-built block volume was less than the total deposited primitive volume. All blocks exhibited volume removal versus the primitives, with the 0° block having the smallest rate followed by the 90° and 180° configurations in order of increasing removal. These volume calculations align with the morphological observations and validate percent volume removal as a metric to assess fabrication accuracy.
Figure 18. The morphology of the block-level components and the results of Boolean subtraction.
The and
values on the top surface of these block components were calculated using Equations (18) and (19), respectively, and the results are presented in . The
and
values for the 0° block were 1.411 mm and −0.680, respectively, while for the 90° block they were 0.589 mm and −0.583. The
and
values for the 180° block were approximately equal in magnitude to those for the 90° block. It can be observed that the surface quality of the block components is lower than that of the original primitive layer. The
value for the 0° block increased by 915% (relative to 0.139 mm), and the
value increased by 1842% (relative to 0.035). The
value for the 180° block increased by 394% (relative to 0.119 mm), and the
value increased by 4% (relative to 0.562).
Table 9. The quantified results of the forming quality on the surface of the block-level component.
The above experimental results indicate that the stacking path of primitives has a significant influence on the forming accuracy of the components. Different stacking paths result in variations in forming accuracy among the components.
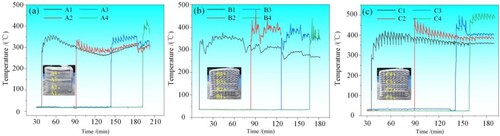
Surface temperature monitoring () revealed distinct trends for the three paths: 0° blocks showed the smallest range (300–380°C), 180° was the largest (400–500°C), and 90° was intermediate (340–400°C). The temperature variations aligned with the quantified accuracy results, suggesting a correlation between build temperature and fabrication precision. However, despite the lowest volume removal, the 0° path yielded poor surface quality. Similarly, the regular geometry of the 90° and 180° configurations could not compensate for their higher volume removal. Thus none qualified as well-formed components, indicating the need for an optimal path.
Figure 19. the temperature curves of the block-level components: (a) 0° block-level component, (b) 90° block-level component, (c) 180° block-level component.
Temperature profiles depended on stacking path, aligning with Da et al. [Citation19] who reported reduced heat input yielded taller but narrower parts. This dimensional change stems from altered molten pool fluid dynamics at higher temperatures. Compared to the 90° and 180° blocks, the 0° configuration necessitated multiple arc starts/stops that increased preform cooling time, decreased heat accumulation, and lowered temperature [Citation42]. Despite continuous deposition, the 90° block displayed more uniform temperatures, smaller local gradients, and greater molten pool stability versus the 180° configuration. This translated to improved accuracy, aligning with Wu et al. [Citation47] who showed interlayer temperature control enhances precision. The more consistent 90° thermal profile likely stems from reduced heat accumulation compared to the 180° path. These findings underscore the role of thermal management in optimising multi-layer additive fabrication.
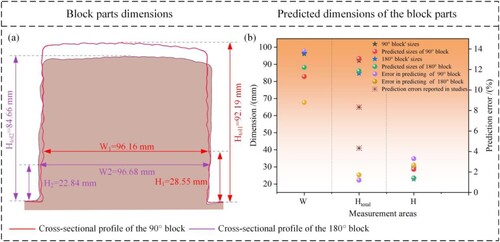
The study established a strong correlation between process parameters and component formation, providing crucial parameters for predicting primitive size, offset distance, and interlayer lift height in DED-Arc. Models such as linear regression analysis [Citation43], neural network models [Citation44–46] and mathematical analysis models [Citation47] based on experimental results have been utilised to predict weld bead dimensions. Although demonstrating high accuracy, prior models have limited applicability. Hu et al. [Citation48] used neural networks with process parameters to predict part dimensions, achieving height errors of 4.33–8.33%. We validated our model by predicting 90° and 180° block dimensions. (a) shows the cross-sections, while 20b presents the predicted values, measured dimensions, and errors. Height and critical height were accurately predicted with <4% error, less than Hu et al. Specifically, height errors were 1.2% and 1.7%, while width had larger errors of 13.8% and 8.8%. Nevertheless, these results showcase the capability of our model for predicting AM component geometry. Ongoing work will expand the model to a broader process space.
Figure 20. The predicted results of block dimensions: (a) cross-sectional profiles of the 90° and 180° blocks, (b) comparison of predicted values and prediction errors.
5. Conclusion
In this study, the concept of in-order stacking of primitives in DED-Arc was proposed for the first time. It investigates the impact of process parameters and primitive stacking path on the forming accuracy of the component and establishes a theoretical equation between process parameters and the essential parameters of the additive manufacturing process. The main conclusions are as follows:
Increasing the heat and mass transfer results in a significant increase in the width and surface roughness of the primitive. The average width increases from 6.59 mm to 11.17 mm, while the average height only decreases from 2.17 mm to 2.03 mm, which aligns well with the calculated results from the primitive dimension equations (5.50 to 9.02, 2.18 mm to 2.01 mm).
The influence of the offset distance on the forming accuracy of layer-level components varied for different stacking paths. When the offset distance increased from 0.667w to 0.738w, the volume removal rate
of the Zig-Zig path layer-level component increased from 0.31% to 14.18%, while the
Experimental and theoretical calculations both confirm the existence of a critical height for thermal equilibrium during the additive manufacturing process. The theoretical critical height ranges from 81.6 to 138.3 mm, while the experimental range is 88.2 to 112.0 mm. By establishing a relationship equation between the number of stacked layers and the height of each primitive layer, the lifting height between layers of the welding torch is accurately predicted to be rang of 1.57–2.18 mm.
The temperature of the preform significantly affected the accuracy and surface quality of parts. Although optimising heat and mass transfer could improve forming accuracy and surface quality, achieving high-quality component formation using a single stacking path (either Zig-Zig or Zig-Zag) was challenging.
The established model can effectively predict the geometric dimensions of the block components, with a prediction error of less than 4% for the part height and thermal equilibrium critical height.
6. Outlook
This study introduces the concept of in-order stacking of primitives and establishes a strong correlation between process parameters and primitive dimensions, thereby linking the weld-level, layer-level, and block-level components prepared in DED-Arc. A theoretical expression is developed to determine part forming through process parameters. The influence of the stacking path of primitives on the forming accuracy of the workpiece was initially investigated, confirming the applicability of the proposed theoretical equation. The current models used to predict the width and height of the elementary unit are based on the assumption of one-dimensional heat transfer. However, experimental findings at a larger scale suggest that once the height of the additive material exceeds a certain threshold, the dissipation of heat through convection and radiation becomes significant and cannot be ignored. This clearly demonstrates the limitations of the one-dimensional heat transfer model. In our future research, we will focus on exploring the utilisation of three-dimensional heat transfer models as an optimised approach to predict the dimensions of the elementary unit. Such an approach will provide greater adaptability to real-world conditions. Additionally, we will work on optimising the relationship between the established process parameters and forming quality and dive deeper into the effects of the stacking path of primitives on the precision of DED-Arc. By meticulously designing and optimising the stacking path of primitives, our goal is to enhance the accuracy of forming the workpiece and achieve high-precision shaping of complex structural components.
Disclosure statement
No potential conflict of interest was reported by the author(s).
Data availability
The data that support the findings of this study are available on request from the corresponding author, [Z.Y. Y.].
Additional information
Funding
References
- Ding J, Colegrove P, Mehnen J, et al. Thermo-mechanical analysis of Wire and Arc Additive Layer Manufacturing process on large multi-layer parts. Comput Mater Sci. 2011;50(12):3315–3322. doi:10.1016/j.commatsci.2011.06.023
- Herzog D, Seyda V, Wycisk E, et al. Additive manufacturing of metals. Acta Mater. 2016;117:371–392. doi:10.1016/j.actamat.2016.07.019
- Queguineur A, Rückert G, Cortial F, et al. Evaluation of wire arc additive manufacturing for large-sized components in naval applications. Weld World. 2018;62:259–266. doi:10.1007/s40194-017-0536-8
- Chen S, Zhang Y, Feng Z. Arc welding processes for additive manufacturing: a review. In: Transactions on intelligent welding manufacturing. Singapore: Springer Singapore Pte. Limited; 2017. p. 3–24.
- Joshi S, Sheikh A. 3D printing in aerospace and its long-term sustainability. Virtual Phys Prototyp. 2015;10:175–185. doi:10.1080/17452759.2015.1111519
- Derekar KS. A review of wire arc additive manufacturing and advances in wire arc additive manufacturing of aluminium. Mater Sci Technol. 2018;34(8):895–916. doi:10.1080/02670836.2018.1455012
- Sinha K, Pramanik A, Yagati S, et al. Research progress in arc based additive manufacturing of aluminium alloys – A review. Measurement ( Mahwah N J). 2022;200:111672. doi:10.1016/j.measurement.2022.111672.
- Huang L, Chen X, Konovalov S, et al. A review of challenges for wire and Arc additive manufacturing (WAAM). Trans Indian Inst Metals. 2023. doi:10.1007/s12666-022-02823-y
- Rodrigues TA, Duarte V, Miranda RM, et al. Current status and perspectives on wire and Arc additive manufacturing (WAAM). Materials (Basel). 2019;12:1121. doi:10.3390/ma12071121
- Zhao H, Zhang G, Yin Z, et al. A 3D dynamic analysis of thermal behavior during single-pass multi-layer weld-based rapid prototyping. J Mater Process Technol. 2011;211(3):488–495. doi:10.1016/j.jmatprotec.2010.11.002
- Zhao Y, Jia Y, Chen S, et al. Process planning strategy for wire-arc additive manufacturing: Thermal behavior considerations. Addit Manuf. 2020;32:100935. doi:10.1016/j.addma.2019.100935
- Chen X, Kong F, Fu Y, et al. A review on wire-arc additive manufacturing: typical defects, detection approaches, and multisensor data fusion-based model. Int J Adv Manuf Technol. 2021;117(3-4):707–727. doi:10.1007/s00170-021-07807-8
- Singh S, Sharma SK, Rathod DW. A review on process planning strategies and challenges of WAAM. Mater Today: Proc. 2021;47:6564–6575. doi:10.1016/j.matpr.2021.02.632
- Tomar B, Shiva S, Nath T. A review on wire arc additive manufacturing: processing parameters, defects, quality improvement and recent advances. Mater Today Commun. 2022;31:103739. doi:10.1016/j.mtcomm.2022.103739
- Xiong J, Yin Z, Zhang W. Closed-loop control of variable layer width for thin-walled parts in wire and arc additive manufacturing. J Mater Process Technol. 2016;233:100–106. doi:10.1016/j.jmatprotec.2016.02.021
- Xiong J, Yu Y, Zheng S, et al. Arc voltage measurements for height control in pulsed arc additive manufacturing. Measurement ( Mahwah N J). 2022;191:110867. doi:10.1016/j.measurement.2022.110867
- Li Y, Huang X, Horváth I, et al. GMAW-based additive manufacturing of inclined multi-layer multi-bead parts with flat-position deposition. J Mater Process Technol. 2018a;262:359–371. doi:10.1016/j.jmatprotec.2018.07.010
- Li Y, Sun Y, Han Q, et al. Enhanced beads overlapping model for wire and arc additive manufacturing of multi-layer multi-bead metallic parts. J Mater Process Technol. 2018b;252:838–848. doi:10.1016/j.jmatprotec.2017.10.017
- Da Silva LJ, Souza DM, de Araújo DB, et al. Concept and validation of an active cooling technique to mitigate heat accumulation in WAAM. Int J Adv Manuf Technol. 2020;107(5-6):2513–2523. doi:10.1007/s00170-020-05201-4
- Heinrich L, Feldhausen T, Saleeby K, et al. Build plate conduction cooling for thermal management of wire arc additive manufactured components. Int J Adv Manuf Technol. 2023;124(5):1557–1567. doi:10.1007/s00170-022-10558-9
- Alhakeem MM, Mollamahmutoglu M, Yilmaz O, et al. A deposition strategy for wire Arc additive manufacturing based on temperature variance analysis to minimize overflow and distortion. J Manuf Process. 2023;85:1208–1220. doi:10.1016/j.jmapro.2022.11.006
- Amal MS, Justus Panicker CT, Senthilkumar V. Simulation of wire arc additive manufacturing to find out the optimal path planning strategy. Mater Today: Proc. 2022;66:2405–2410. doi:10.1016/j.matpr.2022.06.338
- Zhou Z., Shen H., Liu B., et al. Thermal field prediction for welding paths in multi-layer gas metal arc welding-based additive manufacturing: a machine learning approach. J Manuf Process. 2021;64:960–971. doi:10.1016/j.jmapro.2021.02.033
- Zhou Z, Shen H, Lin J, et al. Continuous tool-path planning for optimizing thermo-mechanical properties in wire-arc additive manufacturing: an evolutional method. J Manuf Process. 2022;83:354–373. doi:10.1016/j.jmapro.2022.09.009
- Gao Z, Li Y, Shi H, et al. Microstructure characteristics under varying solidification parameters in different zones during CMT arc additive manufacturing process of 2319 aluminum alloy. Vacuum. 2023;214:112177. doi:10.1016/j.vacuum.2023.112177.
- Wei Y, Liu F, Liu F, et al. Effect of arc oscillation on porosity and mechanical properties of 2319 aluminum alloy fabricated by CMT-wire arc additive manufacturing. J Mater Res Technol. 2023;24:3477–3490. doi:10.1016/j.jmrt.2023.03.203.
- Sun L, Ren X, He J, et al. A bead sequence-driven deposition pattern evaluation criterion for lowering residual stresses in additive manufacturing. Addit Manuf. 2021;48:102424. doi:10.1016/j.addma.2021.102424.
- Liu M, Yi H, Cao H, et al. Heat accumulation effect in metal droplet-based 3D printing: evolution mechanism and elimination Strategy. Addit Manuf. 2021;48:102413. doi:10.1016/j.addma.2021.102413
- Oliveira JP, Santos TG, Miranda RM. Revisiting fundamental welding concepts to improve additive manufacturing: from theory to practice. Prog Mater Sci. 2020;107:100590. doi:10.1016/j.pmatsci.2019.100590
- Limousin M, Manokruang S, Vignat F, et al. Effect of temperature and substrate geometry on single aluminium weld bead geometry deposited by wire arc additive manufacturing: proposition of an experimental procedure. CIRP J Manuf Sci Technol. 2023;45:61–68. doi:10.1016/j.cirpj.2023.06.010.
- Banaee SA, Kapil A, Marefat F, et al. Generalised overlapping model for multi-material wire arc additive manufacturing (WAAM). Virtual Phys Prototyp. 2023;18(1). doi:10.1080/17452759.2023.2210541
- Fang X, Bai H, Yao Y, et al. Research on multi-bead overlapping process of wire and Arc additive manufacturing based on cold metal transfer. Jixie Gongcheng Xuebao/J Mech Eng. 2020;56(1):141–147. doi:10.3901/JME.2020.01.141
- Ding D, Pan Z, Cuiuri D, et al. A multi-bead overlapping model for robotic wire and arc additive manufacturing (WAAM). Robot Comput Integr Manuf. 2015;31:101–110. doi:10.1016/j.rcim.2014.08.008
- Suryakumar S, Karunakaran KP, Bernard A, et al. Weld bead modeling and process optimization in Hybrid Layered Manufacturing. Comput Aided Des. 2011;43(4):331–344. doi:10.1016/j.cad.2011.01.006.
- Yang D, Wang X, Wang Y, et al. Surface quality evaluation of multi-bead overlapping for high nitrogen steel by CMT based additive manufacturing. Hanjie Xuebao/Trans China Weld Inst. 2020;41(4):73–76. doi:10.12073/j.hjxb.20190914002
- Zhang C, Chen TH, IEEE, IEEE. Efficient feature extraction for 2D/3D objects in mesh representation. 2001 International Conference on Image Processing, Vol III, Proceedings. 2001. 935–938. doi:10.1109/ICIP.2001.958278
- Fu J, Qiu K, Gong L, et al. Effect of tool-path on morphology and mechanical properties of Ti-6Al-4V fabricated by wire and Arc additive manufacturing. MATEC Web Conf. 2017;128:05009. doi:10.1051/matecconf/201712805009
- Nguyen L, Buhl J, Bambach M. Multi-bead overlapping models for tool path generation in wire-arc additive manufacturing processes. Procedia Manuf. 2020;47:1123–1128. doi:10.1016/j.promfg.2020.04.129
- Rauch M, Nwankpa UV, Hascoet J. Investigation of deposition strategy on wire and arc additive manufacturing of aluminium components. J Adv Join Process. 2021;4:100074. doi:10.1016/j.jajp.2021.100074
- Pathak D, Pratap Singh R, Gaur S, et al. To study the influence of process parameters on weld bead geometry in shielded metal arc welding. Mater Today: Proc. 2021;44:39–44. doi:10.1016/j.matpr.2020.06.164
- Li W, Zhang H, Wang G, et al. Deep learning based online metallic surface defect detection method for wire and arc additive manufacturing. Robot Comput Integr Manuf. 2023;80:102470. doi:10.1016/j.rcim.2022.102470
- Lin Q, Zeng C, Cao R, et al. The spreading simulation of molten Al alloy on Q235 steel in the first cycle of cold metal transfer process. Int J Heat Mass Transf. 2016;96:118–124. doi:10.1016/j.ijheatmasstransfer.2016.01.002
- Montevecchi F, Venturini G, Grossi N, et al. Idle time selection for wire-arc additive manufacturing: a finite element-based technique. Addit Manuf. 2018;21:479–486. doi:10.1016/j.addma.2018.01.007
- Du J, Wei Z. Numerical analysis of pileup process in metal microdroplet deposition manufacture. Int J Therm Sci. 2015;96:35–44. doi:10.1016/j.ijthermalsci.2015.04.016
- Fang M, Chandra S, Park CB. Experiments on remelting and solidification of molten metal droplets deposited in vertical columns. J Manuf Sci Eng. 2007;129(2):311–318. doi:10.1115/1.2540630
- Zhang Y, Jing H, Xu L, et al. Effects of different scanning patterns on nickel alloy-directed energy deposition based on thermal analysis. Virtual Phys Prototyp. 2021;16(sup1):S98–S115. doi:10.1080/17452759.2021.1896173
- Wu B, Pan Z, Ding D, et al. The effects of forced interpass cooling on the material properties of wire arc additively manufactured Ti6Al4V alloy. J Mater Process Technol. 2018;258:97–105. doi:10.1016/j.jmatprotec.2018.03.024
- Cao H, Huang R, Yi H, et al. Asymmetric molten pool morphology in wire-arc directed energy deposition: evolution mechanism and suppression strategy. Addit Manuf. 2022;59:103113. doi:10.1016/j.addma.2022.103113
- Nalajam PK, Varadarajan R. Experimental and theoretical investigations on cold metal transfer welds using neural networks: a computational model of weld geometry. Exp Tech. 2021;45(6):705–720. doi:10.1007/s40799-021-00451-7
- Venkata Rao K, Parimi S, Suvarna Raju L, et al. Modelling and optimization of weld bead geometry in robotic gas metal arc-based additive manufacturing using machine learning, finite-element modelling and graph theory and matrix approach. Soft Comput. 2022;26(7):3385–3399. doi:10.1007/s00500-022-06749-x
- Wang Z, Zimmer-Chevret S, Léonard F, et al. Prediction of bead geometry with consideration of interlayer temperature effect for CMT-based wire-arc additive manufacturing. Weld World. 2021;65(12):2255–2266. doi:10.1007/s40194-021-01192-2
- Pratap Singh V, Dahiya K, Khanna P. Mathematical analysis of effect of process parameters on weld bead geometry of MIG welded low carbon steel plates. Mater Today: Proc. 2022;56:655–660. doi:10.1016/j.matpr.2022.01.022
- Hu Z, Qin X, Li Y, et al. Welding parameters prediction for arbitrary layer height in robotic wire and arc additive manufacturing. J Mech Sci Technol. 2020;34(4):1683–1695. doi:10.1007/s12206-020-0331-0