
 ?Mathematical formulae have been encoded as MathML and are displayed in this HTML version using MathJax in order to improve their display. Uncheck the box to turn MathJax off. This feature requires Javascript. Click on a formula to zoom.
ABSTRACT
The laser power bed fusion (LPBF) forming process introduces heat accumulation and variations in powder layer thickness, which can destabilize the melt track and reduce surface quality. This phenomenon is especially more serious in the early printing stage. To tackle this stability problem, we proposed a novel approach optimizing process parameters on a layer-specific basis. At first, a numerical database was constructed through a set of numerical simulations. Then, a neural network prediction model was trained based on the database. Finally, this prediction model was embedded into a genetic algorithm for layer-based prediction. To verify the prediction results on processing parameters and calibrate the prediction model, physical experiments were prepared. The developed model consistently exhibited relative errors mostly within 6%. It is noteworthy that the relative errors between the numerical simulation results and the expected values were only 0.77% in width and 1.11% in depth. Printing optimization test was applied for an LPBF machine with a Invar alloy powder. The proposed method yielded positive results in both numerical simulations and the printing test. It can be further adopted for new material printing parameter optimization due to an efficient printing stability in the early-stage for LPBF process.
1. Introduction
Laser power bed fusion (LPBF) technology is a highly promising branch of additive manufacturing. It offers the advantage of directly producing solid components with high density, high precision, and complex structures. The LPBF process involves melting and solidifying metal powder layer by layer using a laser beam, guided by CAD data [Citation1, Citation2]. However, due to the complex metallurgical nature of LPBF, various defects, such as the ‘balling effect’, thermal cracks, and warpage, may occur under inappropriate processing conditions [Citation3], especially in the multi-material AM process [Citation4, Citation5]. In order to achieve high-quality LPBF parts, numerous researchers have focused on improving densification and addressing issues related to surface quality. Several approaches have been employed, including optimizing process parameters [Citation6, Citation7], utilizing special scanning strategies [Citation8, Citation9], and remelting surfaces with poor quality using specific parameters [Citation10]. At the micro level, grain refinement [Citation11] and the doping of the nanostructured additives [Citation12] are also two effective research directions for improving the feasibility of forming and the performance of the formed part.
In studying the quality of the formed parts, the layer-by-layer printing process inevitably involves the heat accumulation effect. At the beginning of each laser pass, the size and temperature of the melt track are initially small. However, as the laser moves, the melt track gradually increases in size and reaches a pseudo-steady state after a certain number of steps [Citation13]. Nevertheless, it cannot maintain a stable state. Due to the insufficient time available in the printing process for each track and layer to return to ambient temperature, the residual heat from the previous step may impact the subsequent step [Citation14], resulting in a heat accumulation effect. For the current layer, this residual heat can to some extent be beneficial for improving the in-situ alloying [Citation15], and the preheating of the powder layer is also beneficial for reducing residual stress [Citation16]. But as the deposition layer increases, the dominance of convection/radiation heat loss over heat transfer loss causes more severe heat accumulation [Citation17]. Consequently, the temperature and size of the melt track during the printing process are higher and bigger. Tang et al. [Citation18] conducted numerical simulations using a point exposure printing strategy to investigate the heat accumulation issue before and after exposure points. They discovered that the heat accumulation effect decreases as exposure time increases for different exposure durations. Li et al. [Citation19, Citation20] observed that in the same layer, the heat generated by the preceding channel elevates the printing temperature of the following channel. Shi [Citation21] developed a three-dimensional finite element model and determined there was a heat accumulation effect between different layers, resulting in a larger size of the melt track in the subsequent layer compared to the previous layer.
The instability of the melt track caused by the accumulation of heat during the early printing stage cannot guarantee the quality of the bottom layer printing. For complex structures such as suspended structures and thin-walled structures, unstable bottom layers can easily lead to defects such as surface powder sticking or warping deformation in the final structure. Usually, researchers choose to add support to solve the problem, but for complex inner cavity structures, it is difficult to clean the support after printing. And currently, a variety of machine learning algorithms and optimization methods play a significant role in the design and process optimization of additive manufacturing [Citation22]. These applications range from image recognition during in-situ monitoring to the optimization of process parameters during printing, and even to the prediction of defects in formed parts [Citation23], covering every stage of the process [Citation24]. Cheng et al. [Citation25] have established a machine learning-based framework to optimize process parameters, and used these optimized parameters to print Ti6Al4V material, significantly improving the ultimate tensile strength of the samples. Huang et al. [Citation24] involves applying machine learning algorithms to image recognition to predict the number of cells in a single droplet, achieving an accuracy rate of 80% using a random forest regression algorithm. In previous work, artificial neural network models trained on experimental datasets have been used for quality classification of porous structures produced by LPBF printing. This method can also be applied to other additive manufacturing processes for quality prediction, thus optimizing the printing process [Citation26].
Therefore, this article proposes a layer-by-layer optimization method in the early printing stage, utilizing the prediction and optimization capabilities of GA-BP neural network to ensure the printing stability of the initial layer and effectively solve the adverse effects caused by thermal effects in the LPBF manufacturing process.
2. Proposed method
2.1. Optimization method for process parameters layer by layer
As the LPBF process develops, a lack of change in process parameters leads to a reduction in energy loss through conduction [Citation17]. This reduction allows the heat stored in the previous layer to have a significant impact on the next processing layer. Thus, studying the heat accumulation effect and optimizing the process are crucial for achieving better quality LPBF parts.
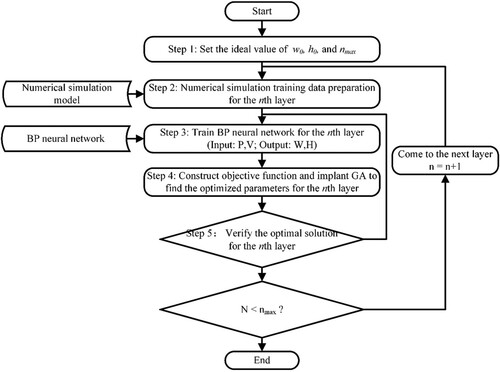
For this study, laser power and scanning speed were chosen as the variables for optimization, as they are two key factors that affect the temperature and size of the melt track. The existing optimization approach for the LPBF process primarily relies on many trial-and-error experiments. However, this method poses drawbacks such as a tedious experimental workload, low accuracy, and high consumption of human and material resources. Additionally, the quality of LPBF printed parts is influenced by multiple factors, and the physical and mathematical relationships between these factors are not fully understood. Describing the various nonlinear influencing relationships accurately and obtaining the best process parameters with precision using mathematical expressions is challenging [Citation27]. To address these challenges, this research adopted the combination of the Genetic Algorithm (GA) and the Back-propagation (BP) neural network. The GA facilitates global search and optimization, while the BP neural network enables accurate prediction and become an effective alternative model [Citation23, Citation24, Citation28]. By integrating these two techniques, the optimization of process parameters can be achieved without a large number of experiments or with only a limited number of them, resulting in a significant reduction in the cost and effort associated with exploring process parameters. The research framework of this paper is presented in . The workflow is described in detail as follows:
Step 1: Determine the optimization variables of the process parameters and set the target value of the objective variables. In this study, the optimization variables are the laser power (P) and the scanning speed (V), while the objective variables are the width (W) and depth (H) of the melt track. Other parameters such as hatch spacing or layer thickness have significant effect on the process optimization [Citation29], however, in this study, to simplify the optimize problem, the target value of W and H of the melt track in every layer keep the same to achieve a steady melting process. Due to this strategy, the hatch spacing and layer thickness keep the same and are not selected as the optimization variables.
Step 2: Use the numerical simulation model to simulate the LPBF process with different process parameters for the nth layer, and prepare the training data set. The process parameters before the nth layer are the optimized parameters obtained from Step 4.
Step 3: Establish and train BP neural network for the nth layer. P and V are used as the input variables for the neural network training model, while the corresponding W and H of the melt track serve as the output.
Step 4: Construct objective function and implant Genetic Algorithm (GA) to find the optimized solution for the nth layer. Use a population of process parameters as input and the ideal melt track size as the target, then employ GA to achieve optimization to output optimal process parameters after multiple population reproduction.
Step 5: Bring the optimal process parameters output from Step 4 into simulation and experimental verification. If the error is too large, return to Step 3 for retraining.
Figure 1. .#Workflow of the proposed method.
2.2. Numerical simulation model and simulation setup
2.2.1. Physical model and boundary condition
As mentioned by Loh et al. [Citation30], the governing equation for heat transfer in this nonlinear transient process is given as follows:
(1)
(1) where t and T are the time and temperature, ρ is the material density, c is the specific heat capacity, k is the thermal conductivity, and Q is heat generated per unit volume.
The initial temperature distribution in the powder bed at t = 0 can be defined as
(2)
(2) In the region of laser action, the main forms of thermal energy loss are thermal convection and thermal radiation [Citation32]. The boundary conditions considering the influence of heat sources can be expressed as formula (Equation3
(3)
(3) ), which is ultimately loaded into the boundary conditions through convection [Citation33].
(3)
(3) where T0 is the ambient temperature; ϵ is the emissivity; σ is the Stefan–Boltzmann constant, q is the laser heat source, qc and qr are the heat convection and radiation, respectively.
2.2.2. Finite element model
The thermal behavior of the LPBF process was simulated numerically using ANSYS Mechanical APDL 2021 software. The finite element model established in ANSYS was illustrated in . The Invar alloy powder bed had dimensions of 0.6 × 0.6 × 0.24 mm. The laser scanning processing area measured 0.36 × 0.36 mm, with each layer having a thickness of 0.03 mm. The substrate material chosen for the simulation was 316L stainless steel, which had a size of 0.9 × 0.9 × 1 mm. As shown in (c), the laser beam moved in a ‘Zigzag’ pattern with 90° interlayer rotation. The process parameters of finite element simulation are listed in .
Figure 2. (a, b) The FE model of the multi-layer LPBF process and (c) laser scanning pattern during.
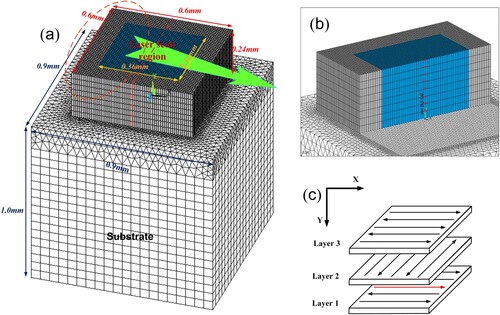
Figure 3. BP neural network model.
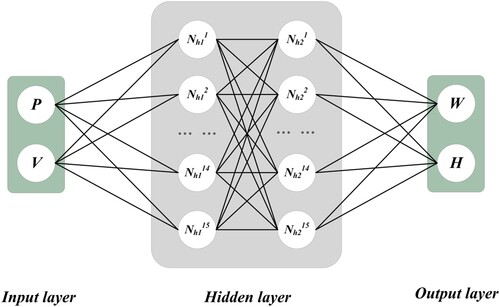
Table 1. Finite element simulation process parameters.
2.2.3. Gaussian heat source model
A moving Gaussian cone rotating body heat source was applied to simulate the energy of laser beam. Mathematically, the representation of this heat source is as follows [Citation34]:
(4)
(4) where P is the laser power, r is the radius of the laser spot, h is the thickness of each layer of mineral powder, n is the concentration coefficient of energy, which is usually selected as 2, A is the absorption coefficient of laser energy of the material, and its value is 0.7.
In the rapid melting and solidification process of powder and solid, the latent heat of phase transition caused by the mutual transformation between the solid and liquid phases of the material can easily disrupt the final temperature field distribution, resulting in unstable morphology and size of the melt track. Enthalpy was expressed as EquationEquation (5)(5)
(5) to define the latent heat [Citation35].
(5)
(5) where ρ is the material density, c is the specific heat capacity, and T is the temperature.
2.2.4. Thermal parameters
The thermal conductivity of the powder layer is significantly lower than that of the solid body, and its mechanism is complex. Studies have shown that the porosity, solid volume fraction, and particle size of the powder affect its thermal conductivity [Citation36]. The effective thermal conductivity of LPBF metal powder can generally be described using the following formula [Citation36]:
(6)
(6)
(7)
(7) where Kp and Ks are the thermal conductivity of powder material and solid material respectively, Φ is the porosity of powder, ρs and ρp are the density of solid material and powder material respectively. The material parameters of Invar alloy are shown in . The thermal conductivity K and specific heat capacity c used in the model are summarized in .
Table 2. Material parameters of solid Invar.
Table 3. Thermal property parameters of solid Invar.
2.3. BP neural network and training setup
In this study, BP neural network was employed to establish a model for predicting the width and depth of the melt track based on layer index, laser power and scanning speed. As shown in , the BP neural network included 2 input neurons, while the output had 2 neurons. Additionally, two hidden layers comprised of 15 and 15 neurons with a ReLU transfer function. The input neurons consisted of laser power (P) and scanning speed (V), while the output neurons represented the width (W) and depth (H) of the melt track. The BP neural network was training for each layer. For every layer, the numerical simulation generated 54 sets of results, which were divided into three groups: 40 sets for training the BP neural network, 8 sets for testing purposes, and 6 sets for verifying. The number of iterations was set to 500. Since there are no extreme values in the input data, the sample data were normalized to enhance training capabilities and expedite network convergence.
2.4. Layer by layer parameters optimization problem and GA solving setup
The goal of this section is to determine appropriate process parameters for each layer. To ensure the stability of the melting process, we aim for consistency in the width and depth of each layer’s melt track. The mathematical formulation of the optimization problem reads as follows:
(8)
(8)
where, Wf and Hf are the objective functions, representing the absolute differences between the current melt track sizes (W,H) and the ideal melt track sizes (w0, h0), n is the specified number of optimization layers and nmax is the maximum index of the layer needed to be optimized. BPNNn is the training BP neural network model of the nth layer. P and V represent the laser power and scanning speed, respectively, where
, and
. In this study, the process parameters were optimized within the input range of 95–170 W for P and 400–1200 mm/s for V.
Then, GA was employed to achieve optimization to output optimal process parameters after multiple population reproduction. To simplify the multiple objectives optimization problem, the weighted sum of squared relative errors between the width and depth is chosen as the objective function, as described in EquationEquation (9)(9)
(9) . The population for the GA is set to 50, and the maximum number of iterations is 200.
(9)
(9) where ω1 and ω2 were the weights of the two targets, respectively. W and H were the outputs of the neural network; w0 and h0 were the ideal width and depth of the melt track. According to our previous practice, this study determined desired values of w0 = 95 μm for the width and h0 = 45 μm for the depth of the melt track.
3. Evaluation of numerical model and BP neural network
3.1. Analysis and evaluation of the numerical simulation model
To evaluate the accurate of the numerical simulation model, ten single tracks with different processing parameters (see ) were simulated using the same model shown in . For this simulation, only the first layer was activated and the red line segment had been added with a moving Gaussian heat source. Then, the samples were printed using a commercial LPBF machine (Ti150, Profeta, China) with three times. This machine was equipped with a IPG fiber laser operating at a continuous wavelength of 1064 nm. The maximum laser power was 200 W, and it had a spot radius of 50 μm. The experiment employed Invar alloy powder with a spherical shape and an average particle size ranging from 15 to 53 μm. The width of the melt tracks in the single-track experiments was measured using a PMG3 optical microscopy, and the width of each melt track was measured six times (as shown in (b)). (a) describes the printing results of the single tracks. The single tracks with different parameters were labeled with 1, 2, 3, … , 10, and the single tracks with the same parameters were labeled with A, B, C.
Figure 4. (a) Invar alloy LPBF single pass scanning forming sample diagram. (b) The 16th group of samples melt track morphology.
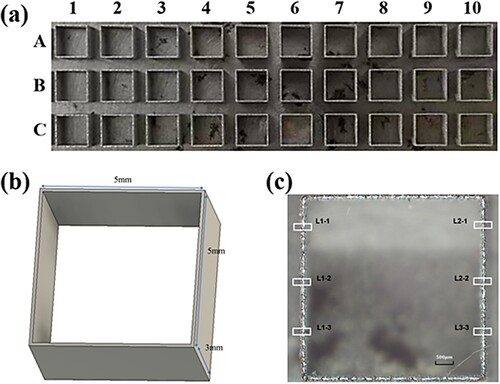
Table 4. Laser processing parameters for single tracks simulation and printing.
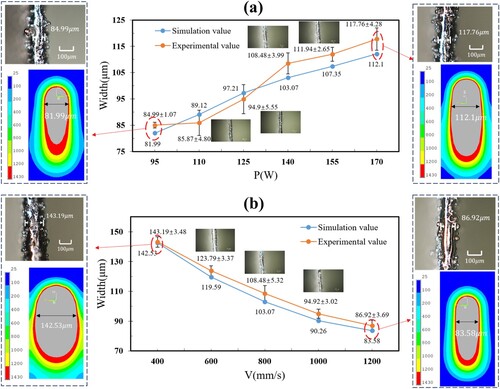
illustrates the significant differences in the macroscopic morphology and width of the melt track among single-track samples processed at varying laser powers and scanning speeds, with experimental values of the melt track width aligning closely with the simulated values. The power and scanning speed of the laser significantly affect the width of the melt track in the test piece. Therefore, we believe that power and speed have a clear relationship with the morphology of the melt track, and it is reasonable to be the object of algorithm optimization.
Figure 5. Numerical simulation and experimental values of the width of the melt track of stabilized working layer during LPBF of Invar alloy power process using different laser power (V = 800 mm/s) (a) and scanning speed (P = 140 W) (b).
3.2. Analysis and evaluation of the BP neural network
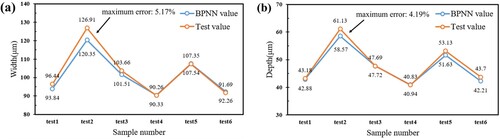
The final loss result is depicted in and the training results are illustrated in . The neural network output values closely corresponded with the actual sample values. Subsequently, the trained neural network was evaluated using six sets of verification samples. The resulting output values from the melt track width and depth were inversely normalized and compared with the actual numerical simulation values, which were presented in . The figure illustrates that the relative error between the predicted values from the neural network and the actual sample values was within 6%. Consequently, the above-mentioned method successfully established a neural network capable of capturing the mapping relationship between the width and depth of the melt track and the main process parameters. This, in turn, validated the accuracy and reliability of the network model.
Figure 6. The loss curve of neural network.
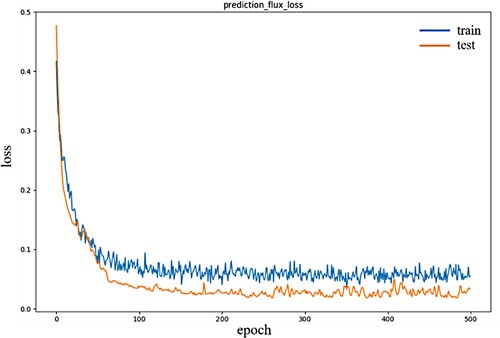
Figure 7. Sample value and BP neural network output value.
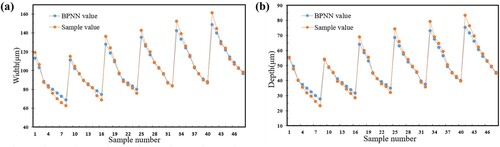
Figure 8. Test value and BP neural network output value.
4. Results and discussions
4.1. Layer-by-layer process parameters optimization results
According to the workflow of the layer-by-layer optimization method, firstly, we determined desired values of 95 μm for the width and 45 μm for the depth of the melt track. The maximum layer number is 10. The selection of these parameters was based on our previous practice. Secondly, numerical simulations were conducted and 54 data sets including the laser power P, scanning speed V, width W and depth H for the first layer were obtained. Thirdly, BP neural network was used here to establish the map between process parameters (P, V) and melt track size (W, H). Then, the GA was iterated 200 times, obtaining optimal process parameters after inverse normalization. As shown in , for the first layer, the GA obtained optimal process parameters of 148 W and 905 mm/s. The BP neural network predicted a melt track width and depth of 98.77 and 47.25 μm, respectively. Finally, the optimization process was repeated until the process parameters for all 10 layers are optimized. The process parameters of the previous layer were set as the optimized parameters, and the BP neural network was retrained. All of the optimized results of different layers are listed in .
Table 5. Layer-by-layer optimization results.
To verify the accuracy of the prediction results, numerical simulations were conducted using the same process parameters. For the first layer, the simulation yielded a melt track width and depth of 99.54 and 46.73 μm, respectively, with error rates of 0.77 and 1.11% compared to the desired values. The small error rates demonstrated the feasibility of the selected process parameter method, although some improvements are still necessary. The main factor contributing to the errors was the limited number of samples.
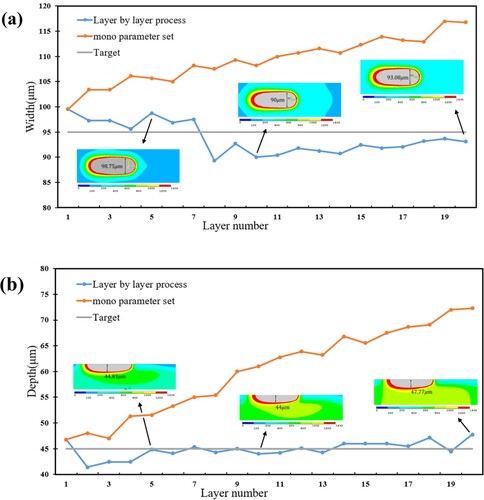
For comparison, numerical simulations were conducted using the mono process parameters set (P = 148 W, V = 905 mm/s). As mentioned above, the size of the melt track continued to increase due to heat accumulation, rendering the current process parameters unsuitable. As shown in , using the mono process parameters could not solve the problem of upward heat accumulation, and we found that the degree of heat accumulation varies with different energy inputs, with the number of layers where heat accumulation tends to stabilize exceeding 20. However, the layer-by-layer optimized melt track could maintain a certain degree of stability.
Figure 9. Comparison between layer-by-layer optimized process parameters and mono process parameters.
4.2. Experiment validation
In multi-layer experiments, illustrated in , we employed four boxes of varying heights (0.09, 0.3, 0.9, and 9 mm) and used five sets of process parameters with different energy inputs (refer to ) to fabricate these boxes. Following the LPBF process, samples were cut from the substrate using electrical discharge wire cutting, and the surface topography was observed using a digital microscope system RH-2000. The upper surface roughness served as the chosen metric for assessing printing quality.
Figure 10. The boxes with different heights used in the printing experiment.
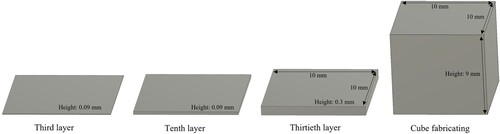
Table 6. LPBF cubic fabricating process parameters.
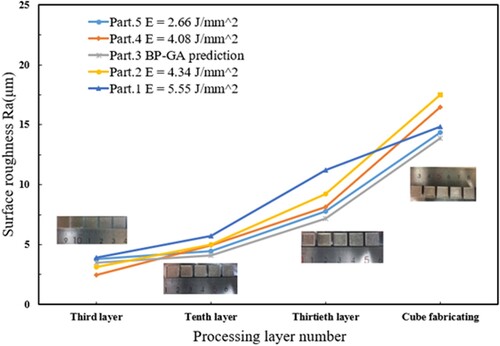
shows the upper surface roughness of LPBF Invar alloys with distinct heights using the five sets of process parameters listed in . As the height of manufacturing increases, an incremental rise in roughness was observed in the samples produced with all process parameters. LPBF parts were built layer by layer, and any compromise in the quality of the bottom layer could lead to poorer powder spreading in subsequent layers, resulting in a rougher upper surface. The upper surfaces of the third layer and the 10th layer parts under the five set process parameters appeared relatively flat, with roughness ranging from 2.5 to 5 μm. However, when the height exceeds 30 layers, the roughness of parts manufactured with different process parameters begins to show notable variations, exhibiting a significant increase compared to the 10th layer parts. At 300 layers (during cube fabrication), part 2 exhibited a roughness of 22.5 μm, which was considerably greater than other parts and displays evident ridges on the upper surface. It is noteworthy that parts formed at distinct heights using the co-parameters described in Section 2.4 yielded comparatively flat surfaces, with a roughness of 13.8 μm when reaching a height of 300 layers (during cube fabrication), significantly smaller than other parts.
Figure 11. The relationship between surface roughness and input energy density and the number of processing layers.
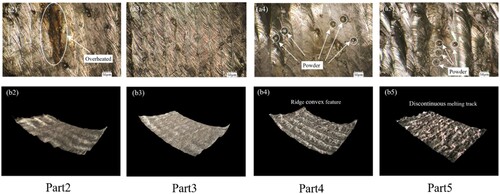
To comprehend the source of the disparity in roughness presented in an analysis of the top surface structure of each cube was conducted. The three-dimensional images of the top surface features of each sample, magnified 400 times, were depicted as (a1)–(a5), while their corresponding three-dimensional scanned images were represented as (b1)–(b5). When employing the five sets of process parameters from for a single pass test, all instances exhibited melt channels with enhanced morphology and fewer forming defects. However, during cube manufacturing, distinct discrepancies were observed in the top surface topography of each part. When the laser energy input density is low (2.66 J/mm2), the surface appeared significantly uneven (b5) with uneven melt channel widths and a morphology composed of incompletely melted and discontinuous powder particles. Insufficient laser heat input impeded the complete melting of powder layers thinner than 30 μm, leading to widened local melting channels and excessive absorption of surrounding powder. Consequently, adjacent scan lines failed to melt enough powder to form a comprehensive melting channel. Increasing the laser energy density to 4.08 J/mm2 could significantly enhance the powder melting effect and reduce the discontinuity of the melt channel. Nonetheless, numerous powder particles, approximately 10 μm in diameter, still adhered to the surface, and noticeable ridges persisted on the melt channel. Consequently, sample No. 4 exhibited a rough surface with an average roughness of approximately 22.5 μm. Subsequent increments in energy density (part 2) resulted in surface over-burning (a2), the clusters of larger-sized splattered powder particles, and unresolved ridge-like protrusions, leading to poor surface roughness. Conversely, the cube sample produced using the process parameters predicted in section 4.1 displays a relatively flat upper surface with well-overlapping melt channels and minimal defects, resulting in a smaller roughness value of 13.8 μm. Layer-by-layer optimization of process parameters could enhance powder melting while avoiding over-burning and spheroidal defects caused by excessive energy density, thereby effectively improving surface quality.
Figure 12. The typical topography and three-dimensional scan image of the upper surface of the cube sample made with the process parameters in observed with an ultra-depth-of-field microscope.
5. Conclusion
In conclusion, this paper systematically addressed the vexing challenge of heat accumulation in the Laser powder bed fusion (LPBF) process, offering a transformative solution to enhance 3D printing quality and efficiency, especially for the early printing stage. The research unfolded through a structured approach that involved numerical simulations, the development of an artificial neural network (ANN) model, printing experiments, and the integration of the ANN model into a genetic algorithm for optimization. The results unequivocally affirm the effectiveness of this method and its broad application potential for other similar processes in additive manufacturing. At its core, the proposed layer-by-layer optimization method provides a systematic strategy to fine-tune printing parameters, mitigating the deleterious effects of heat accumulation, a particularly critical issue when printing freeform and thin-wall structures. The method, validated through experimentation, demonstrates a significant reduction in surface roughness and, importantly, proves its practical applicability. Beyond mitigating heat accumulation, the approach excels in ensuring early-stage stability, critical for high-quality printing, and streamlines new material selection and testing, significantly reducing both time and cost.
Disclosure statement
No potential conflict of interest was reported by the author(s).
Data availability statement
The data that support the findings of this study are available from the corresponding author [Y. Zhang], upon reasonable request.
Additional information
Funding
References
- Kruth JP, Levy G, Klocke F, et al. Consolidation phenomena in laser and powder-bed based layered manufacturing. CIRP Ann. 2007;56(2):730–759. doi: 10.1016/j.cirp.2007.10.004
- Frazier WE. Metal additive manufacturing: A review. J Mater Eng Perform. 2014;23(6):1917–1928. doi: 10.1007/s11665-014-0958-z
- Rombouts M, Kruth JP, Froyen L, et al. Fundamentals of selective laser melting of alloyed steel powders. CIRP Ann. 2006;55(1):187–192. doi: 10.1016/S0007-8506(07)60395-3
- Li B, Han C, Lim CWJ, et al. Interface formation and deformation behaviors of an additively manufactured nickel-aluminum-bronze/15-5 PH multimaterial via laser-powder directed energy deposition. Mater Sci Eng A. 2022;829:142101. doi: 10.1016/j.msea.2021.142101
- Wang D, Liu L, Deng G, et al. Recent progress on additive manufacturing of multi-material structures with laser powder bed fusion. Virtual Phys Prototyp. 2022;17(2):329–365. doi: 10.1080/17452759.2022.2028343
- Kruth JP, Froyen L, Van Vaerenbergh J, et al. Selective laser melting of iron-based powder. J Mater Process Technol. 2004;149(1):616–622. doi: 10.1016/j.jmatprotec.2003.11.051
- Mumtaz KA, Erasenthiran P, Hopkinson N. High density selective laser melting of Waspaloy®. J Mater Process Technol. 2008;195(1):77–87. doi: 10.1016/j.jmatprotec.2007.04.117
- Yadroitsev I, Thivillon L, Bertrand P, et al. Strategy of manufacturing components with designed internal structure by selective laser melting of metallic powder. Appl Surf Sci. 2007;254(4):980–983. doi: 10.1016/j.apsusc.2007.08.046
- Morgan RH, Papworth AJ, Sutcliffe C, et al. High density net shape components by direct laser re-melting of single-phase powders. J Mater Sci. 2002;37(15):3093–3100. doi: 10.1023/A:1016185606642
- Grum J, Slabe JM. Effect of laser-remelting of surface cracks on microstructure and residual stresses in 12Ni maraging steel. Appl Surf Sci. 2006;252(13):4486–4492. doi: 10.1016/j.apsusc.2005.06.060
- Xiao Z, Yu W, Fu H, et al. Recent progress on microstructure manipulation of aluminium alloys manufactured via laser powder bed fusion. Virtual Phys Prototyp. 2023;18(1):e2125880. doi: 10.1080/17452759.2022.2125880
- Koh HK, Moo JGS, Sing SL, et al. Use of fumed silica nanostructured additives in selective laser melting and fabrication of steel matrix nanocomposites. Materials (Basel). 2022;15(5):1869. doi: 10.3390/ma15051869
- Majeed M, Vural M, Raja S, et al. Finite element analysis of thermal behavior in maraging steel during SLM process. Optik (Stuttg). 2020;208:164128. doi: 10.1016/j.ijleo.2019.164128
- Wang X, Lough CS, Bristow DA, et al. A layer-to-layer control-oriented model for selective laser melting. In: Proceedings of the American Control Conference (ACC). 2020 July. p. 481–486.
- Huang S, Narayan RL, Tan JHK, et al. Resolving the porosity-unmelted inclusion dilemma during in-situ alloying of Ti34Nb via laser powder bed fusion. Acta Mater. 2021;204:116522. doi: 10.1016/j.actamat.2020.116522
- Huang S, Kumar P, Lim CWJ, et al. Fracture behavior of PH15-5 stainless steel manufactured via directed energy deposition. Mater Des. 2023;235:112421. doi: 10.1016/j.matdes.2023.112421
- Alimardani M, Toyserkani E, Huissoon JP, et al. On the delamination and crack formation in a thin wall fabricated using laser solid freeform fabrication process: An experimental–numerical investigation. Opt Lasers Eng. 2009;47(11):1160–1168. doi: 10.1016/j.optlaseng.2009.06.010
- Tang P, Wang S, Long M, et al. Thermal behavior during the selective laser melting process of Ti-6Al-4V powder in the point exposure scan pattern. Metall Mater Trans B. 2019;50(6):2804–2814. doi: 10.1007/s11663-019-01670-5
- Li Y, Gu D. Thermal behavior during selective laser melting of commercially pure titanium powder: Numerical simulation and experimental study. Addit Manuf. 2014;1–4:99–109. doi: 10.1016/j.addma.2014.09.001
- Li Y, Gu D. Parametric analysis of thermal behavior during selective laser melting additive manufacturing of aluminum alloy powder. Mater Eng. 2014;63:856–867.
- Shi Q, Gu D, Xia M, et al. Effects of laser processing parameters on thermal behavior and melting/solidification mechanism during selective laser melting of TiC/Inconel 718 composites. Opt Laser Technol. 2016;84:9–22. doi: 10.1016/j.optlastec.2016.04.009
- Ciccone F, Bacciaglia A, Ceruti A. Optimization with artificial intelligence in additive manufacturing: A systematic review. J Braz Soc Mech Sci Eng. 2023;45(6):303. doi: 10.1007/s40430-023-04200-2
- Sing SL, Kuo CN, Shih CT, et al. Perspectives of using machine learning in laser powder bed fusion for metal additive manufacturing. Virtual Phys Prototyp. 2021;16(3):372–386. doi: 10.1080/17452759.2021.1944229
- Huang X, Ng WL, Yeong WY. Predicting the number of printed cells during inkjet-based bioprinting process based on droplet velocity profile using machine learning approaches. J Intell Manuf. 2023. doi: 10.1007/s10845-023-02167-4
- Wang C, Chandra S, Huang S, et al. Unraveling process-microstructure-property correlations in powder-bed fusion additive manufacturing through information-rich surface features with deep learning. J Mater Process Technol. 2023;311:117804. doi: 10.1016/j.jmatprotec.2022.117804
- Ding L, Tan S, Chen W, et al. Development of a manufacturability predictor for periodic cellular structures in a selective laser melting process via experiment and ANN modelling. Virtual Phys Prototyp. 2022;17(4):948–965. doi: 10.1080/17452759.2022.2091461
- Li B, Zhang W, Xuan F. Machine-learning prediction of selective laser melting additively manufactured part density by feature-dimension-ascended Bayesian network model for process optimisation. Int J Adv Manuf Technol. 2022;121(5–6):4023–4038. doi: 10.1007/s00170-022-09555-9
- Goh GD, Huang X, Huang S, et al. Data imputation strategies for process optimization of laser powder bed fusion of Ti6Al4V using machine learning. Mater Sci Addit Manuf. 2023;2(1):50. doi: 10.36922/msam.50
- Babu SS, Mourad AI, Harib KH, et al. Recent developments in the application of machine-learning towards accelerated predictive multiscale design and additive manufacturing. Virtual Phys Prototyp. 2023;18(1):e2141653. doi: 10.1080/17452759.2022.2141653.
- Loh L, Chua C, Yeong W, et al. Numerical investigation and an effective modelling on the selective laser melting (SLM) process with aluminium alloy 6061. Int J Heat Mass Transfer. 2015;80:288–300. doi: 10.1016/j.ijheatmasstransfer.2014.09.014
- Jimenez Abarca M, Darabi R, de Sa JC, et al. Multi-scale modeling for prediction of residual stress and distortion in Ti–6Al–4V semi-circular thin-walled parts additively manufactured by laser powder bed fusion (LPBF). Thin-Walled Struct. 2023;182:110151. doi: 10.1016/j.tws.2022.110151
- Emmelmann C, Sander P, Kranz J, et al. Laser additive manufacturing and bionics: Redefining lightweight design. Phys Procedia. 2011;12:364–368. doi: 10.1016/j.phpro.2011.03.046
- Sproull RL. The conduction of heat in solids. Sci Am. 1962;207(6):92–106. doi: 10.1038/scientificamerican1262-92
- Yin J, Zhu H, Ke L, et al. Simulation of temperature distribution in single metallic powder layer for laser micro-sintering. Comput Mater Sci. 2012;53(1):333–339. doi: 10.1016/j.commatsci.2011.09.012
- Rombouts M, Froyen L, Gusarov AV, et al. Light extinction in metallic powder beds: Correlation with powder structure. J Appl Phys. 2005;98(1):13533. doi: 10.1063/1.1948509
- Thummler F, Oberacker R. An introduction to powder metallurgy. London: The University Press; 1993. p. 59.