
 ?Mathematical formulae have been encoded as MathML and are displayed in this HTML version using MathJax in order to improve their display. Uncheck the box to turn MathJax off. This feature requires Javascript. Click on a formula to zoom.
ABSTRACT
In this work, wire arc additive manufactured IN718 materials with different textures and defect characteristics were obtained via two deposition strategies: parallel mode (P_mode) and oscillation mode (O_mode). The influences of these microstructure variables on the low-cycle fatigue (LCF) properties were systematically investigated by experimental and crystal plasticity finite element (CPFE) frameworks. Results revealed that the weak texture of the O_mode sample may be detrimental to LCF due to strain incompatibility between adjacent grains. However, large-sized pore defects in the P_mode samples significantly increased the dispersity of LCF life. The sensitivity of fatigue crack initiation to critical defect size and location was further accurately captured based on the stored energy density criterion, and the fatigue crack nucleation life was also quantified. Finally, the LCF limit was calculated based on the Coffin–Manson equation, and the life prediction intervals of WAAMed-IN718 alloys with different deposition strategies were unified.
1. Introduction
IN718 superalloy offers unique advantages for aircraft engines, gas turbine engines and petrochemical applications because of its excellent high-temperature strength, creep resistance, corrosion and oxidation resistance [Citation1–3]. IN718 components usually suffers loading–unloading conditions caused by environmental factors or operational conditions (such as wind or cyclic vibrations), leading to high strain low-cycle fatigue (LCF), which may pose a significant threat to the safety and operation of these structures [Citation4,Citation5]. Therefore, the fundamental understanding of fatigue failures originating from microstructure has been the focus of considerable research over the past few decades.
Due to the ever-changing technological demands, most crucial sectors have imposed more stringent requirements on the quality of IN718 engineering components. Additive manufacturing (AM) technology has become an attractive tool for processing metal material due to its high manufacturing flexibility [Citation6]. Among them, wire arc additive manufacturing (WAAM) technology [Citation7,Citation8] has incomparable manufacturing advantages in fabricating large IN718 parts due to its high deposition rate and high versatility [Citation9]. However, the manufacturing defects and inhomogeneous microstructural features still have yet to be understood, as these microstructural variables play a crucial role in governing the mechanical response and failure mechanisms of structural materials [Citation10].
Generally, AM process parameters significantly affect the microstructure, such as local molten pool shape and size, deposition strategies, thermal gradients, cooling rates and thermal cycling caused by repeated deposition of following molten layers, resulting in highly heterogeneous microstructure [Citation11–13]. A preferential <100> crystallographic texture can be widely observed in various material and AM techniques [Citation14,Citation15]. There is also some inhomogeneous grain morphology worthy of attention [Citation16–19]. Currently, most studies focus on the effects of crystallographic orientations and heterogeneous grain structure on anisotropic mechanical properties [Citation20,Citation21]. It is generally believed that the presence of oriented columnar grains in AM-IN718 is one of the main factors causing anisotropy [Citation22,Citation23]. Compared to L-DED or L-PBF, WAAM process has larger melt pool sizes and slower cooling rates [Citation6,Citation24], allowing WAAM-IN718 to form columnar grains with maximum dimensions exceeding 1 mm. Additionally, the average grain size in WAAM-IN718 is approximately 5–6 times larger than that in L-PBF-IN718 [Citation25]. It means that the contribution of grain strengthening, at this grain size scale, to the yield strength of WAAM-IN718 is negligible. The precipitation hardening after heat treatment plays a more important role. As a result, WAAM-IN718 exhibits nearly isotropic tensile performance. In addition, there are very few studies on the micro-mechanism of the sensitivity of the slip system with respect to grain orientation characteristics of additive manufactured IN718 under cyclic loading.
Besides heterogeneous microstructure and preferred orientations, another important reason why WAAM technology has not yet achieved widespread success in safety-critical components is that there are some potential manufacturing defects [Citation6,Citation26]. Internal defects such as lack of fusion and solidification cracks in the WAAM process can be avoided through reasonable process strategies [Citation10,Citation27]. However, for WAAMed-IN718, the entrapped gas pores during the deposition process and some voids left by the peeling off of hard particles (Laves and carbide) are retained in the material, which cannot be completely eliminated so far [Citation28]. Stress concentrations induced around defects drive plastic deformation under cyclic loading, leading to early nucleation of fatigue cracks [Citation10,Citation26]. It has been reported that the prominent fatigue cracks of IN718 alloy fabricated by laser powder bed fusion(L-PBF) always initiate around the pores despite the critical defects being only ∼20 μm [Citation29]. And the effect of pore size on fatigue behaviour is more critical than that of pore volume fraction [Citation30]. However, it has also been noted that IN718 alloys may not be as sensitive to the defects as other alloys such as Ti–6Al–4V [Citation31]. Muhammad et al. [Citation32] reported that even when the maximum defect size reaches 40 μm, the fatigue cracks still mainly originate from the crystallographic facets. The initiation of fatigue cracks may be mainly attributed to the formation of persistent slip bands (PSBs) along the slip plane [Citation33]. Obviously, the defect and facet driven fatigue crack initiation mechanisms in AMed-IN718 may be competing. However, the factors govern this competition have to do with both the size and location of the defects and are currently left less exploited.
It is advantageous to understand the role of crystallographic features and defects towards mechanical behaviour at the microscale, and this ductile failure can be explained using continuum plasticity theory [Citation34]. The microstructure-sensitive crystal plasticity finite element (CPFE) modelling method can thus be used to capture the influencing mechanism of microstructure, including crystallographic features, defects, inclusions, etc., on LCF crack nucleation [Citation33,Citation35]. The local critical quantities of the crack nucleation location, including stress, plastic strain, plasticity energy and dislocation density should all be addressed [Citation36–38]. Cao et al. [Citation39] analysed the effect of defect types on the fatigue life of selective laser melted (SLM) AlSi10Mg using a quasi-3D modelling approach and pointed out that compared to spherical pores, lack of fusion with sharp edges led to several orders of magnitude reduction in fatigue life at high cyclic peak stresses. Prithivirajan and Sangid [Citation5] reported that the pore size comparable to the grain size is required to induce LCF failure in SLM-IN718, otherwise, fatigue crack nucleation is more sensitive to microstructural inhomogeneities.
Regarding the fatigue life prediction method, recently, machine learning-assisted methods for fatigue life prediction have been demonstrated in addressing nonlinear mapping relationships [Citation40,Citation41]. Various machine learning algorithms related to the fatigue performance of AM components have been applied to understand the relationship between manufacturing defects and failure life [Citation42]. The prediction accuracy of these methods relies on iterative analysis of extensive data and the superiority of the algorithms used.
However, CPFE methods are a numerical algorithm driven by phenomenological and physical mechanisms. Its advantage lies in its ability to provide insights into the macroscopic mechanical feedback caused by microstructure variables, which is not paralleled by machine learning route. By employing the principle of damage accumulation, fatigue indicator parameters (FIPs) such as stored energy density (SED), accumulated plastic strain (ASS) and plastic-dissipated work (PDW) have been developed for damage prediction. Where the stored energy density (SED) criterion is adequate for understanding the microstructural sensitivity of LCF behaviour as it evaluates the joint effect of the activation of the slip system, the evolution of dislocation density and the magnitude of local stresses rather than considering them individually [Citation43]. It helps to understand the local energy accumulation caused by crystallographic orientation characteristics, defect size, defect location, etc. The SED criterion describes a unique damage value corresponding to specific microstructure variables. Although, it is not as capable as machine learning in addressing nonlinear mapping capabilities, the SED criterion can be used to define a prediction interval by establishing critical models, thereby determining the fatigue limit under specific manufacturing parameters.
This work aims to establish a modelling framework suitable for WAAMed-IN718 through CPFE simulations, followed by experimental validation. The microscopic mechanism of LCF crack nucleation caused by texture variation and defect parameters under different strain amplitudes was investigated. Also, this work provides an in-depth explanation of the fatigue sensitivity upon microstructures via the SED criterion. The most destructive microstructure was determined. The LCF life under different processes was reasonably predicted.
2. Experimental procedures
2.1 Material preparation
The WAAMed-IN718 block was fabricated via a homemade welding system. Two deposition strategies were used using the same welding parameters (welding speed and wire feeding speed), including parallel path mode (P_mode) and oscillation path mode (O_mode), as seen in . The filler wire and specific deposition process can be found in our previous works [Citation17]. The main differences between these two deposition processes are microstructure and internal defects, which will undoubtedly affect fatigue performance differently. Subsequently, the metallographic and mechanical tests were obtained in the central area of the IN718 block.
Figure 1. Schematic of specimen preparation process of WAAMed-IN718. (The letters ‘W’ and ‘T’ represent the width and thickness of the welding rod respectively.)
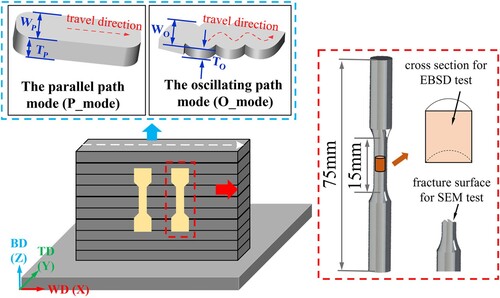
All samples underwent a complete heat treatment before use. And the heat treatment method referenced the standard casting IN718 method [Citation44], but with some modifications. Firstly, the homogenisation process was determined to hold at 1150°C for 2 h, aiming to dissolve the Laves phase as much as possible. Considering the potential performance degradation of WAAM-IN718 caused by the δ phase, the intermediate heat treatment steps were omitted. Subsequently, a one-step aging process was completed after a 14-h hold time at 700°C.
The modified heat treatment method has been verified in our previous work to greatly reduce the influence of Laves phase and obtain excellent hardening effect [Citation17,Citation45].
The tensile properties of different processes under this heat treatment method are summarised in . Compared with the reported results of WAAM-IN718 [Citation15,Citation18,Citation20,Citation46–49], a better strength–plasticity trade-off is obtained.
Table 1. The tensile properties of P_mode and O_mode samples after heat treatment (YS0.2: yield strength, UTS: ultimate tensile strength, EL: elongation).
2.2 Microstructural and defects examination
Crystallographic information was first characterised using electron backscatter diffraction (EBSD, ZEISS EVO-10 equipped with an Oxford Instruments Nordlys detector). EBSD data were further collected with a step size of 3 µm and analysed via MTEX@MATLAB software.
The intrinsic defects introduced by the WAAM process were inspected by a GE X-ray computed tomography (CT) with a spatial resolution of 4 μm. All test samples were machined to Ф3 mm*5 mm cylinders from randomly selected fatigue samples of both P_mode and O_mode. The three-dimensional (3D) morphology reconstructions of defects were then implemented via the commercial software Avizo.
2.3 Low-cycle fatigue (LCF) tests
The previous work reported that WAAMedIN718 in the heat-treated state has close to fully isotropic tensile strength [Citation15,Citation17]. This is because IN718 is a kind of typical precipitation-hardened alloy determined by nanophase (γ′/γ″). The WAAM process indeed introduces inevitable columnar grains due to the relatively high heat input and slow cooling rate (compared to other processes with the laser as heat source), but the strength contribution from the grain boundaries is limited, and thus weak anisotropic tensile properties can still be obtained. However, in this study, all fatigue testing samples are only taken from the BD direction (as seen in ). Subsequently, fully reversed strain-controlled cyclic tests (R = –1) were conducted at room temperature using various strain amplitudes (Δϵt/2) of ±0.60%, ±0.70%, ±0.80%, ±0.90% and ±1.0% with a constant frequency of 0.5 Hz. Each sample was tested three times to eliminate sample singularities as much as possible. The experimental procedure is terminated when cycles reach 10,000, or the stress amplitude decreases by 20%. All fatigue fracture surfaces were morphologically scanned using a scanning electron microscope (SEM, GemimiSEM 500) to record potential fracture mechanisms.
3. Experimental results and discussion
3.1 Crystallographic characteristics
(a) and (b) show the Inverse Pole Figure (IPF) maps of the samples fabricated by the P_mode and O_mode, respectively. Both samples present typical epitaxial columnar grains; the interlayer boundary is also easy to be identified due to its finer grain structure. The previous work shows that the O_mode sample after heat treatment has a slightly higher proportion of fine-grained regions and a slightly smaller average grain size than the P_mode sample [Citation17].
Figure 2. EBSD maps of WAAMed-IN718 material, where (a), (c) show the IPF maps of P_mode and O_mode; (b), (d) are the KAM results of P_mode and O_mode samples; (e), (f) show the Pole Figures of different samples.
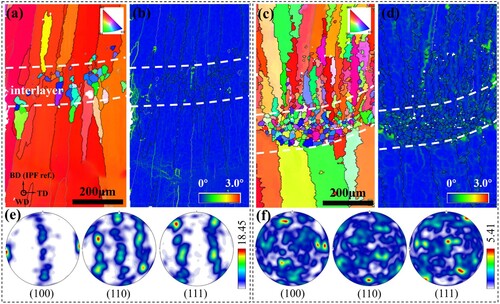
The most significant difference between these two samples is the grain orientation distribution. The P_mode sample has a larger individual weld bead thickness (TP > TO, as seen in ), greater heat input, and a smaller temperature gradient. It results in a microstructure with typical <100> texture characteristics [Citation15,Citation17,Citation49], and the texture intensity reaches 18.45 (e). However, the O_mode process reduces the layer height and increases the cooling rate, resulting in a weakened texture and finer grain size. Although a few grains near the fine-grained region (the starting position of the following deposition layer) still retain the <100> growth mode, the overall texture strength is only 5.41, as seen in (f). It should be reminded here that a few EBSD maps were merged together to obtain the texture data, which makes the data statistically more reliable.
In addition, the homogenisation treatment serves both as a process to dissolve the Laves phase and as a critical step for stress relief. The Kernel Average Misorientation (KAM) tested by EBSD can approximate the changes in local dislocation density caused by residual stresses [Citation50]. However, the results show that most of KAM values after complete heat treatment of different process samples are all much less than 1°, as seen in (b, d), indicating the absence of significant micro strains. Therefore, it can be approximated that there is indeed only weak residual stress, and this weak residual stress does not have a significant impact on the fatigue performance of the component. It means that crystallographic and defect characteristics will be the most important factors that dominate the mechanical properties of the alloy.
3.2 Metallurgical defects
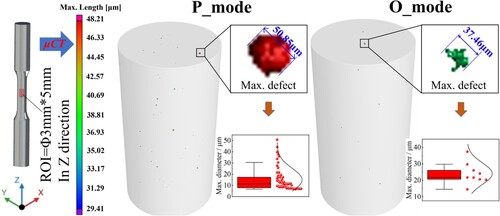
quantifies the defect distribution in the samples fabricated under the two different deposition strategies. Some spherical and irregular shapes may generally be the result of pores and exfoliated particles. CT results show that defects are discretely distributed in all samples. The maximum defect size in the P_mode sample is 50.85 μm. The porosity in region-of-interest (ROI) is 0.047%, where more than 72% of the defects have a maximum size within 13 μm. In contrast, the O_mode sample has subjected to molten pool oscillation and shorter void escape distance (due to lower layer height), which significantly reduces the number of defects. The porosity is only 0.011%, and the maximum defect size is only 37.46 μm. The statistical results are approximately consistent with the previous destructive test results [Citation17]. Most tests have proven that defects in IN718 may act as preferential sites for crack initiation and thus decline the fatigue performance [Citation5].
Figure 3. A qualitative representation of the volumetric defects in both P_mode and O_mode materials.
3.3 Cyclic deformation behaviour and failure mechanism
Interestingly, although the static yield strength of P_mode is slightly lower than O_mode (1071.77 MPa vs. 1031.93 MPa) [Citation17], the LCF life distribution shows that most of the data points overlap, as seen in (a), especially at the lowest strain (±0.60%) and the highest strain (±1.0%) amplitudes. Nevertheless, overall, the life distribution of P_mode is more scattered, and the origin of these differences must be related to factors such as microstructure and internal defect characteristics.
Figure 4. Cyclic stress response curves of IN718: (a) variation of reversals to failure with plastic strain amplitude; (b) typical cyclic stress response at different total strain amplitudes of O_mode samples.
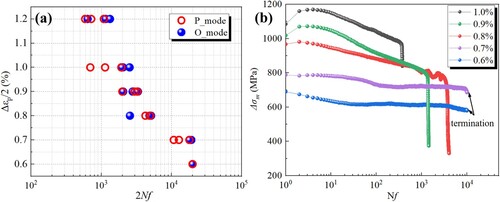
The variation of the cyclic stress amplitude (Δσm) with the number of cycles (N) is also displayed in (b). The evolution curves of O_mode and P_mode samples are almost the same, so only O_mode is used for explanation. Usually, the shape and size of stress–strain hysteresis cycles continue to change with the accumulation of cycle numbers, leading to cumulative damage behaviour. Almost all samples exhibit slight cyclic hardening in the first few cycles with strain amplitudes ≥±0.8%. Subsequently, as the number of cycles increases, the accumulation of plastic damage causes continuous cyclic softening. At low strain amplitudes (<±0.8%), the samples all experience a long-term stable state. The increase in strain amplitude will intensify the cyclic softening rate as the number of cycles accumulates; that is, when the strain amplitude is ≥ ±0.8%, the stress peak continues to decrease significantly.
Typical fracture surfaces of P_mode and O_mode samples tested at ±0.80% strain amplitude are shown in . Although the number of cycles is low, the fatigue crack initiation region (CIR) and crack propagation region (CPR) can be easily identified, as seen in (a) and (c). As for the P_mode sample, a high magnification image of CIR (b) shows that there are some voids (orange circles) with a size of 30–50 μm at the edge of the fracture. These near-surface defects may play an essential role in initiating crack initiation.
Figure 5. Typical fractographies at Δϵ/2 = 0.8% of (a, b) P_mode (Nf = 2130) and (c, d) O_mode samples (Nf = 2499), respectively.
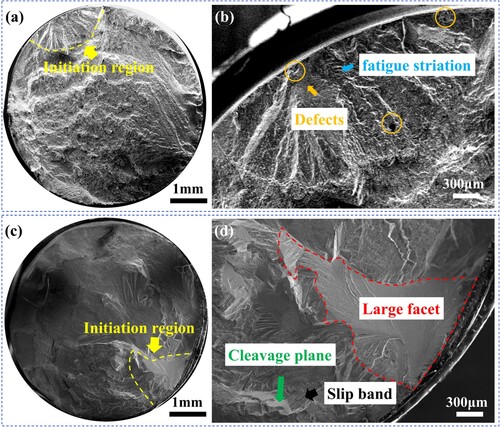
The fracture surface of the O_mode sample is similar to the fracture characteristics of most other samples. The fracture plane in CIR is more or less flattened (c) with no defects. In defect-free IN718 material, when the shear stress applied on the slip plane is greater than the critical value, the slip system is activated, thereby generating the slip bands. The generation of persistent slip bands (PSBs) will produce facets (red dashed lines) within the grains, thereby forming intragranular fracture [Citation51,Citation52]. The size of these facets is approximately equal to the width of the columnar grains. This situation is most common in the high-cycle fatigue (HCF) fracture of IN718 [Citation53]. Cleavage planes are marked with green arrows, which are typical of cracking along slip planes. Blue arrows point to apparent cracks along the slip plane. At high strain amplitude (≥±0.80%), more than one slip system may be activated in multiple grains, and multiple crystallographic facets are formed, which dominates the generation of cracks and accelerates the failure.
4. Crystal plasticity framework and numerical implementation
4.1 Overview of crystal plasticity model
The total deformation gradient F can be divided into elastic and plastic
parts as
(1)
(1)
The Schmid tensor of each of the 12
slip systems is given by [Citation34]
(2)
(2) where
and
are the slip direction vectors and slip plane normal vectors, respectively.
The plastic velocity gradient, is described as the relation to the slip rate on the slip systems
[Citation54]:
(3)
(3)
The second Piola–Kirchoff stress, and the elastic Green–Lagrange strain
, are given by [Citation55]
(4)
(4)
(5)
(5) where
represents the current temperature,
is the fourth-order elastic stiffness tensor as a function of temperature.
is the thermal expansion tensor and
is the initial temperature.
The relationship between the second Piola–Kirchoff stress and Cauchy stress T is given by [Citation55]
(6)
(6)
The shear rate due to the dislocation slip is defined on each slip system by an expression representing the thermally activated motion of dislocations [Citation56,Citation57]:
(7)
(7)
where is a constant reference shear rate,
is Boltzmann's constant,
is the activation energy.
is the temperature-dependent shear modulus,
is the reference shear modulus at 0 K,
is the deformation resistance stress caused by dislocation,
is the back stress. The back stress significantly affects the driving stress
of dislocation motion. Classical nonlinear back stress theory [Citation58,Citation59] also enables the model to capture the Bauschinger effect during cyclic loading, where the back stress of a specific slip system changes with the plastic shear rate in the following way [Citation60]:
(8)
(8) where R1 and R2 are related parameters of back stress.
is the intrinsic lattice resistance,
and
are exponents of the energy barrier for dislocation motion. The resolved shear stress
can be defined as [Citation61]
(9)
(9) where
(10)
(10)
is given by [Citation55]
(11)
(11)
The elastic modulus has a linear relationship with temperature:
(12)
(12) the resistance stress is given by
(13)
(13) where
is the initial slip resistance obtained in [Citation45].
is a far field resistance,
is Burger's vector,
is the dislocation interaction tensor [Citation62], and
is the dislocation density on slip system
.
The evolution of dislocation density on the specific slip system is given by [Citation55]
(14)
(14) where
is the dislocation multiplication interaction tensor and
is the dislocation capture radius of dislocation annihilation.
is given by the following for self-interacting and coplanar slip systems, with constant
[Citation63]. The constant
is for intersecting non-coplanar systems.
4.2 Stored energy density (SED) criterion
Fatigue microcrack nucleation is a process of localised plastic deformation leading to damage accumulation until failure, which tends to account for the primary reason affecting fatigue life for nickel-based alloys. To predict the location of microcrack nucleation and fatigue life, physical quantities such as cumulative plastic strain and cumulative shear strain, which strongly correlate with microplastic deformation, are often focused on as fatigue-indicating factors. The local energy storage criterion was proposed by Wan et al. [Citation64,Citation65]. It integrates the local slip, stress state and dislocation density and was shown to be more accurate in predicting the location of fatigue microcrack nuclei relative to these single physical quantities. Subsequent work has shown that SED criterion still has good predictive ability for fatigue microcrack nucleation under complex deformation conditions, e.g. Chen et al. predicted the source of microcracks induced by a large-sized inclusion in nickel-base high-temperature alloys using the SED criterion in agreement with all experimental observations [Citation66], Lu et al. applied the SED criterion to predict the lifetime of RR1000 alloy in a multiaxial fatigue condition [Citation67]. In our recent work, the SED criterion was employed to investigate the mechanism of micrometre-scale inclusions on the lifetime of microcrack nucleation [Citation43].
The calculation of the local energy storage density first requires the determination of the total energy consumed by the micro structured point within a single cycle due to plastic deformation [Citation37]:
(15)
(15) where σ and ϵ are the stress tensor and plastic strain tensor, respectively. A portion of the plastic deformation energy is stored in the form of localised elastic energy in the form of a dislocation structure, and the average storage volume of this microstructure can be represented by
(16)
(16) where
is the mean free distance of the dislocation,
the potential free surface area generated. Thus the energy density (
) stored in one cycle can be written as
(17)
(17) where
is the percentage that is stored in the microstructure. Considering that 95% of the energy in the plastic deformation process proves to be consumed in the form of heat [Citation68,Citation69],
is generally taken as 5%.
Numerical strategy follow Satyapriya Gupta Proposed three-levels of staggered iterative procedure. Implementation details refer to [Citation60].
4.3 Microstructure reconstruction and constitutive parameters calibration
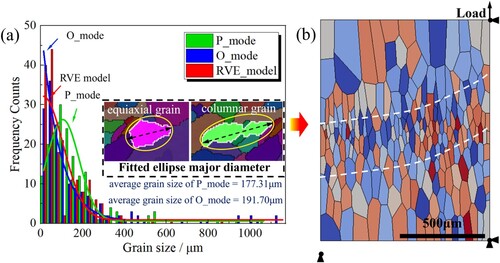
To accurately describe the microplastic response and predict LCF life, a representative volume element (RVE) model based on the microstructure was constructed using the initial EBSD information. First, the fitted ellipse major diameter method is used to describe the grain size distribution, as shown in (a). The results show that although the O_mode sample has a wider fine-grained layer than the P_mode sample, from the perspective of grain size distribution, the average grain size of P_mode is only 8.11% higher than that of O_mode, and the peak size is 13.01% higher. Since the average grain size exceeds 170 μm, the initial slip resistance τ0 is mainly related to precipitation strengthening rather than grain boundary strengthening [Citation45]. As mentioned earlier, this work mainly focuses on the influence of texture and defect characteristics. Therefore, to simplify the model, the open-source modelling software Neper [Citation70] is used to generate one type of geometry model based on O_mode samples, as shown in (b). The <100> strong texture in P_mode samples and weak texture parameters in O_mode samples are then assigned to the grains. Named P_mode-S model and O_mode-W model, respectively. The CPFE geometric model uses a plane strain three-node element (CPE3) with 2 μm global element size and a total of 29,490 elements. In addition, the periodic boundary conditions (PBCs) [Citation45,Citation71] are applied in this CPFE model to ensure consistent response to the relative boundaries, as shown in (b).
Figure 6. (a) The grain size distribution of P_mode, O_mode samples and the RVE model; (b) the 2D representative volume element model with applied periodic boundary conditions.
Using the trail-and-error method, all the constitutive parameters can be calibrated according to the experimental stress–strain response. First, the elastic constants follow the previous fitting results [Citation45]. The cyclic behaviour is related to the microstructural composition and its interaction with dislocations. The other constitutive parameters is determined based on the hysteresis loops in the first three cycles (one of the stable cycle) with strain amplitude of ±0.6%, ±0.8% and ±1.0%. (a–c) show the comparison between experiments and model predictions of stress–strain cycle curves. The simulation results are in good agreement with the experimental data, and the prediction error of the peak and valley values of the maximum cyclic stress does not exceed 0.17%, which proves the rationality of the constitutive parameters. All parameters used in this study have been listed in .
Figure 7. Calibration of CPFE parameters with experimental results.
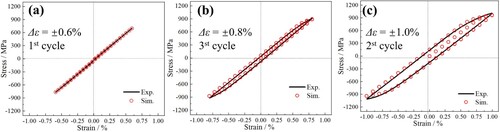
Table 2. Material parameters of WAAMed-IN718 used in the current work.
5. Simulation results and discussion
5.1 Cyclic deformation behaviour and damage evolution caused by crystallographic features
5.1.1 Analysis of the Schmidt factor
The Schmidt factor (SF) distribution before the deformation of the slip systems was analysed. A colour scale bar from blue to red (corresponding to an SF ranging from 0.28 to 0.5) implies a transition from ‘hard’ to ‘soft’ crystallographic orientations. The SF values of several special locations are also illustrated in (a) separately, showing where plastic strain may first occur. There is a significant difference in the SF distribution between the coarse-grained (CG) and fine-grained (FG) regions. The FG region mainly shows hard orientation (‘hard grains’), while the CG region is dominated by ‘soft grains’. It is worth noting that the SF in the CG region is also heterogeneous, especially in the O_mode samples (b). Generally, there is a strong strain incompatibility between soft and hard grains, which becomes the location where plastic strain accumulation first occurs. Therefore, these coarse grains with larger SF values will have more considerable shear strain on the slip plane during the cyclic loading process, leading to crack initiation until propagation and final failure. It is consistent with the fracture characteristics mentioned in Section 2.3, that is, the fatigue source originates from grains with larger SF values, and intragranular fracture occurs under the influence of persistent slip bands (PSBs).
Figure 8. The SF maps before LCF test of (a) P_mode sample with sharp texture and (b) O_mode sample with weak texture; the SF distribution of different location along (c) path 1 and (d) path 2.
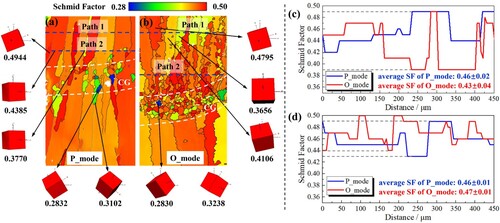
(c) and (d) illustrate the closer examination of the Schmidt factor on two critical sites, where path 1 and path 2 represent the SF distribution far away from the FG region and close to the FG region, respectively. Although the average SF value of the O_mode sample in CG region (path 1) is slightly lower than that of the P_mode sample (average SF: 0.43 vs. 0.46), its SF factor distribution in path 1 is more dispersed than that of the P_mode sample (standard deviation of SF: 0.04 vs. 0.02), as seen in (c), which may increase the strain incompatibility. The average SF values displayed in path 2 of both samples exceed 0.46 and have smaller fluctuations than those of path 1 (standard deviation of SF: 0.01), as shown in (d). However, the CG region is usually dominated by hard grains, which means that the strain gradient in the transition region between the CG region and Path 2 may be more pronounced. Especially in the O_mode sample, as there are more fine grains than that of the P_mode samples. It also means that the columnar grains close to the FG region are the most likely locations for crack initiation.
5.1.2 The influence of texture characteristics on store energy density
The consequent of different grain orientation characteristics on LCF responses of WAAMed-IN718 are assessed in detail. illustrates the storage energy density (SED) distribution of the P_mode-S and O_mode-W case after cyclic load (strain amplitude ±0.8%, 20th cycles), where the grain damage status of SED > 0.5 J/m2 is extracted and counted in (c). SED is distributed evenly in the P_mode-S case, and obvious damage accumulation occurs only in local areas (red circle). As for the O_mode-W one, the peak value of SED is greater than 1.5 J/m2 in several regions, and the SED in some triple junctions of grain boundaries exceeds 1.2 J/m2, becoming the most likely location for crack initiation. The statistical results of SED further confirm that the O_mode-W case has more fatigue damage regions and higher peak intensity under the same cyclic load.
Figure 9. Comparison of store energy density of (a) P_mode-S model and (b) O_mode-W model at 20 cycles with the strain amplified of ±0.80%; distribution of the peak SED between P_mode-S and O_mode-W models.
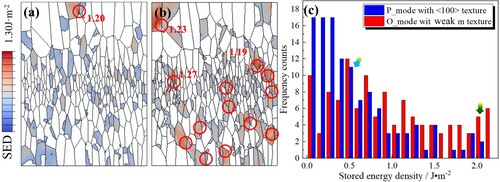
As mentioned in the previous section, if the crystallographic orientations of adjacent grains are inconsistent, their primary activated slip systems are very likely different, and therefore, different plastic deformations take place within them. The difference in plastic strain accumulation between the two grains increases the local dislocation density, and a strain gradient is generated near the grain boundary. Increased dislocation density creates higher local stresses and potentially higher stored energy densities. Therefore, when no defects or other microstructural heterogeneities are present in the microstructure, fatigue cracks tend to nucleate in slip-localised regions near grain boundaries.
In the simulation of the P_mode-S case, the crystallographic orientations are closer, the strain incompatibility between grains is smaller, and the plastic strain transfer is smoother, making plastic accumulation less likely to occur. The O_mode-W variant has a larger SF gradient in the coarse grain region, which is detrimental to cyclic damage accumulation. In actual samples, the static yield strength of the O_mode sample is slightly higher than that of the P_mode sample. Theoretically, the fatigue performance of O_mode sample will be better than that of the P_mode sample. However, the experimental and simulation results both confirm that stronger texture in P_mode sample is beneficial to its fatigue resistance. This explains why the LCF life of the two samples is close. However, it is difficult to accurately quantify the specific contribution of WAAMed-IN718 textural features to fatigue performance, as the microstructural inhomogeneities introduced to the sample by the process itself and their influence on initial slip resistance must also be considered.
5.2 Influence of critical defects on LCF
5.2.1 Definition and modelling of critical defects
The LCF life distribution of P_mode samples is more dispersed (see a), probably related to their intrinsic defects. Therefore, it is necessary to model and analyse the influence of critical defects. To simplify the pore geometry, the trapped defects are ideally designed as circles with the largest circumscribed circle diameter, as adopted in other studies [Citation5,Citation39,Citation72]. The maximum defect size obtained from CT results can be used to investigate its influence on the local mechanical response of WAAMed-IN718 and the ultimate fatigue life. Due to the discrete distribution of defects, only a single-pore placed at a fixed position was used to avoid the effects of anisotropy and the pore-pore interaction.
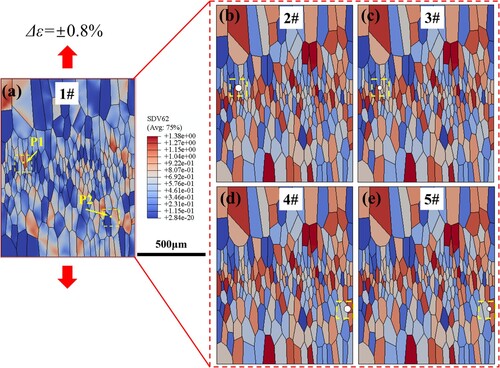
In this section, only the O_mode-W model framework is used to simulate the potential worst-case fatigue resistance condition when defects exist, since the weak texture is not conducive to LCF in this work. (a) plots the SED distribution of the O_mode-W model after 20 cycles at a strain amplitude of ±0.8%. P1 and P2 represent the maximum SED position and the minimum SED position far away from P1, respectively. Take the P1 and P2 position nodes as the centre; defects in virtual microstructure can be created with one pore having sizes of 40 and 55 μm, respectively, where 40 and 55 μm are the maximum defect sizes that were obtained by CT inspection in the O_mode and P_mode samples, respectively. It means that in addition to the RVE model without pore (1#, a), four other RVE models containing defect were created, including large pore (2#, b) and small pore (3#, c) at the P1 position, and large pore (4#, d) and small pore (5#, e) model at the P2 position. The finite element mesh was locally refined around the pore centre with an element size of 0.5 μm.
Figure 10. Schematic diagram of defect location: (a) the SED distribution of RVE model without pore; the RVE model containing pore: (b) 2#, (c) 3#, (d) 4# and (e) 5# models.
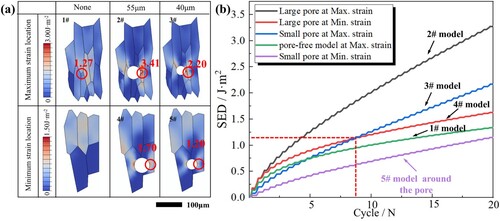
The resulting distributions of SED for each RVE model containing pore under strain amplitude of ±0.8% are shown in . The evolution of peak energy storage density in the model was also quantitatively evaluated. For the 1# model, plastic damage occurs at the grain boundaries where the SF factor is largest. As for the RVE model containing pore (2#–4#), the highest SED value almost all occurs at the pore boundary (marked by yellow circles) due to intense stress concentration. Model 2# has the largest SED value, which is about three times that of model 1#. The SED value of model 3# is also significantly higher than that of model 4#, which shows that the sensitivity of fatigue damage to the defect location has a higher priority than the size of the defect. The simulation results of the model 5# further confirm this perspective since the SED value at the pore boundary of model 5# is always lower than the SED peak value of the defect-free model (mode 1#), and the location and evolution of the maximum SED in model 5# are completely consistent with those of model 1#. There are also differences in the growth rate of storage energy density evolution of RVE model containing pore with different positions and sizes. The SED evolution curve of model 3# intersects with both model 5# and 6#, which is related to the local slip resistance and the number of activatable slip systems. That is, fatigue damage will be maximised when defects exist at the location where slip is most likely to accumulate. On the contrary, fatigue damage will proceed slowly when the defect is located where slip is less likely to occur.
Figure 11. (a) The distribution of stored energy density at the 20th cycle for both pore-free and pore microstructure when Δϵt/2 = ±0.8%. (b) Evolution of maximum SED for 1#, 2#, 3# and 4# RVE models, where the purple curve represents the SED evolution curve around the pore in the 5# model, but not the maximum SED evolution curve in the 5# model.
5.2.2 Slip system activations by critical defects
Based on the damage evolution results of the RVE model containing pore, this section will conduct a more detailed analysis of the microstructural region near the pore with the maximum strain position (model 2#) to investigate the influence of local slip activation on the driving force of LCF. shows the accumulated shear strain of the individual slip system that dominates the region of maximum plastic damage. It should be noted that only the activated slip systems, either in the pore-free or Max. pore model, were presented here. For the pore-free microstructure, the slip system with the largest shear strain accumulation is [110] (1–11) in grain 6, as seen in (d). However, the slip system with the largest shear strain accumulation of pore microstructure is [011] (–1–11) in grain 1, as seen in (h).
Figure 12. Accumulated shear strain of dominating slip systems activated for both RVE mode with or without pore, respectively, at the 20th cycle and a Δϵt/2 of ±0.8%.
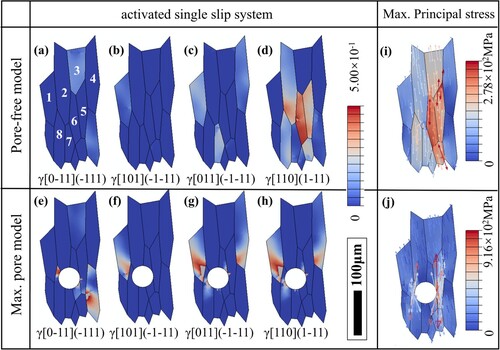
Interestingly, under the same load, there is mainly one set of slip system being activated in the pore-free model (d), while there are four strongly activated slip systems near the pore defects (e–h). In particular, multiple slip systems are found to be activated in grain 1. (j) shows a very chaotic stress (arrow pointing) state around the pores, which may lead to the activation of other slip systems by the high level of resolved shear stress on different slip planes. More activated slip systems contribute greater plastic strain and potentially produce higher dislocation density accumulation. Since the stored energy density is the combined result of stress, plastic strain and dislocation density, the fatigue crack nucleation locations and damage evolution rules expected from the RVE model containing pore can be accurately captured.
5.3 Prediction of LCF life based on Coffin–Manson equation
The SED criterion also provides a calculation method for calculating cycles required to nucleation of fatigue cracks [Citation43,Citation73,Citation74]. Assuming that the SED evolution of each type of microstructure will reach to a steady state within 20 cycles, the predicted fatigue life (Nsim) can be approximately calculated from:
(18)
(18) where
and
represent the accumulative SED and the highest value of the local stored energy density at the 20th cycle, respectively. Then the relationship between LCF cycle life and strain amplitude can be described by the Coffin–Manson (C–M, Equation 18) equation [Citation75] and is plotted in .
(19)
(19) where
and c are fatigue ductility coefficient and exponent, respectively.
Figure 13. The comparison of predicted LCF life and experimental values fitted by C–M rule: (a) O_mode-W model without defect; (b) O_mode-W model with small defect; (c) O_mode-W model with large defect.
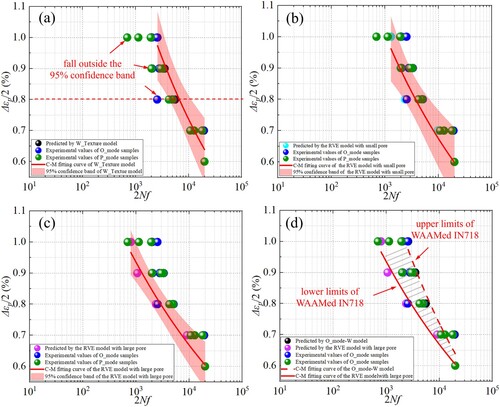
(a) shows the comparison between experimental data and predictions results of O_mode-W model (corresponds to model 1# in (a), i.e. the RVE model without pore). The 95% confidence band (light red) based on the C–M equation is also plotted. When the experimental data are covered within the confidence band of the fitting curve or on the right side of the fitting curve, it is considered to be an accurate safety assessment. Due to the small size and small count of intrinsic defects in the O_mode samples, the data points are more concentrated and well dispersed in the 95% confidence band. However, for the P_mode samples, especially when the strain amplitude is ≥ ±0.8%, more than 33% of the experimental data points fall outside the 95% confidence band. Since at high strain amplitude levels, more slip systems are activated around potential defects, accelerating the accumulation of local SED, and causing early nucleation of fatigue cracks ().
Table 3. The Coffin–Manson parameters fitted by different simulation models.
In the model 2#, all the experimental data of the O_mode sample fall within the 95% confidence band of the 2# model since the size of small pore is close to the extreme defect condition in the O_mode samples, as shown in (b). However, it still cannot accurately capture all failure data of P_mode. The RVE model with large pore (model 3# in a) complements the prediction framework. Nearly all experimental data points fall within the 95% confidence band (c) since this model considers the worst-case predictors in extreme conditions, including weak texture characteristics, the extreme position and critical size of defects.
By means of assisted crystal plasticity modelling, this simulation framework addresses the limitations of the classical C–M equation in predicting additively manufactured parts with relatively large data dispersion. As shown in (d), the upper and lower limits of the samples can be reasonably determined based on the SED criterion, which correspond to the RVE model with and without pore, respectively, and approximately unify the fatigue life prediction intervals under different processes.
6. Conclusion
Two types of IN718 samples were successfully fabricated by WAAM using two deposition strategies: parallel mode (P_mode) and oscillation mode (O_mode). The P_mode sample has a strong <100> texture and the maximum defect size is 50.85 μm, while the O_mode sample tends to exhibit a weak texture with a smaller maximum defect size of 37.46 μm.
Even though the data points in the P_mode samples are more dispersed, the LCF properties of the two processes are essentially consistent, which is closely related to the trade-off between the different crystallographic orientation and defect characteristics. The fractography analysis on fatigue fracture surfaces reveal two types of fracture mechanisms: (a) stress concentration caused by critical defects and (b) facet fracture caused by persistent slip bands.
Under cyclic loading, the Schmidt factor of the O_mode samples with weak texture fluctuates significantly, which increases the strain incompatibility between ‘soft-hard’ grains, thereby increasing the risk of local energy storage accumulation and accelerating fatigue failure. On the contrary, the strong texture characteristics in the P_mode sample is beneficial to the LCF properties.
The local storage energy density criterion well captures the high sensitivity of critical defects to fatigue crack nucleation, where the defect location has a more pronounced effect than the defect size. The spatially uneven stress state induced by critical defects promotes the activation of multiple slip systems, resulting in a substantial increase in local energy storage.
The LCF limit of WAAMed-IN718 alloy can be determined using the weak texture microstructure combined with the RVE model with large pore at the maximum strain location, which approximately unified the LCF life intervals under different deposition processes.
Disclosure statement
No potential conflict of interest was reported by the author(s).
Data availability statement
The data that support the findings of this study are available from the corresponding author, [Ke], upon reasonable request.
Additional information
Funding
References
- Radhakrishnan J, Kumar P, Li S, et al. Unnotched fatigue of Inconel 718 produced by laser beam-powder bed fusion at 25 and 600°C. Acta Mater. 2022;225:117565. doi:10.1016/j.actamat.2021.117565
- Thomas A, El-Wahabi M, Cabrera JM, et al. High temperature deformation of Inconel 718. J Mater Process Technol. 2006;177(1–3):469–472. doi:10.1016/j.jmatprotec.2006.04.072
- Zhang YN, Cao X, Wanjara P, et al. Oxide films in laser additive manufactured Inconel 718. Acta Mater. 2013;61:6562–6576. doi:10.1016/j.actamat.2013.07.039
- Cruzado A, LLorca J, Segurado J. Modeling cyclic deformation of Inconel 718 superalloy by means of crystal plasticity and computational homogenization. Int J Solids Struct. 2017;122–123:148–161. doi:10.1016/j.ijsolstr.2017.06.014
- Prithivirajan V, Sangid MD. The role of defects and critical pore size analysis in the fatigue response of additively manufactured IN718 via crystal plasticity. Mater Des. 2018;150:139–153. doi:10.1016/j.matdes.2018.04.022
- Debroy T, Wei HL, Zuback JS, et al. Additive manufacturing of metallic components – process, structure and properties. Prog Mater Sci. 2018;92:112–224. doi:10.1016/j.pmatsci.2017.10.001
- Li X, Zhang M, Fang X, et al. Improved strength-ductility synergy of directed energy deposited AZ31 magnesium alloy with cryogenic cooling mode. Virtual Phys Prototyp. 2023;18. doi:10.1080/17452759.2023.2170252
- Zhang M, Wang B, Li X, et al. Grain refinement of NiTi alloys during ultrasound-assisted wire-arc directed energy deposition. Virtual Phys Prototyp. 2024;19. doi:10.1080/17452759.2023.2289465
- Oliveira JP, Santos TG, Miranda RM. Revisiting fundamental welding concepts to improve additive manufacturing: from theory to practice. Prog Mater Sci. 2020;107:100590. doi:10.1016/j.pmatsci.2019.100590
- Sanaei N, Fatemi A. Defects in additive manufactured metals and their effect on fatigue performance: a state-of-the-art review. Prog Mater Sci. 2021;117:100724. doi:10.1016/j.pmatsci.2020.100724
- Collins PC, Brice DA, Samimi P, et al. Microstructural control of additively manufactured metallic materials. Annu Rev Mater Res. 2016;46:63–91. doi:10.1146/annurev-matsci-070115-031816
- Frazier WE. Metal additive manufacturing: a review. J Mater Eng Perform. 2014;23:1917–1928. doi:10.1007/s11665-014-0958-z
- Sames WJ, List FA, Pannala S, et al. The metallurgy and processing science of metal additive manufacturing. Int Mater Rev. 2016;61:315–360. doi:10.1080/09506608.2015.1116649
- Popovich VA, Borisov EV, Sufiiarov VS, et al. Impact of heat treatment on mechanical behaviour of Inconel 718 processed with tailored microstructure by selective laser melting. Mater Des. 2017;131:12–22. doi:10.1016/j.matdes.2017.05.065
- Seow CE, Coules HE, Wu G, et al. Wire + arc additively manufactured Inconel 718: effect of post-deposition heat treatments on microstructure and tensile properties. Mater Des. 2019;183:108157. doi:10.1016/j.matdes.2019.108157
- Xi N, Fang X, Duan Y, et al. Wire arc additive manufacturing of Inconel 718: constitutive modelling and its microstructure basis. J Manuf Process. 2022;75:1134–1143. doi:10.1016/j.jmapro.2022.01.067
- Xi N, Tang K, Fang X, et al. Enhanced comprehensive properties of directed energy deposited Inconel 718 by a novel integrated deposition strategy. J Mater Sci Technol. 2023;141:42–55. doi:10.1016/j.jmst.2022.09.026
- Xu X, Ding J, Ganguly S, et al. Investigation of process factors affecting mechanical properties of Inconel 718 superalloy in wire + arc additive manufacture process. J Mater Process Technol. 2019;265:201–209. doi:10.1016/j.jmatprotec.2018.10.023
- Zhang ZH, Zhou YH, Zhou SY, et al. Mechanically blended Al: simple but effective approach to improving mechanical property and thermal stability of selective laser-melted Inconel 718. Metall Mater Trans A. 2019;50:3922–3936. doi:10.1007/s11661-019-05299-6
- Kindermann RM, Roy MJ, Morana R, et al. Effects of microstructural heterogeneity and structural defects on the mechanical behaviour of wire + arc additively manufactured Inconel 718 components. Mater Sci Eng A. 2022;839:142826. doi:10.1016/j.msea.2022.142826
- Kirka MM, Greeley DA, Hawkins C, et al. Effect of anisotropy and texture on the low cycle fatigue behavior of Inconel 718 processed via electron beam melting. Int J Fatigue. 2017;105:235–243. doi:10.1016/j.ijfatigue.2017.08.021
- Ghorbanpour S, Sahu S, Deshmukh K, et al. Effect of microstructure induced anisotropy on fatigue behaviour of functionally graded Inconel 718 fabricated by additive manufacturing. Mater Charact. 2021;179:111350. doi:10.1016/j.matchar.2021.111350
- Prost M, Köster A, Missoum-Benziane D, et al. Anisotropy in cyclic behavior and fatigue crack growth of IN718 processed by laser powder bed fusion. Additive Manuf. 2023;61:103301. doi:10.1016/j.addma.2022.103301
- Kou S. Welding metallurgy. MRS Bull. 2003;28:674–675. doi:10.1557/mrs2003.197
- Ni M, Chen C, Wang X, et al. Anisotropic tensile behavior of in situ precipitation strengthened Inconel 718 fabricated by additive manufacturing. Mater Sci Eng A. 2017;701:344–351. doi:10.1016/j.msea.2017.06.098
- Aboulkhair NT, Simonelli M, Parry L, et al. 3D printing of aluminium alloys: additive manufacturing of aluminium alloys using selective laser melting. Prog Mater Sci. 2019;106:100578. doi:10.1016/j.pmatsci.2019.100578
- Wu B, Pan Z, Ding D, et al. A review of the wire arc additive manufacturing of metals: properties, defects and quality improvement. J Manuf Process. 2018;35:127–139. doi:10.1016/j.jmapro.2018.08.001
- Sui S, Tan H, Chen J, et al. The influence of Laves phases on the room temperature tensile properties of Inconel 718 fabricated by powder feeding laser additive manufacturing. Acta Mater. 2019;164:413–427. doi:10.1016/j.actamat.2018.10.032
- Wan H-Y, Zhou Z, Li C, et al. Enhancing fatigue strength of selective laser melting-fabricated Inconel 718 by tailoring heat treatment route. Adv Eng Mater. 2018;20. doi:10.1002/adem.201800307
- Wang QG, Apelian D, Lados DA. Fatigue behavior of A356-T6 aluminum cast alloys. Part I. Effect of casting defects. J Light Metals. 2001;1:73–84. doi:10.1016/S1471-5317(00)00008-0
- Siddique S, Awd M, Tenkamp J, et al. High and very high cycle fatigue failure mechanisms in selective laser melted aluminum alloys. J Mater Res. 2017;32:4296–4304. doi:10.1557/jmr.2017.314
- Muhammad M, Frye P, Simsiriwong J, et al. An investigation into the effects of cyclic strain rate on the high cycle and very high cycle fatigue behaviors of wrought and additively manufactured Inconel 718. Int J Fatigue. 2021;144:106038. doi:10.1016/j.ijfatigue.2020.106038
- Dodaran MS, Muhammad M, Shamsaei N, et al. Synergistic effect of microstructure and defects on the initiation of fatigue cracks in additively manufactured Inconel 718. Int J Fatigue. 2022;162:107002. doi:10.1016/j.ijfatigue.2022.107002
- Asaro RJ. Crystal plasticity. J Appl Mech. 1983;50(4b):921–934. doi:10.1115/1.3167205
- Bandyopadhyay R, Sangid MD. Crystal plasticity assessment of inclusion- and matrix-driven competing failure modes in a nickel-base superalloy. Acta Mater. 2019;177:20–34. doi:10.1016/j.actamat.2019.07.024
- Dunne FPE, Wilkinson AJ, Allen R. Experimental and computational studies of low cycle fatigue crack nucleation in a polycrystal. Int J Plast. 2007;23(2):273–295. doi:10.1016/j.ijplas.2006.07.001
- Korsunsky A, Dini D, Dunne F, et al. Comparative assessment of dissipated energy and other fatigue criteria. Int J Fatigue. 2007;29(9–11):1990–1995. doi:10.1016/j.ijfatigue.2007.01.007
- Sweeney CA, Vorster W, Leen SB, et al. The role of elastic anisotropy, length scale and crystallographic slip in fatigue crack nucleation. J Mech Phys Solids. 2013;61(5):1224–1240. doi:10.1016/j.jmps.2013.01.001
- Cao M, Liu Y, Dunne FPE. A crystal plasticity approach to understand fatigue response with respect to pores in additive manufactured aluminium alloys. Int J Fatigue. 2022;161:106917. doi:10.1016/j.ijfatigue.2022.106917
- Lian Z, Li M, Lu W. Fatigue life prediction of aluminum alloy via knowledge-based machine learning. Int J Fatigue. 2022;157:106716. doi:10.1016/j.ijfatigue.2021.106716
- Yang J, Kang G, Liu Y, et al. A novel method of multiaxial fatigue life prediction based on deep learning. Int J Fatigue. 2021;151:106356. doi:10.1016/j.ijfatigue.2021.106356
- Peng X, Wu S, Qian W, et al. The potency of defects on fatigue of additively manufactured metals. Int J Mech Sci. 2022;221:107185. doi:10.1016/j.ijmecsci.2022.107185
- Liu P, Jiang H, Dong J, et al. Effect of micron-scale nonmetallic inclusions on fatigue crack nucleation in a nickel-based superalloy. Int J Solids Struct. 2023;279:112368. doi:10.1016/j.ijsolstr.2023.112368
- Aerospace, S.a.E. Aerospace Material Specification: AMS 5383. SAE International; 2012.
- Xi N, Ni Z, Fang X, et al. Role of δ-phase on mechanical behaviors of additive manufactured Inconel 718: Detailed microstructure analysis and crystal plasticity modelling. Int J Plast. 2023;168:103708. doi:10.1016/j.ijplas.2023.103708
- Alonso U, Veiga F, Suárez A, et al. Characterization of Inconel 718® superalloy fabricated by wire arc additive manufacturing: effect on mechanical properties and machinability. J Mater Res Technol. 2021;14:2665–2676. doi:10.1016/j.jmrt.2021.07.132
- Bhujangrao T, Veiga F, Suárez A, et al. High-temperature mechanical properties of IN718 alloy: comparison of additive manufactured and wrought samples. Crystals (Basel). 2020;10:689. doi:10.3390/cryst10080689
- Wang K, Liu Y, Sun Z, et al. Microstructural evolution and mechanical properties of Inconel 718 superalloy thin wall fabricated by pulsed plasma arc additive manufacturing. J Alloys Compd. 2020;819:152936. doi:10.1016/j.jallcom.2019.152936
- Xu X, Ganguly S, Ding J, et al. Enhancing mechanical properties of wire + arc additively manufactured Inconel 718 superalloy through in-process thermomechanical processing. Mater Des. 2018;160:1042–1051. doi:10.1016/j.matdes.2018.10.038
- Kalentics N, Huang K, Ortega Varela de Seijas M, et al. Laser shock peening: a promising tool for tailoring metallic microstructures in selective laser melting. J Mater Process Technol. 2019;266:612–618. doi:10.1016/j.jmatprotec.2018.11.024
- Li X, Zhang Y, Zhou S, et al. Very high cycle fatigue of a nickel-based superalloy at room and elevated temperatures: Interior failure behavior and life prediction. Int J Fatigue. 2021;151:106349. doi:10.1016/j.ijfatigue.2021.106349
- Liu G, Winwood S, Rhodes K, et al. The effects of grain size, dendritic structure and crystallographic orientation on fatigue crack propagation in IN713C nickel-based superalloy. Int J Plast. 2020;125:150–168. doi:10.1016/j.ijplas.2019.09.010
- Li WB, Pang JC, Zhang H, et al. The high-cycle fatigue properties of selective laser melted Inconel 718 at room and elevated temperatures. Mater Sci Eng A. 2022;836:142716. doi:10.1016/j.msea.2022.142716
- Asaro RJ, Needleman A. Overview no. 42 texture development and strain hardening in rate dependent polycrystals. Acta Metall. 1985;33:923–953.
- Bronkhorst CA, Mayeur JR, Livescu V, et al. Structural representation of additively manufactured 316L austenitic stainless steel. Int J Plast. 2019;118:70–86. doi:10.1016/j.ijplas.2019.01.012
- Eghtesad A, Knezevic M. A full-field crystal plasticity model including the effects of precipitates: application to monotonic,: load reversal, and low-cycle fatigue behavior of Inconel 718. Mater Sci Eng A. 2021;803:140478. doi:10.1016/j.msea.2020.140478
- Ghorbanpour S, Zecevic M, Kumar A, et al. A crystal plasticity model incorporating the effects of precipitates in superalloys: application to tensile, compressive, and cyclic deformation of Inconel 718. Int J Plast. 2017;99:162–185. doi:10.1016/j.ijplas.2017.09.006
- Frederick CO, Armstrong PJ. A mathematical representation of the multiaxial Bauschinger effect. Mater High Temp. 2007;24:1–26. doi:10.3184/096034007(207589
- White CS, Bronkhorst CA, Anand L. An improved isotropic—kinematic hardening model for moderate deformation metal plasticity. Mech Mater. 1990;10:127–147. doi:10.1016/0167-6636(90)90023-9
- Gupta S, Bronkhorst CA. Crystal plasticity model for single crystal Ni-based superalloys: capturing orientation and temperature dependence of flow stress. Int J Plast. 2021;137:102896. doi:10.1016/j.ijplas.2020.102896
- Anand L, Kothari M. A computational procedure for rate-independent crystal plasticity. J Mech Phys Solids. 1996;44:525–558. doi:10.1016/0022-5096(96)00001-4
- Bertin N, Capolungo L, Beyerlein IJ. Hybrid dislocation dynamics based strain hardening constitutive model. Int J Plast. 2013;49:119–144. doi:10.1016/j.ijplas.2013.03.003
- Lee S, Cho H, Bronkhorst CA, et al. Deformation, dislocation evolution and the non-Schmid effect in body-centered-cubic single- and polycrystal tantalum. Int J Plast. 2023;163:103529. doi:10.1016/j.ijplas.2023.103529
- Wan VVC, Jiang J, MacLachlan DW, et al. Microstructure-sensitive fatigue crack nucleation in a polycrystalline Ni superalloy. Int J Fatigue. 2016;90:181–190. doi:10.1016/j.ijfatigue.2016.04.013
- Wan VVC, MacLachlan DW, Dunne FPE. A stored energy criterion for fatigue crack nucleation in polycrystals. Int J Fatigue. 2014;68:90–102. doi:10.1016/j.ijfatigue.2014.06.001
- Chen B, Jiang J, Dunne FPE. Is stored energy density the primary meso-scale mechanistic driver for fatigue crack nucleation? Int J Plast. 2018;101:213–229. doi:10.1016/j.ijplas.2017.11.005
- Lu X, Dunne FPE, Xu Y. A crystal plasticity investigation of slip system interaction, GND density and stored energy in non-proportional fatigue in Nickel-based superalloy. Int J Fatigue. 2020;139:105782. doi:10.1016/j.ijfatigue.2020.105782
- Kamlah M, Haupt P. On the macroscopic description of stored energy and self heating during plastic deformation. Int J Plast. 1997;13:893–911. doi:10.1016/S0749-6419(97)00063-6
- Rusinek A, Klepaczko JR. Experiments on heat generated during plastic deformation and stored energy for TRIP steels. Mater Des. 2009;30:35–48. doi:10.1016/j.matdes.2008.04.048
- Zhang X, Zhao J, Kang G, et al. Geometrically necessary dislocations and related kinematic hardening in gradient grained materials: a nonlocal crystal plasticity study. Int J Plast. 2023;163:103553. doi:10.1016/j.ijplas.2023.103553
- Lin B, Zhao LG, Tong J. A crystal plasticity study of cyclic constitutive behaviour, crack-tip deformation and crack-growth path for a polycrystalline nickel-based superalloy. Eng Fract Mech. 2011;78(10):2174–2192. doi:10.1016/j.engfracmech.2011.04.006
- Hu Y, Niu Y, Zhang Q, et al. Synergistic effect of Laves phase evolution and porosity defects in nuclear-grade FeCrAl alloy laser welded joints: experiments and crystal plasticity modeling. Opt Laser Technol. 2023;157:108694. doi:10.1016/j.optlastec.2022.108694
- Shen J, Fan H, Wang J, et al. Stored energy density research on the fatigue crack initiation at twin boundary and life prediction of Inconel718 superalloy. Int J Fatigue. 2023;171:107590. doi:10.1016/j.ijfatigue.2023.107590
- Ye W, Akram J, Mushongera LT. Fatigue behavior of additively manufactured IN718 with columnar grains. Adv Eng Mater. 2021;23; doi:10.1002/adem.202001031
- Balasubramanian S-S, Philpott C, Hyder J, et al. Testing techniques and fatigue of additively manufactured Inconel 718 – a review. Int J Eng Mater Manuf. 2020;5:156–194. doi:10.26776/ijemm.05.04.2020.05