
 ?Mathematical formulae have been encoded as MathML and are displayed in this HTML version using MathJax in order to improve their display. Uncheck the box to turn MathJax off. This feature requires Javascript. Click on a formula to zoom.
ABSTRACT
Laser powder bed fusion (LPBF) of multi-scaled structures is a prominent direction pursued by innovative designs and engineering applications. However, understanding the impact of scale effect on the effectiveness of actual structures is a pressing challenge. This work investigates the influence of structure scale on surface morphology and mechanical property by fabricating tensile samples with gauge diameters ranging from 0.2 mm to 5.0 mm. For the hatching scanning strategy, the surface roughness drastically reduces by ∼51% as the diameter increases. This appears to be the coupling results of heat accumulation, molten pool morphology at the end of single-track, overlap between multi-tracks within a layer, and successive rotational buildup between layers. Moreover, decreasing the diameter substantially reduces the tensile strength. Fortunately, a hatching-contour scanning strategy is proposed to eliminate the scale effect of surface morphology and strength. These efforts provide essential guidance for the broader application of multi-scaled structures.
Highlights
Structure scale significantly influences the surface morphology and mechanical properties of small-scaled structures.
The scale effect of surface morphology seems to be attributed to heat accumulation, molten pool morphology, overlap of multi-tracks, and successive rotational buildup.
Hatching-contour scanning strategy is proposed to eliminate the scale effect of surface morphology and tensile strength.
Tensile strength and surface roughness exhibit a strong correlation with the change in structure scale.
1. Introduction
As a representative technique of high-performance metal additive manufacturing, laser powder bed fusion (LPBF) has outstanding advantages in directly fabricating complex structures [Citation1–6]. The unique fine microstructure usually results in excellent mechanical properties for this technology. However, the testing of these properties mainly comes from the standard millimeter-scaled samples with mechanically machined smooth surfaces. The impact of original surface defects is usually neglected. The surface quality of laser powder bed fused (LPBF-ed) parts is one of the main challenges that dissatisfy the industry [Citation1,Citation3–5]. The rough and jagged surface negatively impacts dimension accuracy and mechanical properties [Citation7–9]. Furthermore, eliminating surface defects for those LPBF-ed parts with sophisticated internal structures is technically difficult, time-consuming, and expensive. Therefore, extensive research has been conducted on the original surface morphology for the further popularisation of LPBF [Citation1,Citation3–5,Citation7–14]. The powder’s state, processing parameters, building orientations, and geometrical shapes of the designed part are the key factors affecting the surface quality. High surface roughness is generally attributed to balling, spattering, satellite powder, staircase effect, infiltration effect, and molten pool variability. Moreover, those investigations based on physical modelling indicated that the surface adherent powder and the thermodynamics and hydrodynamics of the molten pool both played a crucial role in influencing the surface morphology [Citation15,Citation16]. Note, however, that the vast majority of those studies for LPBF manufacturing on the surface morphology took the millimeter-scaled cubes as the research objects.
In reality, common-used commercial LPBF machines typically employ laser beam diameters of 70–100 μm [Citation5,Citation6]. It allows LPBF to fabricate submillimeter-scaled structures with a minimum feature scale of 200 μm [Citation17–19], as well as multi-scaled structures with a maximum scale of several hundred millimetres [Citation18–21]. This versatility makes LPBF well-suited for manufacturing lightweight, functional, and integrated structures in the fields of aviation and aerospace, thereby offering promising application prospects. It is important to note that to pursue high efficiency and reduce costs, the hatching scanning strategy (H) is used to fabricate the LPBF-ed miniature structures in industrial production, e.g. lattice structures.
Despite numerous current studies focusing on fixed millimeter-scaled samples for scientific research, a few still noticed the influence of structure scale on surface morphology. Wan et al. [Citation22] determined that when the thickness of thin-walled parts increased from 1.3 mm to 3.3 mm, the surface roughness increased by ∼19% to ∼15.7 μm as more unfused powders adhered to the surface. Conversely, Zhang et al. [Citation23] observed a sharp decrease in surface roughness of thin-walled parts, with a decrease of ∼63% to ∼5.8 μm as the thickness increased from 0.5 mm to 2.0 mm. Adherent powder and molten pool ridges were identified as the main factors affecting surface fluctuations. Furthermore, research on thin struts and thin walls can also indirectly reflect the surface morphology evolution caused by the change of structure scale. Poncelet et al. [Citation24] discovered that the surface roughness of thin walls with a thickness of 300 μm was as high as ∼24.8 μm, exceeding that of the millimeter-scaled cubes [Citation14]. This could be attributed to the slight liquid overflow caused by the wetting between the molten pool and the surrounding solidified molten pool. Yu et al. [Citation25] declared that the surface roughness of the thin strut with a diameter of 0.4 mm in the lattice structure ranges from ∼30.0 μm to ∼60.0 μm. These values were significantly higher than those of the millimeter-scaled cubes [Citation14]. The high roughness was due to the molten pool formation and the solidification of unmelt powders resulted from the balling phenomenon. Some literature reviews of LPBF-ed lattice structures [Citation17–19] and heat exchangers [Citation26] also indicated that approaching the fabrication limits of LPBF machines often resulted in higher surface roughness. These discussions suggest that the response of surface roughness is likely related to the structure scale. It is speculated that the LPBF technology is characterised by the scale effect, similar to what has been reported in the electron beam powder bed fusion (EBPBF) technology [Citation27].
To sum up, some studies have realised that the impact of structure scale on surface morphology. It can be deduced that the surface morphology inevitably changes with the structure scale further decreasing. Nevertheless, these scale effect researches have not directly explored the surface morphology of structures approaching the fabrication limits of LPBF machines, which is crucial for industrial production. The surface morphology of such small-scaled structures can only be referenced from other research. Thus, the current studies cannot fully reflect the influence of structure scale on surface morphology. Moreover, the analysis of potential reasons for the scale effect of surface morphology is superficial and controversial. The influence of adherent powder and molten pool was briefly mentioned without substantial evidence. Importantly, the LPBF-ed multi-scaled structures often contain numerous and sophisticated small-scaled structures. Thereby, the crucial influence of scale effect is not adequately considered in the current design and manufacturing of multi-scaled structures. The notable disparity between the design goal and the actual LPBF-ed components in function/performance effects is exhibited. It is also clear that surface morphology has a remarkable influence on mechanical properties. Unfortunately, the targeted in-depth research on the surface morphology of those small-scaled structures is scarce, indicating a lack of attention to the effect of structure scale on surface morphology. Therefore, the comprehensive research for the scale effect of surface morphology is urgent.
In this work, the influence of structure scale from 0.2 to 5.0 mm on the surface morphology with the strategy H is firstly systematically investigated, to deeply explore the scale effect in LPBF technology. The evolution mechanism for the scale-dependent behaviour of surface morphology is revealed by using the numerical simulation method. Then a targeted solution to effectively improve the scale effect of surface morphology is proposed. Additionally, the relationship between surface roughness and mechanical properties with the variation of structure scale is exhibited. This study will serve as a solid scientific foundation for the optimisation design and processing control of those multi-scaled structures in the high-end fields.
2. Experimental and simulated details
2.1. Sample manufacturing
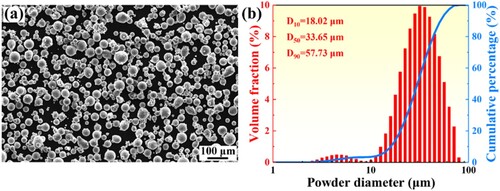
All tensile samples used for the scale effect research were manufactured by LPBF on a commercial BLT-S310 machine. Referring to the standard ASTM E8/E8M-22, the geometry and dimension of samples used for testing the tensile strength are depicted in a. Notably, the surface morphology of the gauge is the research object. The total length and gauge length of tensile samples are fixed at 34 and 12 mm, respectively. The gauge diameters (d0) range from 0.2 mm to 5.0 mm. b presents the schematic of the strategy H equipping with a back-forth scanning mode. The rotation angle of the laser scanning direction between layers is 67°. The material used for sample manufacturing is the pre-alloyed TiB2/Al-Si powder, which has been proven suitable for LPBF technology [Citation28,Citation29]. The morphology and size distribution of powder are displayed in . The laser power, scanning speed, hatching spacing, and layer thickness of the strategy H were set to 320 W, 1300 mm/s, 0.15, and 0.03 mm, respectively. The locating position of these samples on the substrate and all LPBF-ed samples are shown in c,d, respectively. It is worth mentioning that the LPBF-ed miniature structures with a minimum scale of 200 μm are successfully achieved using a laser spot diameter of 100 μm. In this study, the typical samples with the d0 of 0.2, 0.6, 1.0, 2.0, and 5.0 mm are selected to investigate the influence of scale effect on surface morphology.
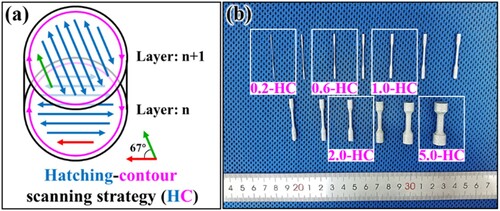
Figure 1. (a) The designed tensile samples for the scale effect research of laser powder bed fusion (LPBF) are used for testing the tensile strength; the schematics of (b) the hatching scanning strategy (H) and (c) the locating position of these samples on the substrate; (d) the laser powder bed fused (LPBF-ed) samples fabricated using the strategy H.
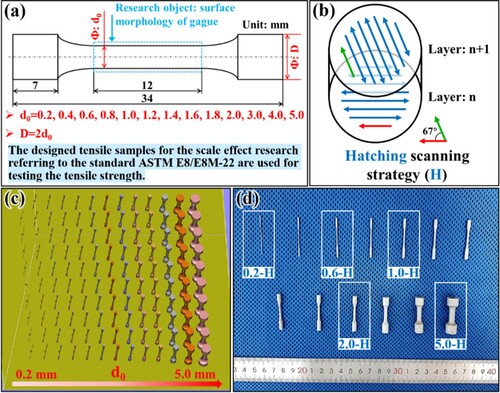
Figure 2. (a) The morphology and (b) particle size distribution of the powder.
2.2. Surface morphology characterisation and surface roughness measurement
To determine the average d0 of the tensile samples, measurements were taken at three different locations using a micrometer caliper. The surface morphology of the gauge was imaged with the scanning electron microscope (SEM). Then the detailed 3D surface morphology with height diagrams was evaluated using a MarSurf CM expert optical profilometer. By using the function of ‘Remove Form’ of the commercial MountainsMap Software, the cylinder-shaped side surface of the gauge can be converted into a two-dimensional plane. This is a default automatic process feature of the popularly-used software. The surface roughness Rz and Ra were also extracted following the standard ISO 4287. The maximum height of value Rz and arithmetic average deviation of value Ra are determined by Eq. (1) and Eq. (2), respectively.
(1)
(1)
(2)
(2) Additionally, the cross-sections of the gauge parallel and perpendicular to the building direction were used to characterise the surface profile and molten pool morphology using an optical microscope (OM). The cross-sections were ground with waterproof abrasive paper, polished with mixed solution of SiO2 and H2O2, and etched with Keller’s reagent in sequence. The surface profile curves were also extracted from the corresponding OM images using Photoshop software. Finally, the surface roughness Rz and Ra were also calculated from the extracted surface profile curves using Eq. (1) and Eq. (2). It should be noted that the surface roughness mentioned in this study refers to line roughness.
2.3. Tensile testing
All LPBF-ed tensile samples maintained their original surface state without any post-processing. The monotonic tensile tests were conducted using a Zwick electronic universal testing machine at room temperature. The tensile loading direction aligned with the building direction of the LPBF-ed sample. A constant strain rate was 0.5 mm/min, and a non-contact laser extensometer with a gauge length of 10 mm was used.
2.4. Numerical simulation
To reveal the evolution mechanism for the scale effect of surface morphology, a high computational efficiency height function-lattice Boltzmann method (HF-LBM) model developed by our team was used. Detailed information about the model was seen in Refs. [Citation15,Citation30]. This model comprehensively considers various factors, including random distribution of powder, laser energy absorption, gravity, surface tension, Marangoni convection, evaporation, recoil pressure, thermal radiation, convection heat transfer, and thermal conduction on the flow and temperature fields of the molten pool. Further details of this simulation can be found in Supplementary Material.
3. Results
3.1. Surface morphology
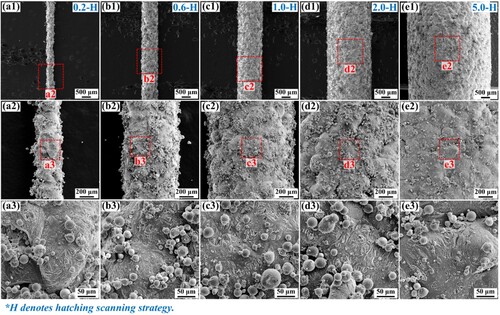
presents the surface morphology of the 0.2-H, 0.6-H, 1.0-H, 2.0-H, and 5.0-H samples. The unfused powders adhere to the surface, mainly due to the metallurgical bond between the molten pool at the end of the scanning track and the unmelted powder [Citation31]. There appears to be no obvious difference in the quantity and distribution of surface powder among samples with different d0. However, the surface morphology shows evident scale-dependent behaviour, with noticeable improvement in surface fluctuation as the d0 increases. Especially, the fluctuation of the 0.2-H sample is exceptionally pronounced.
Figure 3. SEM images with different magnifications showing the surface morphology of the (a1-a3) 0.2-H, (b1-b3) 0.6-H, (c1-c3) 1.0-H, (d1-d3) 2.0-H, and (e1-e3) 5.0-H samples, respectively.
3.2. Surface profile and surface roughness
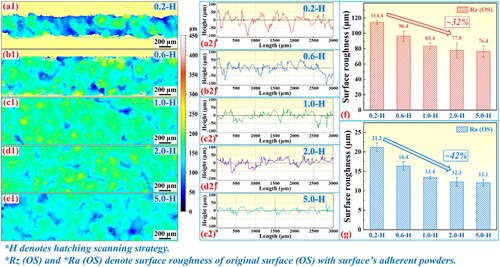
a1–e1 reveal a peak-valley structure in the surface morphology. Notably, this 3D surface represents the original surface, which is the coupling embodiment of the surface adherent powder and surface fluctuation. Since there is minimal difference in the adherent powder, the colour variation directly reflects the change in surface fluctuation. The surface of the 5.0-H sample appears relatively flat, while the surface of the 0.2-H sample shows significant fluctuation. These findings align with the SEM observation (). To quantitatively characterise the surface quality, the typical surface fluctuation curves are extracted from a1–e1, as shown in a2–e2. The comparison of surface roughness Rz (OS) and Ra (OS) is exhibited in f,g. It is evident that surface roughness shows a strong scale correlation. The roughness displays a downward trend with increasing the d0. The Rz (OS) and Ra (OS) of the 0.2-H sample are ∼114.4 μm and ∼21.2 μm, respectively. Whereas these values of the 2.0-H sample reduce by ∼32% and ∼42% (∼77.8 μm and ∼12.3 μm), respectively. This confirms the presence of a significant scale effect in surface morphology. Notice, however, that when the d0 increases to 2.0 mm, the surface roughness tends to be stable. The Rz (OS) and Ra (OS) steadily remain within the range of 76.4∼77.8 μm and 12.1∼12.3 μm, respectively.
Figure 4. The height diagram of the original surface (OS) for the (a1) 0.2-H, (b1) 0.6-H, (c1) 1.0-H, (d1) 2.0-H, and (e1) 5.0-H samples, respectively; the surface fluctuation curves in (a2-e2) are extracted from the height diagrams in (a1-e1); the comparison of surface roughness (f) Rz (OS) and Ra (OS) between the 0.2-H, 0.6-H, 1.0-H, 2.0-H, and 5.0-H samples.
The surface profile and molten pool morphology of the gauge are also determined by the OM images (a1–e1). It can be observed that the actual surface profiles are minimally affected by the adherent powders. Instead, the molten pool morphology in the marginal zones seems to be the primary factor influencing surface fluctuation. The extremely irregularly shaped molten pool is exhibited in the 0.2-H sample, resulting in poor surface quality. As the d0 increases, the surface quality gradually improves. However, compared to the central zones, irregular and large molten pools are generally observed in the marginal zones. Particularly, the molten pool morphology in the marginal zones for the 2.0-H and 5.0-H samples gradually becomes more regular. To further confirm the correlation between surface morphology and d0, the surface profile curves are also extracted from the OM images, as shown in a2–e2. The surface roughness Rz (SP) and Ra (SP) are calculated using Eq. (1) and Eq. (2), respectively. The comparison of the Rz (SP) and Ra (SP) (f,g) also demonstrates the strong scale-dependent behaviour of surface roughness. The Rz (SP) and Ra (SP) for the 0.2-H sample are ∼200.0 μm and ∼35.4 μm, respectively. In contrast, these values for the 2.0-H sample reduce by ∼45% and ∼51% (∼109.8 μm and ∼17.5 μm), respectively. When the d0 exceeds 2.0 mm, the Rz (SP) and Ra (SP) remain steady at 109.8∼109.9 μm and 17.5∼17.6 μm, respectively. Notably, the variation trend of these values is consistent with those presented in f,g.
Figure 5. OM images showing the surface profile (SP) and molten pool morphology of the (a1) 0.2-H, (b1) 0.6-H, (c1) 1.0-H, (d1) 2.0-H, and (e1) 5.0-H samples, respectively; the surface profile curves in (a2–e2) are extracted from the OM images in (a1–e1); the comparison of surface roughness (f) Rz (SP) and (g) Ra (SP) between the 0.2-H, 0.6-H, 1.0-H, 2.0-H, and 5.0-H samples.
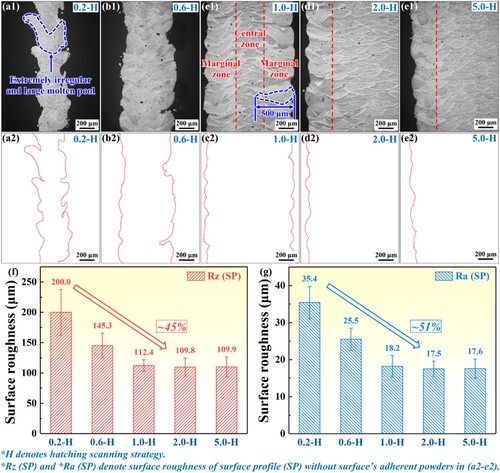
Nonetheless, the Rz (SP) and Ra (SP) are always higher than the Rz (OS) and Ra (OS). It indicates that the former can better reflect the actual surface fluctuations. When measuring the original surface with an optical profilometer (), the surface adherent powders tend to cover the concave features of the surface. This induces an overall decrease in the surface roughness of the original surface. Based on the above results, it can be preliminarily concluded that these abnormal molten pools in the marginal zones should be responsible for the scale effect of surface morphology.
Furthermore, it is essential to recognise that surface waviness is also an indicator in evaluating surface quality. However, according to the standard ISO 4287, surface roughness is deemed a more suitable parameter for characterising the surface quality in LPBF. This viewpoint has also been proven by numerous studies [Citation1–6]. The results in and also demonstrate that the ripples of the LPBF-ed samples are irregular with the wave distance significantly less than 0.3 mm. This contrasts with techniques such as directed energy deposition (DED) [Citation32] and wire arc additive manufacturing (WAAM) [Citation33], where surface waviness, characterised by periodic ripples with wave distances greater than 1 mm, is utilised to assess surface quality. Of course, the potential application of surface waviness as a quality indicator in LPBF merits exploration and verification in future research.
3.3. Tensile strength
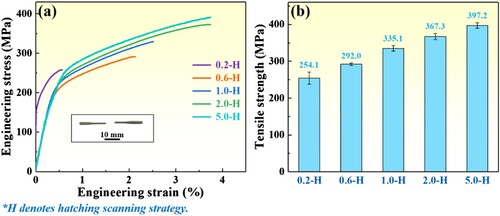
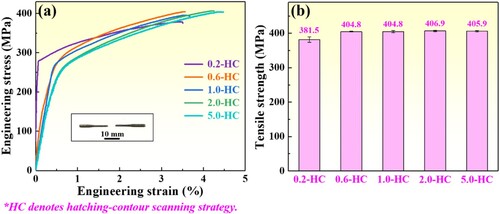
exhibits the tensile strengths of the 0.2-H, 0.6-H, 1.0-H, 2.0-H, and 5.0-H samples, respectively. This provides strong evidence of a significant scale effect on tensile strength. The strength increases rapidly by ∼45% from 254.1 MPa for the 0.2-H sample to 367.3 MPa for the 2.0-H sample. Particularly, the strength of the 0.2-H sample is only half of the standard tensile sample (∼517.3 MPa) [Citation29]. However, increasing the d0 results in a sharp increase in strength when the d0 is less than 2.0 mm. Subsequently, the strength slowly increases within the range of 2.0∼5.0 mm in d0, and it remains a relatively high range of 367.3∼397.2 MPa. It is noteworthy that the mechanical behaviour of the 0.2-H sample differs from that of the other samples. This discrepancy may be attributed to the equal preloads to samples with different scales. The results of the obtained tensile data indicate that except for the 5.0-H sample, the preloads are consistently maintained within the range of 8∼11 N. However, the 0.2-H sample, with its exceptionally low load-bearing area, experiences a highest initial engineering stress (∼90.7 MPa). The elastic deformation stage for this sample is narrow and is more susceptible to the increasing loads. Even a slight increase in load can cause the 0.2-H sample to rapidly transition through the elastic deformation stage, resulting in an abnormal curve. While there may be other factors contributing to the abnormal curve, and further investigation is required to fully understand these influences. Importantly, the primary focus of this study is on fracture strength, and thus, the abnormal curve of the 0.2-H sample does not impact the final research conclusions. Based on the results of the surface morphology, an inversely proportional relationship between tensile strength and surface roughness is found with the condition of scale effect. Moreover, it can be seen from the results of that the d0 of 2.0 mm should be the threshold for the scale effect research of LPBF technology in this study.
Figure 6. The (a) engineering stress-strain curves and (b) tensile strengths of the 0.2-H, 0.6-H, 1.0-H, 2.0-H, and 5.0-H samples, respectively.
4. Discussion
4.1. Influence mechanism of scale effect on surface morphology
In the present study, the evident scale effect of surface morphology for the LPBF technology is exhibited. To facilitate the discussion, the surface roughness mentioned next refers to the Ra(SP). The Ra (SP) decreases rapidly as the d0 increases until it stabilises after the d0 exceeds 2.0 mm. The roughness of the 0.2-H sample (∼35.4 μm) remarkably exceeds that of the 2.0-H sample (∼17.5 μm) by ∼102%. This result is consistent with the findings reported by Zhang et al. [Citation23]. The adsorption force of the molten pool on the powder rose as the thickness of thin-walled parts increased, leading to higher surface roughness. A reverse result tendency was obtained by Wan et al. [Citation22]. Interestingly, the possible reason was also considered as the unfused powders attached to the surface [Citation31]. Since the powder melting in the thicker sample required more energy input, more unfused powder particles bonded to the side surface, resulting in a rougher surface for the thicker sample. Safdar et al. [Citation34] also reported a similar result for the EBPBF technology. It appears that the surface adherent powders are considered responsible for the scale effect of surface morphology. Regrettably, there is a lack of supporting evidence. Moreover, these explanations are not suitable for explaining the observed phenomenon of this work. The results in have demonstrated that the d0 has little effect on the amount and distribution of the surface adherent powders. Fortunately, a noteworthy finding is that the scale-dependent behaviour of surface morphology seems to be attributed to the abnormal molten pools distributed in the marginal zones. The smaller the d0, the more abnormal the morphology of these molten pools. Nevertheless, the underlying mechanism has not yet been explored.
4.1.1. Heat accumulation
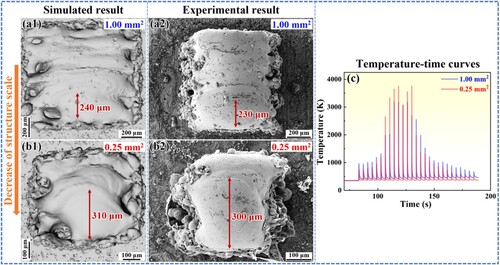
The LPBF-ed part is the result of deposition processes involving multi-layers multi-tracks. Thus, to gain deeper insight into the influence mechanism of scale effect on surface morphology, the deposition processes of 50 layers for the LPBF-ed samples with different cross-sectional areas (1.00 and 0.25 mm2) were simulated. The establishment of this multiscale numerical model with multi-layers multi-tracks can be found in Ref. [Citation30]. Other simulation details are provided in Supplementary Material. It can be intuitively seen that the smaller the cross-sectional area, the more significant the fluctuation on the side surface (). This observation aligns with the results () of this study, further supporting the understanding of the scale effect of surface morphology. Moreover, the simulated result in a1 indicates that the molten pool width for a cross-sectional area of 1.00 mm2 is only ∼240 μm. However, the value for a cross-sectional area of 0.25 mm2 is ∼310 μm (b1). The experimental results in a2 and b2 confirm the simulation accuracy, as also evidenced by Refs. [Citation15,Citation30]. These can reflect that the small-scaled structure exhibits strong heat accumulation with a low heat dissipation capacity. As demonstrated in Refs. [Citation30,Citation35,Citation36], the enlargement of molten pool width indeed reflected the more apparent heat accumulation effect. Both the simulated and experimental results reported by Hao et al. [Citation30] indicated that heat accumulation can be reflected by the widening of the melt tracks. Liu et al. [Citation35] reasonably illustrated that the accumulated heat significantly increased the width and depth of the molten pool from the simulated and experimental results of single-track and multi-tracks. The molten pool size can be accurately predicted by fully considering the heat accumulation between the melt tracks. Kazemi et al. [Citation36] used the simulation method to prove that the accumulated heat affected the maximum temperature of the deposition layers, thus increasing the molten pool size. Fortunately, the result in c also supports this viewpoint. The peak temperatures with a cross-sectional area of 0.25 mm2 are always higher than those with a cross-sectional area of 1.00 mm2, resulting in a larger molten pool size. It indicates that the heat dissipation in small-scaled structures is more easily hindered. These analyses suggest that although the same processing parameters are used, the accumulated heat of LPBF-ed samples with different d0 exhibits a significant scale effect. Thus, there is a correlation between the surface morphology and accumulated heat when considering the scale effect. Next, the influence of d0 on heat accumulation is discussed in detail.
Figure 7. The simulated and experimental results for the molten pool morphology in the LPBF-ed samples with different cross-sectional areas: (a1) and (a2) 1.00 mm2; (b1) and (b2) 0.25 mm2; (c) the comparison of the temperature-time curves of samples in (a1) and (b1).
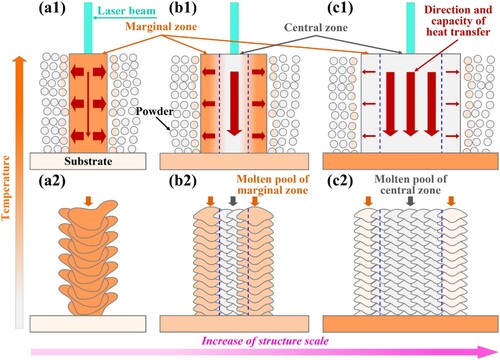
For millimeter-scaled LPBF-ed parts, there is a widely recognised consensus that heat loss primarily occurs through transmission to the substrate via the deposition layers. The substrate, being in a low-temperature state, often leads to a high rate of heat dissipation. To better understand the heat dissipation process of LPBF-ed samples with different d0, the schematic illustration of heat transfer is vividly exhibited in . Dong et al. [Citation37] and Takata et al. [Citation38] have reported that the heat transfer area can represent the heat dissipation capacity. The colour gradient from gray to orange denotes the temperature from low to high. This temperature is the result of the accumulated heat. Generally, the heat transfer area is proportional to the d0. Thereby, the small-scaled structure corresponds to the slow heat transfer efficiency. Moreover, the heat transfer area of the 5.0-H sample (∼19.63 mm2) is ∼625 times that of the 0.2-H sample (∼0.03 mm2). It means that when the deposition layers are at a fixed height, small-scaled structures inevitably dissipate heat to the surrounding powder bed. The direction of heat loss is perpendicular to the building direction. Nevertheless, Zhang et al. [Citation39] stated that the presence of gas within the powder gaps significantly reduces the thermal conductivity of the powder. The thermal conductivity of the aluminium powder bed (∼0.25 W·m−1·K−1) is far lower than that of the solidified part (∼240 W·m−1·K−1). As for the 0.2-H sample with an extremely low heat transfer area, the heat absorbed by the molten pool cannot be exported in time, thus rapidly accumulating in the deposition layers. Therefore, small-scaled structures continuously accumulate heat during the LPBF process. The lower heat dissipation capacity of these structures leads to a more significant heat accumulation effect. As a result, the ambient temperature of deposited layers increases, which in turn enhances the temperature and prolongs the solidification time of the molten pool. Furthermore, it can be considered that each layer has only a single molten pool for the melting and solidification processes due to the minimum d0 (∼200 μm) of the 0.2-H sample. This single molten pool is rapidly formed in an extremely short time (∼1.5 × 10⁻⁴ s). This inevitably leads to a remarkable difference in heat accumulation between the submillimeter-scaled structures and the widely used millimeter-scaled structures. Therefore, understanding the morphology of a single molten pool is an essential consideration affecting the surface morphology.
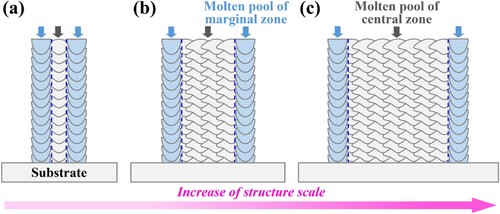
Figure 8. The schematic illustration of the heat transfer and molten pool morphology in the marginal and central zones for the (a1 and a2) 0.2-H, (b1 and b2) 0.6-H and 1.0-H, and (c1 and c2) 2.0-H and 5.0-H samples, respectively. The arch-shaped regions with orange filling colour are the molten pools of marginal zones, while those with gray filling colour are the molten pools of central zones. The red arrows represent the heat transfer direction, and the arrow area reflects the heat transfer capacity. The blue dashed line represents the boundary between the marginal zone and the central zone.
4.1.2. Molten pool morphology at the end of single-track with different lengths
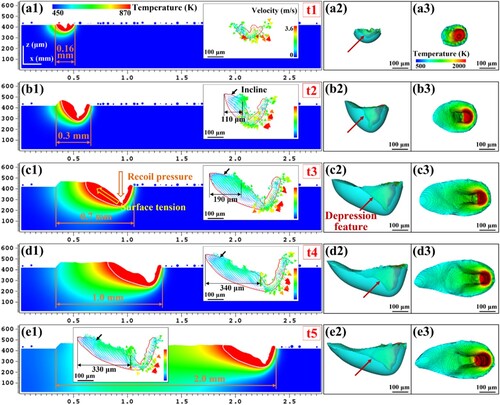
The molten pool morphology at the end of the single-track with different lengths was simulated, as shown in . The simulation details can be found in Supplementary Material. The 3D morphology of the molten pools was also extracted. Due to the combined effects of surface tension, recoil pressure, and Marangoni force [Citation15,Citation30], the molten pool always presents an irregular morphology with noticeable depression features. One surprising finding is that there are significant differences in the molten pool morphology with increasing single-track length. It indicates that, apart from heat accumulation, the scale-dependent behaviour of surface morphology is also influenced by the varying morphology of the molten pool at the end of laser scanning tracks. However, the molten pool morphologies at the end of single-track with lengths of ∼0.16 mm, ∼0.3 mm, and ∼0.7 mm are notably different from those with other single-track lengths (a1–c3). Particularly, the tail end of the molten pool with a single-track length of ∼0.3 mm is more prone to inclination due to the unstable flow of molten liquid (b1–b3). It can easily lead to warping at the marginal zones, implying that the molten metal flow in the 0.2-H sample inherently exhibits an unstable state. Nevertheless, the depression space of the molten pool at the end of the single-track with a length of ∼0.3 mm is significantly smaller than that of the other longer single-track. Theoretically, the surface fluctuation of small-scaled structures is relatively improved. The actual situation is that the surface quality of the 0.2-H sample is the worst. It is speculated that the increase in molten pool temperature due to the significant heat accumulation mentioned above may be a factor affecting its surface morphology, which will be discussed in the ‘4.1.5.’ section.
Figure 9. The molten pool morphology at the end of the single-track with lengths of (a1) ∼0.16 mm, (b1) ∼0.3 mm, (c1) ∼0.7 mm, (d1) ∼1.0 mm, and (e1) ∼2.0 mm; the (a2–e2) elevation and (a3–e3) overhand views of 3D morphology for the molten pools in (a1–e1).
4.1.3. Overlap between the multi-tracks within a layer
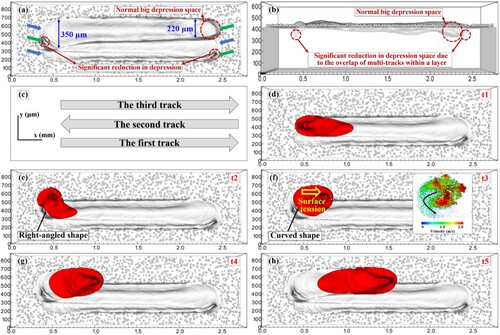
The number of laser scanning tracks within a layer increases with increasing the d0. Understanding the formation of the marginal zones can provide insights into the surface morphology of the large-scaled samples. Thus, the multi-tracks within a layer were simulated (). The simulation details are provided in Supplementary Material. Initially, the laser moves to the end of the second track (time t1). As the laser scanning begins in the third track (time t2), the molten pool takes on a right-angled shape. At time t3, the molten pool liquid flows upwards along the tail of the molten pool to fill the depression space at the end of the second track. This leads to a reduction in the depression space at the beginning of the solidified third track. Meanwhile, surface tension forces the molten pool to shift toward the scanning direction, causing the molten pool at the round-trip position between tracks to change from a right-angled shape to a curved shape. It results in a horizontal gap between the end and the beginning of the melt track, contributing to surface fluctuation of the marginal zones. Moreover, the molten pool width of the 1.0-H sample reaches ∼500 μm (c1), which is larger than the simulated result (∼350 μm) in a. It suggests that marginal zones may experience a significant heat accumulation relative to central zones. More importantly, although the molten pool at the end of the third track maintains a normal big depression space, the overlap between tracks can still significantly reduce the depression space of the molten pool at the ends of the first and second tracks (a,b). This means that the overlap between multi-tracks within a layer also contributes to improved surface morphology. The surface improvement by reducing the depression space was also recognised by Yuan et al. [Citation16]. Therefore, for samples with multi-tracks, the factors influencing surface morphology should include the overlap effect between tracks.
Figure 10. The morphology characteristics of the multi-tracks with the back-forth scanning mode: (a) overhead and (b) elevation views; (c) the schematic illustration of the used scanning mode; the evolution of the molten pool: (d) time t1, (e) time t2, (f) time t3, (g) time t4, and (h) time t5. The green and blue arrows represent the end and beginning of the melt track, respectively.
4.1.4. Successive rotational buildup between layers
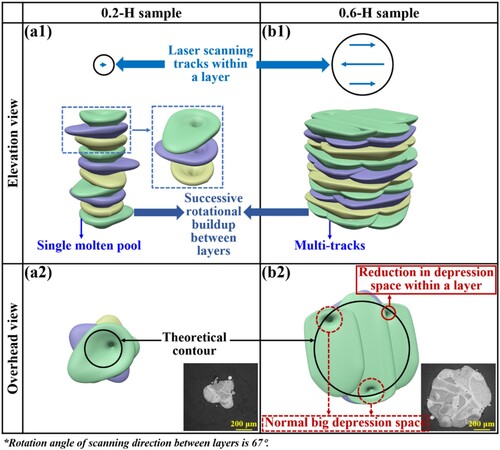
In the actual fabrication of the LPBF-ed parts, the rotation angle of scanning tracks between layers is 67°. Thus, the successive rotational buildup between layers may also affect surface morphology. visually displays the evident difference in surface morphology between the 0.2-H sample and 0.6-H sample. The big depression space of a single molten pool within a layer results in a very rough surface for the 0.2-H sample during the subsequent successive rotational buildup between layers (a1,a2). This situation is improved in the successive rotational buildup of multi-tracks for the 0.6-H sample (b1,b2). The OM images embedded in a2,b2, showing the gauge cross-sections, further demonstrate this phenomenon. It is mainly because the depression feature in the multi-tracks can be covered not only by the overlap between tracks within a layer but also by the subsequent multi-tracks of the next layer. Similarly, the 0.6-H sample can serve as a reference for the visual surface morphology of other large-scale samples. Furthermore, as the number of laser scanning tracks increases, the covering effect of depression within a layer and between layers becomes more significant, leading to further improvement in surface morphology.
Figure 11. The visualised schematic illustration of the elevation and overhand views for the surface morphology of (a1 and a2) 0.2-H and (b1 and b2) 0.6-H samples, respectively. The embedded images in (a2) and (b2) are the OM images of gauge cross-sections perpendicular to the building direction for the 0.2-H and 0.6-H samples.
4.1.5. Evolution mechanism for the scale effect of surface morphology
Based on all the above discussions, the potential influence of d0 on surface morphology in this study is analyzed as follows. For the 0.2-H sample with a single molten pool, the strong heat accumulation results in elevated temperature and longer solidification time, causing the molten metal in the unstable molten pool to flow more violently into the surrounding powder bed. This phenomenon has been recognised by Kazemi et al. [Citation36]. As a result, the inclined shape formed at the tail end of the molten pool is more warped. The more irregular morphology of the molten pool is exhibited. The molten pool becomes extremely unstable, and its width increases. Moreover, the successive rotational buildup induces the depression features of those single molten pools to randomly change positions in the 3D space. The surface naturally exhibits uneven morphology with apparent fluctuation. Eventually, the synergistic effect of more significant heat accumulation and successive rotational buildup of more irregular single molten pools results in extremely poor surface quality. The Ra (SP) reaches ∼35.4 μm, and the tensile strength of 254.1 MPa is at the lowest level.
As the d0 increases, the heat generated in the LPBF process gradually dissipates towards the substrate through the deposition layers. This weakens the heat accumulation in the central zones. Notably, some heat is still lost to the surrounding powder bed, leading to continuous heat storage in the marginal zones. Nevertheless, the proportion of marginal zones relative to the sample volume decreases. Therefore, the heat storage capacity of marginal zones in the 0.6-H and 1.0-H samples is reduced. This induces the temperature enhancement of molten pools for the marginal zones, increasing the molten pool size. The flow of molten liquids in these enlarged molten pools becomes relatively intense. Simultaneously, the overlap between multi-tracks within a layer and successive rotational buildup between layers effectively cover the depression space of the molten pool in the marginal zones. These factors contribute to the relatively poor surface quality and tensile strength of the 0.6-H and 1.0-H samples, accompanied by some degree of surface fluctuations. It is worth emphasising that, relative to a single-track length of ∼1.0 mm (d1–d3), the molten pool morphology of a single-track length of ∼0.7 mm remains irregular (c1–c3). As a result, the Ra (SP) of the 0.6-H sample (∼25.5 μm) is higher than that of the 1.0-H sample (∼16.5 μm) by ∼35%, while the strength reduces by ∼15% (292.0 MPa → 335.1 MPa).
When the d0 continues to increase to a certain value, the heat transfer area becomes large enough. It can be inferred that there is a weaker heat accumulation in the marginal zones. Therefore, the marginal zones of 2.0-H and 5.0-H samples have almost no heat storage capacity. In this case, heat dissipation through the deposition layers occupies a dominant role. Meanwhile, the laser energy input is balanced with the heat dissipation of the environment around the molten pool. The accumulated heat is maintained in an equilibrated range, resulting in a stable flow of molten liquid. Also, the overlap between multi-tracks within a layer and successive rotational buildup between layers further strengthen the covering effect of the depression space of the molten pool in the marginal zones. These result in a good surface quality with a relatively flat surface. Additionally, the molten pool morphology becomes regular when the single-track length is 2.0 mm (e1–e3). Thus, the Ra (SP) remains consistently low at 17.5∼17.6 μm, and the higher strength of 367.3∼397.2 MPa is achieved.
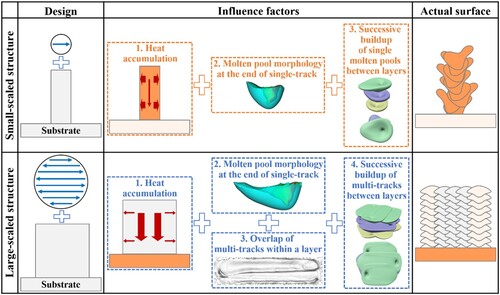
In summary, the possible evolution mechanism for the scale effect of surface morphology in LPBF technology is illustrated in . Due to the coupling effect of multiple factors such as heat accumulation, molten pool morphology at the end of a single-track, overlap between multi-tracks within a layer, and successive rotational buildup between layers, the actual surface morphology of LPBF-ed structure exhibits a significant scale effect. It can be considered that the successive rotational buildup between layers seems to be the main reason for the significant surface fluctuation of LPBF-ed parts under the condition of scale effect. These in-depth insights provide a powerful theoretical basis for controlling the structure scale effect in engineering applications of LPBF technology. It is worth noting that LPBF-ed multi-scaled components with numerous submillimeter-scaled structures, e.g. lattice structures, are frequently used in the fields of aviation and aerospace. These structures typically have feature scales of less than 1 mm, with minimum scales as small as 200 μm. Notably, the mechanical responses at different locations with various feature scales are inconsistent. Nevertheless, it is a pity that the design and manufacturing of LPBF-ed multi-scaled structures still do not pay enough attention to the negative impact of scale effect in practical production. Therefore, this phenomenon must be highly valued by designers. Unfortunately, if LPBF process is not properly controlled, scale effect inevitably results in a worse surface quality of actual structures. It should be noted that the ‘Skywriting’ mode is used in the strategy H. The primary purpose of implementing this mode, as demonstrated by Tian et al. [Citation40], is to enhance the surface quality of the LPBF-ed samples. In the ‘Skywriting’ mode, the laser scanning head accelerates to the set speed before beginning the scanning process. At the marginal zone of the sample, the laser is activated with a desired power and operates at a constant speed. A similar process occurs in the deceleration phase as the scanning direction changes, where the laser is switched off. This mode ensures that laser does not melt any material during positioning process, as the scanning head redirects the laser beam track at the end of current track and begins scanning the adjacent track. These analyses indicate that with the use of the ‘Skywriting’ mode, a constant laser power and scanning speed are maintained throughout all scanning tracks within a layer. As a result, it can be concluded that simply adjusting the processing parameters of the current LPBF machine is not sufficient to improve the scale-dependent behaviour of surface morphology. Instead, selecting an appropriate scanning strategy might be key to achieving the desired surface morphology.
Figure 12. The schematic illustration of the evolution mechanism for the scale effect of surface morphology in LPBF technology.
4.2. Improvement of scale effect on surface morphology
4.2.1. Hatching-contour scanning strategy (HC)
In the LPBF manufacturing of large-scaled components, the additional contour scanning process is usually used to optimise surface quality [Citation41]. Therefore, whether the hatching-contour scanning strategy (HC) can be exploited to improve the scale effect of surface morphology resulting from strategy H needs to be demonstrated. The schematic of strategy HC is shown in a. The contour scanning is implemented after the formation of a current solidified layer using the strategy H. It follows a fixed pattern and does not change with the number of layers. The laser power, scanning speed, and layer thickness of the contour scanning were set at 200 W, 1100 mm/s, and 0.03 mm, respectively. While the processing parameters used for the hatching scanning in the strategy HC are consistent with the strategy H. The tensile samples with the d0 ranging from 0.2 mm to 5.0 mm were also successfully fabricated (b).
Figure 13. The (a) schematic of the hatching-contour scanning strategy (HC) and (b) the LPBF-ed samples fabricated using the strategy HC.
4.2.2. Surface morphology, surface profile, surface roughness, and tensile strength with the strategy HC
The surface morphology of the 0.2-HC, 0.6-HC, 1.0-HC, 2.0-HC, and 5.0-HC samples is shown in . The results reveal that there are minimal differences in surface morphology between those samples. It suggests that the additional contour scanning effectively mitigates the scale effect of surface morphology. The surface quality of all samples is improved, and no significant surface fluctuation is observed. Interestingly, the smaller the d0, the more evident the improvement in surface morphology. The 3D original surface appears flat without significant peaks and valleys (a1–e1). There is also almost no difference in the surface fluctuation curves (a2–e2). The overall values of surface roughness for all samples sharply decrease. The Rz (OS) and Ra (OS) are kept at the low levels of 51.5∼58.0 μm and 7.5∼8.5 μm, respectively (g,f). Furthermore, a1–e1 show that the marginal zones mainly consist of small molten pools with a regular distribution along the building direction. Thus, the extracted surface profile curves in a2–e2 are so smooth. The Rz (SP) and Ra (SP) for all samples remain at the low levels of 39.7∼50.0 μm and 6.4∼9.2 μm, respectively (g,f). Overall, the consistency values of Rz (OS), Ra (OS), Rz (SP), and Ra (SP) across samples with different d0 further demonstrates the significant improvement in the scale effect of surface morphology achieved by the strategy HC. Additionally, the tensile strengths of the 0.2-HC, 0.6-HC, 1.0-HC, 2.0-HC, and 5.0-HC samples are exhibited in . As expected, all samples have a certain degree of enhancement in strength, with a significant improvement in the scale effect. The strengths of all samples are stably maintained at the high levels of 381.5∼406.9 MPa. Similar to the surface morphology, the smaller the d0, the more evident the enhancement of tensile strength.
Figure 14. SEM images with different magnifications showing the surface morphology of the (a1-a3) 0.2-HC, (b1-b3) 0.6-HC, (c1-c3) 1.0-HC, (d1-d3) 2.0-HC, and (e1-e3) 5.0-HC samples, respectively.
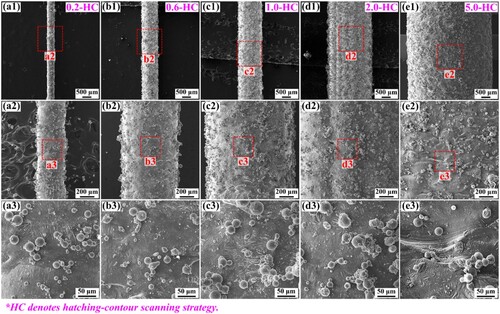
Figure 15. The height diagram of the original surface (OS) for the (a1) 0.2-HC, (b1) 0.6-HC, (c1) 1.0-HC, (d1) 2.0-HC, and (e1) 5.0-HC samples, respectively; the surface fluctuation curves in (a2-e2) are extracted from the height diagrams in (a1-e1); the comparison of surface roughness (f) Rz (OS) and (g) Ra (OS) between the 0.2-HC, 0.6-HC, 1.0-HC, 2.0-HC, and 5.0-HC samples.
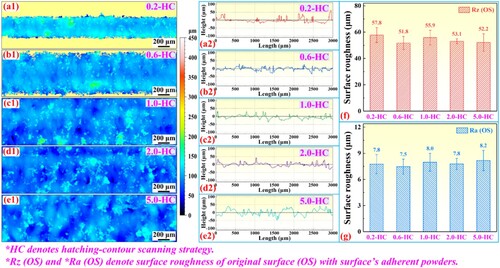
Figure 16. OM images showing the surface profile (SP) and molten pool morphology of the (a1) 0.2-HC, (b1) 0.6-HC, (c1) 1.0-HC, (d1) 2.0-HC, and (e1) 5.0-HC samples, respectively; the surface profile curves in (a2–e2) are extracted from the OM images in (a1–e1); the comparison of surface roughness (f) Rz (SP) and (g) Ra (SP) between the 0.2-HC, 0.6-HC, 1.0-HC, 2.0-HC, and 5.0-HC samples.
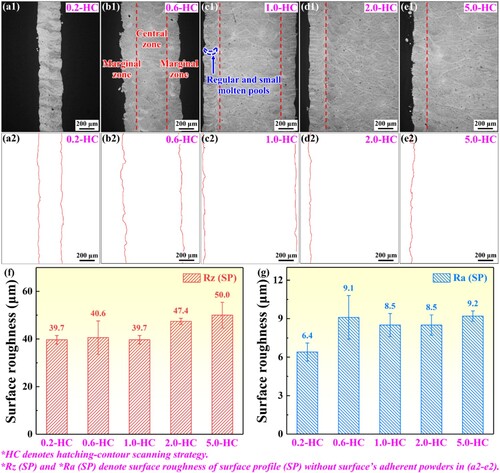
Figure 17. The (a) engineering stress-strain curves and (b) tensile strengths of the 0.2-HC, 0.6-HC, 1.0-HC, 2.0-HC, and 5.0-HC samples, respectively.
4.2.3. Reason for improving the scale effect of surface morphology with the strategy HC
The analysis of ability of the strategy HC to improve the scale-dependent behaviour of surface morphology is briefly presented here. The schematic illustration is vividly exhibited in . Previous studies have demonstrated that the laser scanning contour was to melt the attached powders on the surface by using a single laser track along the contour of the solidified layer [Citation41,Citation42]. However, a surprising finding in this study is that regardless of the changes in d0, contour scanning can homogenise the molten pool morphology in the marginal zones, resulting in a smooth surface without obvious surface fluctuation. The underlying reason is that contour scanning can be regarded as laser remelting for the marginal zones, as explained in Ref. [Citation42]. In this case, contour scanning appears to eliminate the adverse impact of heat accumulation on the molten pool morphology in the marginal zones of samples with different d0. Due to the processing particularity of contour scanning, the molten pools with different morphologies in the marginal zones with the strategy H have been completely replaced by the small molten pools regularly distributed along the building direction for the strategy HC. Moreover, several references [Citation40,Citation43,Citation44] have also reported that the strategy HC can indeed reduce the surface roughness. Thus, the Rz (SP) and Ra (SP) of all samples significantly decrease to an invariable range, and the tensile strength is within a relatively high stable level.
Figure 18. The schematic illustration of the molten pool morphology in the marginal and central zones for the (a) 0.2-HC, (b) 0.6-HC and 1.0-HC, and (c) 2.0-HC and 5.0-HC samples, respectively. The arch-shaped regions with blue filling colour are the molten pools of marginal zones, while those with gray filling colour are the molten pools of central zones. The blue dashed line represents the boundary between the marginal zone and the central zone.
Nonetheless, the use of strategy HC requires attention to the following aspects. Firstly, inappropriate processing parameters for contour scanning can result in inaccurate dimensions and poor surface quality. In practice, a combination of low laser power and low scanning speed is recommended for contour scanning. Low laser power reduces the molten pool size, while low scanning speed allows sufficient time for the molten pool to melt to ensure its stability. Therefore, those processing parameters can improve both the dimension accuracy and surface quality of LPBF-ed parts. This approach has been recognised by Snyder et al. [Citation42], Yang et al. [Citation43], and Wu et al. [Citation45], respectively. Furthermore, after a thorough investigation, this combination of processing parameters for contour scanning is also widely adopted in the industrial production of popular commercial LPBF machines (e.g. 3D Systems, EOS, SLM Solutions, and BLT). In this study, the laser power and scanning speed for contour scanning are indeed lower than those for hatching scanning, resulting in an accurate dimension and a smooth surface. This provides a good guarantee for conducting the scale effect research in LPBF technology. Secondly, it should be noted that the strategy HC can reduce production efficiency and increase costs. However, apart from the additional contour scanning, there are other laser-control strategies to achieve surface quality control in LPBF-ed parts. For instance, Craeghs et al. [Citation46] proposed the feedback control of the processing parameters, enabling continuous monitoring of the molten pool at high speed throughout the LPBF process. The dynamic relation between the laser power and the photodiode signal as a second-order model was experimentally determined. Based on this dynamic relationship, consistent molten pool geometry can be achieved for the laser scanning track by controlling the laser power in real-time. Grasso et al. [Citation47] also supported this viewpoint in their discussions. Other valuable studies can also be used as a reference, which can improve the surface quality and mechanical properties of the thin-wall [Citation48] and thin-strut [Citation49] structures by optimising processing parameters. Moreover, Wang et al. [Citation50] reported the development of the voxel models for the LPBF-ed multi-material structures. These voxel models will enable the different LPBF processing parameters to be implemented at any part of a complex structure. Consequently, the marginal zones can achieve the same molten pool geometry as the central zones, thereby improving the scale effect of surface morphology. This research direction is also crucial. Thirdly, the strategy HC is an in-process control method. Some post-process control methods are still potential solutions. Electropolishing can simultaneously improve surface quality and mechanical properties [Citation51]. This seems to be a viable choice for mitigating the scale effect in LPBF. Additionally, heat treatment can homogenise microstructure, leading to consistent mechanical properties [Citation52]. However, it is well known that both microstructure and surface quality are important factors affecting mechanical properties. Therefore, when employing these post-process control methods, it is necessary to experimentally and analytically examine the influence of electropolishing on microstructure and heat treatment on surface quality under conditions of scale effect.
4.3. Relationship between tensile strength and surface roughness with the variation of structure scale
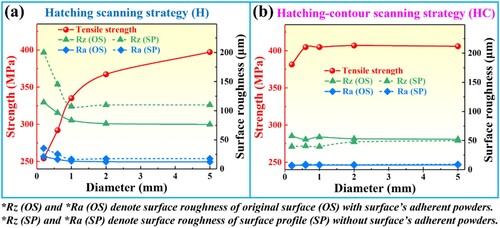
The variation curves of tensile strength and surface roughness with the d0 in effectively reflect that the strategy HC is a powerful means to eliminate the scale effect of surface morphology and mechanical properties caused by the strategy H. Surprisingly, an important finding is that both the strategies H and HC exhibit a strong correlation between tensile strength and surface roughness with the d0 variation. For all the tested tensile samples, the poor surface quality with high roughness generally corresponds to the low tensile strength. These results indicate that for the scale effect of LPBF technology, the surface quality should be an important factor affecting the mechanical properties. Understanding the underlying mechanisms involved in this correlation is a key point that requires further investigation in our future research works.
Figure 19. The variation curves of tensile strength and surface roughness with the d0 of LPBF-ed tensile samples for the strategies (a) H and (b) HC.
5. Conclusion
In this study, the influence of scale effect on surface morphology in LPBF technology and relevant mechanical performance is thoroughly investigated. The findings provide valuable theoretical guidance for further innovative designs and engineering applications of LPBF-ed multi-scaled structures. The major conclusions are summarised as follows:
The surface morphology with the strategy H presents a significant scale effect. The surface roughness Ra (SP) rapidly decreases by ∼51% from ∼35.4 μm for the 0.2-H sample to ∼17.5 μm for the 2.0-H sample, accompanied by the evident improvement in surface fluctuation. It is observed that the abnormally large molten pools in the marginal zones contribute to the scale-dependent behaviour of surface morphology. This is likely a coupling result of the multiple effects of heat accumulation, molten pool morphology at the end of a single-track, overlap between multi-tracks within a layer, and successive rotational buildup between layers.
The scale effect is also observed in the tensile strength. The strength exhibits a significant reduction of ∼31% from 367.3 MPa for the 2.0-H sample to 254.1 MPa for the 0.2-H sample. Notably, the surface fluctuation and tensile strength tend to stabilise when the d0 exceeds 2.0 mm. The threshold of the d0 for the scale effect research in LPBF should be 2.0 mm.
Since contour scanning plays a remelting effect on the marginal zones, the strategy HC can effectively improve the scale effect of surface morphology and tensile strength resulting from the strategy H. The surface roughness Ra (SP) of all samples uniformly and stably reduces to a level of 6.4∼9.2 μm with minimal changes in surface fluctuation. Meanwhile, the strengths of all samples consistently remain at high levels of 381.5∼406.9 MPa.
For both the strategies H and HC, there is a strong correlation between tensile strength and surface roughness with the change in d0. The low tensile strength is accompanied by the high surface roughness. However, the latent mechanism behind this correlation needs to be further revealed.
Supplemental Material
Download MS Word (31.1 KB)Disclosure statement
No potential conflict of interest was reported by the author(s).
Data availability statement
The datasets generated and analyzed during this study are all in this paper and available from the corresponding author on reasonable request.
Additional information
Funding
References
- Aboulkhair NT, Simonelli M, Parry L, et al. 3D printing of aluminium alloys: additive manufacturing of aluminium alloys using selective laser melting. Prog Mater Sci. 2019;106:100578. doi:10.1016/j.pmatsci.2019.100578
- Tan CL, Weng F, Sui S, et al. Progress and perspectives in laser additive manufacturing of Key aeroengine materials. Int J Mach Tools Manuf. 2021;170:103804. doi:10.1016/j.ijmachtools.2021.103804
- DebRoy T, Wei HL, Zuback JS, et al. Additive manufacturing of metallic components – process, structure and properties. Prog Mater Sci. 2018;92:112–224. doi:10.1016/j.pmatsci.2017.10.001
- Sanaei N, Fatemi A. Defects in additive manufactured metals and their effect on fatigue performance: a state-of-the-art review. Prog Mater Sci. 2021;117:100724. doi:10.1016/j.pmatsci.2020.100724
- Chowdhury S, Yadaiah N, Prakash C, et al. Laser powder Bed fusion: A state-of-the-art review of the technology, materials, properties & defects, and numerical modelling. J Mater Res Technol. 2022;20:2109–2172. doi:10.1016/j.jmrt.2022.07.121
- Sefene EM. State-of-the-Art of selective laser melting process: A comprehensive review. J Manuf Syst. 2022;63:250–274. doi:10.1016/j.jmsy.2022.04.002
- Tradowsky U, White J, Ward R, et al. Selective laser melting of AlSi10Mg: influence of post-processing on the microstructural and tensile properties development. Mater Des. 2016;105:212–222. doi:10.1016/j.matdes.2016.05.066
- Fatemi A, Molaei R, Sharifimehr S, et al. Torsional fatigue behavior of wrought and additive manufactured Ti-6Al-4V by powder bed fusion including surface finish effect. Int J Fatigue. 2017;99:187–201. doi:10.1016/j.ijfatigue.2017.03.002
- Spierings AB, Starr TL, Wegener K. Fatigue performance of additive manufactured metallic parts. Rapid Prototyp J. 2013;19(2):88–94. doi:10.1108/13552541311302932
- Pal S, Lojen G, Hudak R, et al. As-fabricated surface morphologies of Ti-6Al-4V samples fabricated by different laser processing parameters in selective laser melting. Addit Manuf. 2020;33:101147. doi:10.1016/j.addma.2020.101147
- Balbaa M, Mekhiel S, Elbestawi M, et al. On selective laser melting of inconel 718: densification, surface roughness, and residual stresses. Mater Des. 2020;193:108818. doi:10.1016/j.matdes.2020.108818
- Wang LZ, Wang S, Wu JJ. Experimental investigation on densification behavior and surface roughness of AlSi10Mg powders produced by selective laser melting. Opt Laser Technol. 2017;96:88–96. doi:10.1016/j.optlastec.2017.05.006
- Dursun G, Ibekwe S, Li GQ, et al. Influence of laser processing parameters on the surface characteristics of 316L stainless steel manufactured by selective laser melting. Mater Today Proc. 2020;26:387–393. doi:10.1016/j.matpr.2019.12.061
- Mower TM, Long MJ. Mechanical behavior of additive manufactured, powder-Bed laser-fused materials. Mater Sci Eng A. 2016;651:198–213. doi:10.1016/j.msea.2015.10.068
- Zheng M, Wei L, Chen J, et al. Surface morphology evolution during pulsed selective laser melting: numerical and experimental investigations. Appl Surf Sci. 2019;496:143649. doi:10.1016/j.apsusc.2019.143649
- Yuan WH, Chen H, Cheng T, et al. Effects of laser scanning speeds on different states of the molten pool during selective laser melting: simulation and experiment. Mater Des. 2020;189:108542. doi:10.1016/j.matdes.2020.108542
- Maconachie T, Leary M, Lozanovski B, et al. SLM lattice structures: properties, performance, applications and challenges. Mater Des. 2019;183:108137. doi:10.1016/j.matdes.2019.108137
- Chen LY, Liang SX, Liu YJ, et al. Additive manufacturing of metallic lattice structures: unconstrained design, accurate fabrication, fascinated performances, and challenges. Mater Sci Eng R Rep. 2021;146:100648. doi:10.1016/j.mser.2021.100648
- Plessis AD, Razavi SMJ, Benedetti M, et al. Properties and applications of additively manufactured metallic cellular materials: A review. Prog Mater Sci. 2021;125:100918. doi:10.1016/j.pmatsci.2021.100918
- Pioneering Bionic 3D Printing. https://www.airbus.com/en/newsroom/news/2016-03-pioneering-bionic-3d-printing.
- Applications of Aviation, Aerospace, Engine, Mold, and Automotive. https://www.xa-blt.com/en/.
- Wan HY, Luo YW, Zhang B, et al. Effects of surface roughness and build thickness on fatigue properties of selective laser melted inconel 718 at 650 °C. Int J Fatigue. 2020;137:105654. doi:10.1016/j.ijfatigue.2020.105654
- Zhang ZY, Yang X, Song F, et al. Assessment of microstructural evolution and associated tensile behavior in thin-walled Ti6Al4V parts manufactured via selective laser melting. Mater Charact. 2022;194:112481. doi:10.1016/j.matchar.2022.112481
- Poncelet O, Marteleur M, Rest CVD, et al. Critical assessment of the impact of process parameters on vertical roughness and hardness of thin walls of AlSi10Mg processed by laser powder bed fusion. Addit Manuf. 2021;38:101801. doi:10.1016/j.addma.2020.101801
- Yu TY, Hyer H, Sohn Y, et al. Structure-property relationship in high strength and lightweight AlSi10Mg microlattices fabricated by selective laser melting. Mater Des. 2019;182:108062. doi:10.1016/j.matdes.2019.108062
- Careri F, Khan RHU, Todd C, et al. Additive manufacturing of heat exchangers in aerospace applications: a review. Appl Therm Eng. 2023;235:121387. doi:10.1016/j.applthermaleng.2023.121387
- Razavi SMJ, Hooreweder BV, Berto F. Effect of build thickness and geometry on quasi-static and fatigue behavior of Ti-6Al-4V produced by electron beam melting. Addit Manuf. 2020;36:101426. doi:10.1016/j.addma.2020.101426
- Feng Z, Wang XM, Tan H, et al. Effect of heat treatment patterns on porosity, microstructure, and mechanical properties of selective laser melted TiB2/Al-Si-Mg composite. Mater Sci Eng A. 2022;855:143932. doi:10.1016/j.msea.2022.143932
- Feng Z, Tan H, Fang YB, et al. Selective laser melting of TiB2/AlSi10Mg composite: processability, microstructure and fracture behavior. J Mater Process Technol. 2022;299:117386. doi:10.1016/j.jmatprotec.2021.117386
- Hao JB, Wei L, Yang HO, et al. Surface morphology evolution of GTD-450 stainless steel during laser powder Bed fusion. Vacuum. 2023;213:112107. doi:10.1016/j.vacuum.2023.112107
- Grimm T, Wiora G, Witt G. Characterization of typical surface effects in additive manufacturing with confocal microscopy. Surf Topogr Metrol Prop. 2015;3(1):014001. doi:10.1088/2051-672X/3/1/014001
- Cho SY, Shin GY, Lee KY, et al. Post-Building successive treatments using surface laser remelting and ultrasonic nanocrystalline surface modification for rough surface built via directed energy deposition. J Manuf Process. 2022;84:1076–1093. doi:10.1016/j.jmapro.2022.09.039
- Samadian K, Waele WD. Fatigue crack growth model incorporating surface waviness for wire+Arc additively manufactured components. Proc Struct Integr. 2020;28:1846–1855. doi:10.1016/j.prostr.2020.11.008
- Safdar A, He HZ, Wei LY, et al. Effect of process parameters settings and thickness on surface roughness of EBM produced Ti-6Al-4V. Rapid Prototyp J. 2012;18:401–408. doi:10.1108/13552541211250391
- Liu BQ, Fang G, Lei LP, et al. Predicting the porosity defects in selective laser melting (SLM) by molten pool geometry. Int J Mech Sci. 2022;228:107478. doi:10.1016/j.ijmecsci.2022.107478
- Kazemi Z, Soleimani M, Rokhgireh H, et al. Melting pool simulation of 316L samples manufactured by selective laser melting method, comparison with experimental results. Int J Therm Sci. 2022;176:107538. doi:10.1016/j.ijthermalsci.2022.107538
- Dong ZC, Zhang XY, Shi WH, et al. Study of size effect on microstructure and mechanical properties of AlSi10Mg samples made by selective laser melting. Materials. 2018;11(12):2463. doi:10.3390/ma11122463
- Takata N, Kodaira H, Suzuki A, et al. Size dependence of microstructure of AlSi10Mg alloy fabricated by selective laser melting. Mater Charact. 2018;143:18–26. doi:10.1016/j.matchar.2017.11.052
- Zhang H, Zhao YZ, Wang F, et al. A 3D discrete element-finite difference coupling model for predicting the effective thermal conductivity of metal powder beds. Int J Heat Mass Transfer. 2019;132:1–10. doi:10.1016/j.ijheatmasstransfer.2018.11.118
- Tian Y, Tomus D, Rometsch P, et al. Influences of processing parameters on surface roughness of hastelloy X produced by selective laser melting. Addit Manuf. 2017;13:103–112. doi:10.1016/j.addma.2016.10.010
- Ren ZH, Wei DH, Wang SQ, et al. On the role of pre- and post-contour scanning in laser powder bed fusion: thermal-fluid dynamics and laser reflections. Int J Mech Sci. 2022;226:107389. doi:10.1016/j.ijmecsci.2022.107389
- Snyder JC, Thole KA. Understanding laser powder bed fusion surface roughness. J Manuf Sci Eng. 2020;142(7):071003. doi:10.1115/1.4046504
- Yang T, Liu TT, Liao WH, et al. The influence of process parameters on vertical surface roughness of the AlSi10Mg parts fabricated by selective laser melting. J Mater Process Technol. 2019;266:26–36. doi:10.1016/j.jmatprotec.2018.10.015
- Vrána R, Jaroš J, Koutný D, et al. Contour laser strategy and its benefits for lattice structure manufacturing by selective laser melting technology. J Manuf Process. 2022;74:640–657. doi:10.1016/j.jmapro.2021.12.006
- Wu ZH, Narra SP, Rollett A. Exploring the fabrication limits of thin-wall structures in a laser powder Bed fusion process. Int J Adv Manuf Technol. 2020;110(1-2):191–207. doi:10.1007/s00170-020-05827-4
- Craeghs T, Bechmann F, Berumen S, et al. Feedback control of layerwise laser melting using optical sensors. Phys Procedia. 2010;5:505–514. doi:10.1016/j.phpro.2010.08.078
- Grasso M, Colosimo BM. Process defects and in situ monitoring methods in metal powder Bed fusion: A review. Meas Sci Technol. 2017;28:044005. doi:10.1088/1361-6501/aa5c4f
- Xiong ZW, Li HH, Yang H, et al. Micro laser powder Bed fusion of NiTi alloys with superior mechanical property and shape recovery function. Addit Manuf. 2022;57:102960. doi:10.1016/j.addma.2022.102960
- Britt C, Montgomery CJ, Brand MJ, et al. Effect of processing parameters and strut dimensions on the microstructures and hardness of stainless steel 316L lattice-emulating structures made by powder Bed fusion. Addit Manuf. 2021;40:101943. doi:10.1016/j.addma.2021.101943
- Wang D, Liu LQ, Deng GW, et al. Recent progress on additive manufacturing of multi-material structures with laser powder Bed fusion. Virtual Phys Prototyp. 2022;17(2):329–365. doi:10.1080/17452759.2022.2028343
- Kuo CN, Wang YP, Chua CK. Effect of electropolishing on mechanical property enhancement of Ti6Al4 V porous materials fabricated by selective laser melting. Virtual Phys Prototyp. 2022;17(4):919–931. doi:10.1080/17452759.2022.2090383
- Kuo CN, Peng PC. The strengthening mechanism synergy of heat-treated 3D printed Al-Sc alloy. Virtual Phys Prototyp. 2023;18(1):e2166539. doi:10.1080/17452759.2023.2166539