
 ?Mathematical formulae have been encoded as MathML and are displayed in this HTML version using MathJax in order to improve their display. Uncheck the box to turn MathJax off. This feature requires Javascript. Click on a formula to zoom.
ABSTRACT
In this study, Al-Zn-Mg-Cu alloy components were prepared using wire arc additive manufacturing (WAAM). Through multi-scale characterisation technology, performance testing and slow strain rate tensile (SSRT) testing, the microstructure, mechanical properties and stress corrosion cracking (SCC) susceptibility of WAAM Al-Zn-Mg-Cu components were studied, revealing the generation mechanism of inhomogeneity and anisotropy. The results show that with the increase of WAAM thermal cycles, the matrix precipitates (MPs), grain boundary precipitates (GBPs) and precipitation-free zones (PFZ) evolve in different paths and increase to varying degrees, resulting in performance decrease and increase in stress corrosion susceptibility, so the inhomogeneity is mainly attributed to differences in precipitated phases. The Inter-layer inclined to the scanning direction and the Inner-layer inclined to the building direction led to anisotropy in tensile strength and SCC behaviour, so the anisotropy is mainly attributed to the grain orientation and fracture mode.
Highlights
First study on stress corrosion cracking susceptibility of Al-Zn-Mg-Cu alloy manufactured by wire arc additive manufacturing.
The relationship between additive process – microstructure – mechanical properties – service performance was established.
The key causes of inhomogeneity and anisotropy are analysed.
The reasons for the formation of grain morphology and the evolution rules of precipitated phases were obtained.
1. Introduction
In the new era of rapid development of the industrial revolution, the demand for new engineering materials is also increasing. Therefore, it is necessary to lead the modern world to a new, faster, stronger and more energy-saving new manufacturing process era [Citation1]. WAAM combines traditional welding technology with additive manufacturing. It uses arc as a heat source and filler wire as raw material to deposit layer by layer until the required 3D shape structure is created [Citation2]. Compared with subtractive manufacturing and other additive manufacturing processes, WAAM has the advantages of high deposition efficiency, low equipment cost, high material utilisation rate, ability to manufacture large-size components, multiple design degrees of freedom, wide material availability, hybrid manufacturing and low environmental pollution [Citation3]. Although WAAM has a relatively short time of appearance, it has attracted more and more attention in many industrial manufacturing fields and has broad development prospects in the field of metal intelligent manufacturing [Citation4].
Al-Zn-Mg-Cu alloy is a high-strength aluminum alloy, which is mainly used in the aerospace field that requires high strength, high toughness, corrosion resistance and high damage resistance. Obviously, aluminum alloy WAAM can realise the direct manufacturing of large and complex precision components that are difficult to be realised by traditional manufacturing methods [Citation5]. It can produce preforms that are very close to the final shape without complex tools, moulds and stamping dies, so the demand for additive technology of high strength aluminum alloy is very strong [Citation6]. So far, many studies have focused on improving the mechanical and structural properties of aluminum alloy components manufactured by WAAM by changing different process parameters, including arc mode, wire feeding speed, deposition speed and post-processing methods. Without post-heat treatment, deformation treatment, reinforcement particles and other strengthening treatments, it is difficult to obtain high-performance WAAM high-strength aluminum alloy components, the tensile strength of high strength aluminum alloy components deposited by simple surfacing is often less than 300 MPa [Citation7,Citation8]. The defects associated with WAAM high-strength aluminum alloys, such as cracks, porosity, uneven microstructure, residual stress and deformation, make it more challenging for researchers.
However, Al-Zn-Mg-Cu alloy has a wide solidification range, and the viscosity of the liquid metal in the later stage of crystallization is large, which is easy to produce defects such as hot cracks and solidification shrinkage cavities [Citation9,Citation10]. At the same time, the special thermal process of WAAM often makes the deposited metal show different microstructure characteristics and mechanical properties from the traditional manufacturing methods, such as grain directional growth [Citation11], alloy element segregation [Citation7], mechanical properties anisotropy and so on. Kok, Yihong et al. [Citation12] commented on the anisotropy and inhomogeneity of microstructure and properties in metal additive manufacturing and believed that in order to realise the design potential of additive manufacturing, it is necessary to have a deep and comprehensive understanding of the anisotropy and inhomogeneity that often occur in additive components. Compared with aluminum alloy, steel [Citation13], titanium alloy [Citation14] and superalloy [Citation15] have more serious anisotropy and inhomogeneity. At present, auxiliary methods are widely used in WAAM to improve the shape and quality of high-strength aluminum alloys. The main methods of performance optimisation include: material design [Citation16–20], processing after solidification [Citation21–27], microstructure control during solidification [Citation23,Citation28–30], composite additive manufacturing methods [Citation31–33]. It can be seen that despite the broad prospects, there are still technical problems to be solved urgently in the WAAM of Al-Zn-Mg-Cu alloys in order to achieve engineering applications.
Highly alloyed Al-Zn-Mg-Cu alloys are prone to pitting and intergranular corrosion during service, which are very sensitive to stress corrosion [Citation34]. Due to the difference in composition undercooling, the component may form a region with a unique grain structure [Citation35–37]. In addition, since high-strength aluminum alloys are heat-treatable, WAAM can cause phase transitions associated with complex thermal cycles, resulting in significant chemical inhomogeneities such as segregation, solid solution, and overaging [Citation38,Citation39]. It inevitably affects the localised corrosion of the alloy [Citation35]. In addition, in order to further improve the mechanical properties of WAAM high-strength aluminum alloy parts, it is necessary to analyse the effect of environmental assisted cracking (EAC) on the mechanical properties of corrosion-resistant metal parts manufactured by WAAM method. EAC often affects a variety of failures in materials, such as SCC, hydrogen embrittlement (HE), sulfide stress corrosion cracking and irradiation-induced stress corrosion cracking (IISCC). Experience has shown that aircraft components made of Al7075-T6 tend to corrode rapidly, especially aircraft operating in marine environments [Citation40]. Hutasoit et al. [Citation41] studied the corrosion properties of Al6061 cold-sprayed additive manufacturing components, and the results showed that compared with vertical components, horizontal components showed low pitting resistance. Zhou Le et al. [Citation42] studied the corrosion properties of AA5083 alloy manufactured by laser powder bed fusion, and improved the corrosion resistance by adding Zr element. Zhang Xinxin et al. [Citation43] found that different areas in the thin-walled structure of WAAM AA2024 alloy showed different corrosion behaviours, and believed that it was mainly caused by the segregation of alloy elements during the solidification process. Revilla et al. [Citation44] reviewed the major studies on corrosion of additive manufacturing aluminum alloys to date, and concluded that while a limited number of studies have been conducted to understand the corrosion mechanisms of additive manufacturing metal components, the corrosion behaviour of the unique non-equilibrium microstructure brought about by additive manufacturing requires more research. At present, relevant scholars have made some reports on the anisotropic corrosion behaviour of Ni-Al bronze alloy [Citation45], 316L stainless steel [Citation45] and Ti-6Al-4 V alloy [Citation46] manufactured by WAAM. Therefore, it is necessary to comprehensively study the SCC behaviour in WAAM aluminum alloy manufacturing parts. However, no scholars have studied the stress corrosion behaviour of WAAM Al-Zn-Mg-Cu alloys.
In this study, Al-Zn-Mg-Cu alloys were prepared by WAAM. The microstructure and mechanical properties of different regions and orientations were tested in detail, and the SCC susceptibility of different regions was evaluated by SSRT. The evolution of grain morphology and precipitated phases in the WAAM process was discussed. The inhomogeneity and anisotropy of mechanical properties and SCC were analysed. Finally, the relationship between microstructure, mechanical properties and service performance was established. This work aims to expand the existing research of Al-Zn-Mg-Cu, reveal the key factors affecting mechanical properties and SCC, and provide new strategies for microstructure design and performance improvement.
2. Materials and methods
2.1. Materials and processing
In this study, the self-developed WAAM system was used to manufacture Al-Zn-Mg-Cu alloy components. The whole equipment consists of EMPPI Master 3500 welding power supply, tungsten inert gas (TIG) welding torch, YASKAWA industrial robot, wire feeder, self-developed preheating/cooling unit, control system and positioner, as shown in (a). The welding torch is perpendicular to the working platform, the angle between the wire feeding nozzle and the platform is about 40°, and the distance between the tungsten electrode and the molten pool is about 5 mm, as shown in (b). The self-developed alloy wire with a diameter of 1.2 mm was used. The elemental composition of the wire and deposited components was measured by inductively coupled plasma atomic emission spectrometry (ICP), as shown in . The deposited substrate is a 6061 rolled plate with a thickness of 10 mm to avoid component breakage and large deformation of the substrate during deposition. According to our previous research [Citation47,Citation48], we selected the optimal parameters, the wire feeding speed is 140 cm/min, the travel speed is 15 cm/min, the current is 105 A, and the gas flow rate of the protective gas pure Ar is 20 L/min to ensure a stable deposition process and good forming. The preheating platform was heated to 100°C and began to deposit. A single-wall deposition component of 200 × 8 × 80 mm was prepared by reciprocating scanning strategy (repeated at the starting position after single-layer scanning), as shown in (c).
Figure 1. (a) WAAM system, (b) Schematic diagram of welding torch and working platform, (c) Morphology of deposited components.
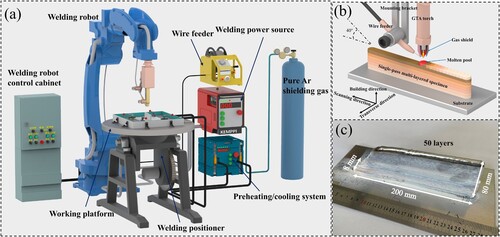
Table 1. Compositions of the feedstock and as-deposited components (wt.%).
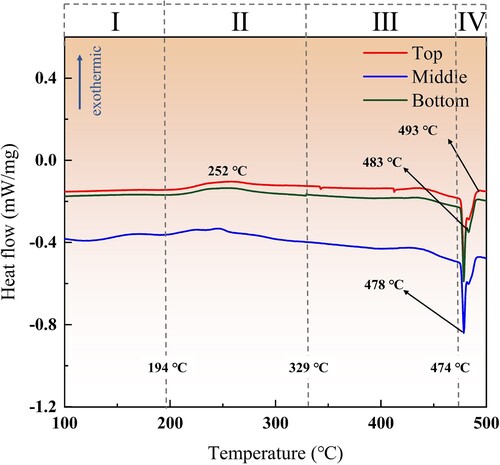
The order of formation and dissolution of the main phase was determined by differential scanning calorimetry (DSC), and the DSC heating curves of the Top, Middle and Bottom were measured respectively. The results are shown in . According to the measurement results and the precipitation sequence of Al-Zn-Mg-Cu alloy (supersaturated solid solution (SS) – Guinier Preston (GP) zone – η′ (MgZn2) – η (MgZn2)), it can be found that there is an obvious exothermic peak at about 252°C (effect Ⅱ), which is due to the formation and growth of the η phase during the heating process [Citation49]. No exothermic peak was found in effect Ⅰ, indicating that the deposited structure is in an over-aging state, and the melting of the GP zones and the formation of η′ have occurred. After this exothermic peak, a long-term endothermic signal occurs (effect Ⅲ), which is the result of the dissolution of η phases [Citation50]. A large endothermic peak began to appear at 474°C and ended at 493°C (effect Ⅳ), which was due to the melting of η phase and T phase.
Figure 2. Heat flux during DSC process of Al-Zn-Mg-Cu components.
2.2. Microstructural characterisation and mechanical test
Wire electro-discharge machining (EDM) was used to extract tensile samples, SSRT samples and metallographic samples from single-wall components. The purpose of this study is to discuss the inhomogeneity and anisotropy of deposited components, so samples were taken from different positions and orientations of the components. Performance test samples were only sampled from the middle 4 mm of the single-wall wall to avoid the influence of large roughness and corrugated features on the component surface. As shown in , for convenience, we define the building direction as B, the scanning direction as S, the wall thickness direction as T, the single-wall wall section as the BOT surface, and the single-wall wall side as the BOS surface. Similarly, we define the position 2 mm from the top as the Top, the position 40 mm from the top as the Middle, and the position 75 mm from the top as the Bottom. The orientation and position characterised in this article are denoted as the combination of ‘orientation-position’. For example, the top of the BOS surface is denoted as BOS-T.
Figure 3. (a) Mechanical property test sampling position, (b) Microstructure observation position, (c) Tensile specimen size, (d) SSRT specimen size (Unit: mm).
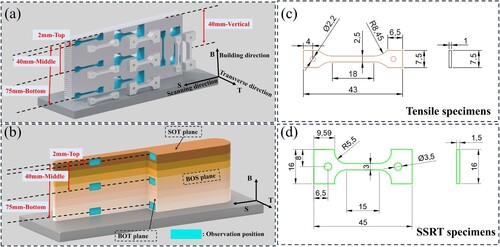
The microstructure observation sampling position is shown in (b). The metallographic samples were grinded and polished, and then etched by Keller reagent. The macroscopic morphology of the microstructure was observed by laser confocal optical microscope (OM, OLYMPUS LEXT OLS4100). The microstructure and fracture morphology were observed by field emission scanning electron microscope (SEM, ZEISS-SUPRA55), and the elemental composition of the second phases was measured by energy dispersive X-ray spectrometer (EDS, Oxford Instruments). The metallographic samples were polished by vibration, and the grain structure information was collected by electron backscatter diffraction (EBSD, AZtecHKL). The original data of EBSD were processed by AztecCrystal software. The composition of the precipitated phases was analysed using an X-ray diffractometer (XRD, PANalytical XPERT) with Cu Kα radiation. Foil samples were prepared by wire cutting, mechanically ground to 70 μm, and finally thinned on an argon ion thinning instrument to obtain a transmission electron microscope (TEM) observation sample. Scanning transmission electron microscopy (STEM, FEI Talos F200X) was used to observe nanoscale microstructures, and high-angle-annular-dark-field (HAADF) detectors was used for high-resolution observation. Fast Fourier Transform (FFT) of high-resolution images using Gatan Digital Micrograph software.
The sampling position of the performance test is shown in (a). Uniaxial tensile tests were performed at room temperature (25°C) using a universal testing machine with a video extensometer (AGS-X 10KN). The tensile rate was 0.5 mm/min, and the samples at the same position were tested at least three times. The size of the tensile sample is shown in (c). The hardness was measured by a Vickers hardness tester (HM-112), with a load of 200 g and a loading time of 10 s.
2.3. SCC susceptibility testing
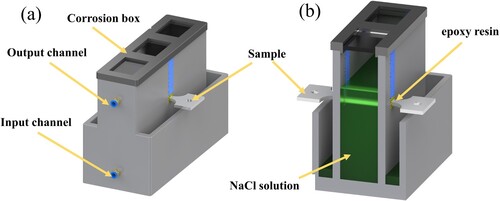
The SCC susceptibility and stress SCC behaviour were studied by SSRT testing. The SSRT method was performed in accordance with the National Standard of the P.R. China, GB/T 15970.7-2017. The SCC testing system (CARE Measurement & Control Co., Ltd.) consists of testing machine, corrosion liquid tank, peristaltic pump and water bath pot. Use a peristaltic pump and circulation pipeline to control the input and output speed of the corrosive solution ((a)). The gauge part is immersed in the corrosive solution ((b)). The loading part is coated with epoxy resin to prevent corrosion. The corrosion solution is a salt solution of 3.5 wt% NaCl + 0.5 wt% H2O2. The SSRT sample is shown in (d). It was carried out in air and corrosion solution respectively, the strain rate was 0.4 × 10⁻⁶s−1 (corresponding to a displacement rate of 0.006 μm/s), the experimental temperature was room temperature, and the sample at the same position was tested at least three times. During the experiment, the experimental values were collected and recorded. After the sample broke, it was immediately taken out of the corrosive solution and rinsed with water to remove the corrosion products. SEM was used to observe the post-corrosion morphology and fracture surface.
Figure 4. (a) Corrosion solution circulation diagram, (b) SSRT diagram.
3. Results
3.1. Microstructure characterisation
3.1.1. Grain morphology
The BOT and BOS samples were intercepted from the forming stable section of the single-pass multi-layer thin-wall wall component, and their macroscopic morphology is shown in . The common structural delamination phenomenon in arc additive aluminum alloys can be clearly observed, in which the grain orientation and fusion lines can be observed to show different morphologies on different surfaces ((a1) and (b1)). The sample has been corroded to form a significant photoetched zone, which exists between adjacent layers, which is similar to the quenching paste zone in aluminum alloy arc welding [Citation51]. According to its organisational characteristics, the deposition layer is divided into Inner-layer and Inter-layer. The height of a single layer is about 1.55 mm, the Inner-layer is about 1 mm, and the Inter-layer is about 0.55 mm. The heat of the next deposited layer (N) causes the part of the previously deposited layer (N-1) to remelt, so the Inner-layer is the remelted mixed part of the lower part of the N layer and the upper part of the N-1 layer, the Inter-layer is the remaining part of the upper part of the N layer that has not been remelted by the N+1 layer. The Inter-layer has a high temperature gradient and high cooling rate, causing both developed and undeveloped dendrites to be frozen. The growth of Inner-layer depends on the nucleation and growth of new grains from the bottom of the molten pool. In contrast, the growth of Inter-layer depends on the continuous growth of the formed dendrites [Citation7], and the growth of Inner-layer is hindered by Inter-layer.
Figure 5. Macroscopic morphology of the deposited structure: (a1) BOT, (a2) Position A in BOT, (a3) Position B in BOT, (b1) BOS, (b2) Position C in BOS, (b3) Position D in BOS.
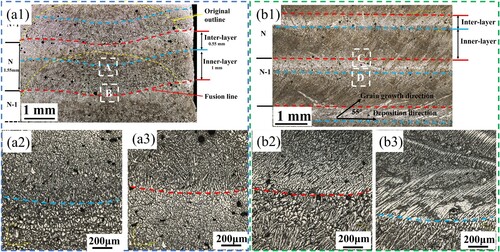
As shown in (a1), the concave arc fusion line (red line) and Inner-layer transition line (blue line) are observed on the BOT surface, showing the characteristics of a circular melt pool, with the deepest remelting position in the centre of the weld path. Moreover, the original outline (yellow line) of the weld path before remelting can be observed at the edge of the single wall. As shown in (a3), position B is the transition from the Inter-layer with larger grain size to the Inner-layer with smaller grain size. Obviously, the specific morphology of three-dimensional grains cannot be judged by observation in a single direction. As shown in (b3), the Inter-layer observed in BOS is a large dendrite with a very developed primary axis, the length can even reach the millimetre level, and the growth direction is almost along the horizontal direction. The Inner-layer is a dendrite with a small aspect ratio, the growth direction is along the direction of the maximum temperature gradient during solidification, growing obliquely upward, at an angle of 55° with the scanning direction.
In order to further evaluate the grain structure, EBSD data of the BOT surface and BOS surface were obtained, and the results are shown in and . As shown in (a1), it can be observed from the BOT surface that the last layer is mainly composed of columnar crystals with an aspect ratio as high as 3.45, and short columnar crystals are sandwiched between long columnar crystals. Feret diameter is used to measure the grain size, and the average grain size of the last layer is 59.5 μm. The inverse pole figure (IPF) shows that the last layer is mainly composed of <112> silk texture, and the maximum pole density in the (001) direction is 22.09. (b1) shows the alternating arrangement characteristics of columnar crystals (Inter-layer) and equiaxed crystals (Inner-layer). Due to the existence of equiaxed crystals in the Inner-layer, the average aspect ratio is reduced to 2.67, and the grain orientation is increased to <111>, <102> and <112> textures, and the maximum pole density in the (001) direction is reduced to 5.56. From (a1) and (b1), it can be observed that the grains on the BOT surface are slightly tilted toward both sides of the single-wall wall, which is an orientation feature caused by the maximum heat dissipation direction and partial collapse of the edge of the droplet.
Figure 6. (a1) EBSD orientation diagram of BOT-T, (a2) (001) PF and [001] IPF of BOT-T, (a3) statistical diagram of grain size of BOT-T, (b1) EBSD orientation diagram of BOT-M, (b2) (001) PF and [001] IPF of BOT-M, (b3) statistical diagram of grain size of BOT-M.
![Figure 6. (a1) EBSD orientation diagram of BOT-T, (a2) (001) PF and [001] IPF of BOT-T, (a3) statistical diagram of grain size of BOT-T, (b1) EBSD orientation diagram of BOT-M, (b2) (001) PF and [001] IPF of BOT-M, (b3) statistical diagram of grain size of BOT-M.](/cms/asset/da10beeb-b771-461e-93e8-e4c920f5a37e/nvpp_a_2348038_f0006_oc.jpg)
Figure 7. (a1) EBSD orientation diagram of BOS-T, (a2) (001) PF and [001] IPF of BOS-T, (a3) statistical diagram of grain size of BOS-T, (b1) EBSD orientation diagram of BOS-M, (b2) (001) PF and [001] IPF of BOS-M, (b3) statistical diagram of grain size of BOS-M.
![Figure 7. (a1) EBSD orientation diagram of BOS-T, (a2) (001) PF and [001] IPF of BOS-T, (a3) statistical diagram of grain size of BOS-T, (b1) EBSD orientation diagram of BOS-M, (b2) (001) PF and [001] IPF of BOS-M, (b3) statistical diagram of grain size of BOS-M.](/cms/asset/f1bafca7-757b-4a44-a6b3-e912e811d425/nvpp_a_2348038_f0007_oc.jpg)
In fact, the observation of the BOT surface cannot reveal the true shape of the grains, so the grains on the BOS surface are observed (). It can be observed from the BOS surface that the deposition structure is composed of columnar crystals (Inner-layer) with a short aspect ratio and columnar crystals (Inter-layer) with a long aspect ratio alternately arranged, and the grain growth direction is inclined upward at 55° along the scanning direction. The IPF shows that the last layer is mainly composed of <102> and <212> textures, and the maximum pole density in the (001) direction is 9.860. The BOS-M grain orientation is <111> texture, and the maximum pole density in the (001) direction increases to 16.56. It can be seen that the deposition structure is composed of complex three-dimensional coarse columnar crystals. The equiaxed crystals on the BOT surface are actually the front view of the columnar crystals on the BOS surface.
3.1.2. Second phases and alloy element analysis
It can be seen that the white second phases form a complex network structure along the grain boundaries and exists in the form of points inside the grains ((a)). The second phases can observe the lamellar morphology at high magnification, as shown in (b), which is a eutectic structure. EDS surface scanning was performed on the BOT and BOS surfaces, and the results are shown in the insets in (b,d). It can be seen that the segregation of alloy elements is more serious, with more distribution in the second phases and less distribution in the matrix. Chemical composition analysis was performed on the 6 points marked in , and the results are shown in . It can be seen that the elemental compositions at each point are relatively close, with the Al content being the highest, the Zn and Mg contents being relatively similar, and the Cu content being lower, which can be inferred to be a eutectic structure. Through EDS line scanning ((e)), it can be found that there is a huge element difference between the eutectic phase and the matrix, indicating that there is severe element segregation at the grain boundary.
Figure 8. (a) Low magnification BSE image of BOT-M, (b) High magnification BSE image of BOT-M, (c) Low magnification BSE image of BOS-M, (d) High magnification BSE image of BOS-M, (e) EDS line scan results.
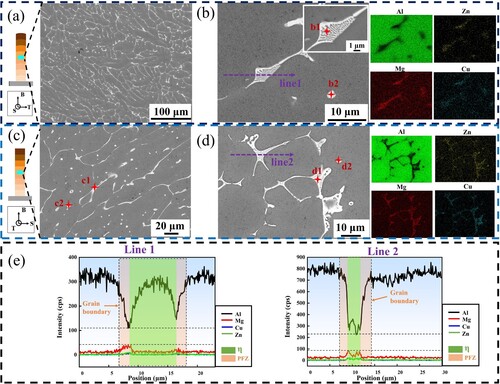
Table 2. Chemical compositions of second phases (at%).
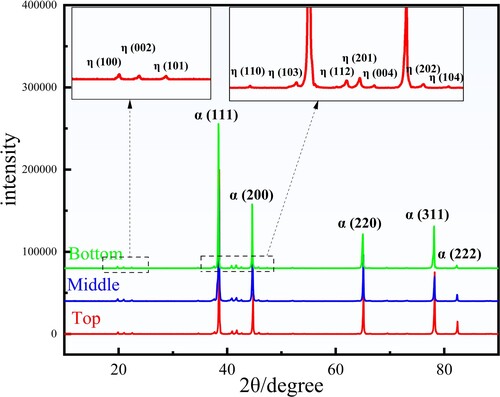
In fact, it is difficult to determine the specific type of the second phases from the measured chemical composition, so X-ray diffraction analysis was performed on the Top, Middle and Bottom positions of the component, and the results are shown in . Only the diffraction peaks of the solid solution α-Al and η (Mg(Zn, Cu, Al)2) phases can be identified in the XRD pattern, and the T (Al2Mg3Zn3), S (Al2CuMg) and θ (Al2Cu) phases that usually exist in Al-Zn-Mg-Cu alloys at room temperature are not detected [Citation52].
Figure 9. XRD patterns of Al-Zn-Mg-Cu alloy as-deposited components.
3.1.3. MPs, GBPs, PFZ
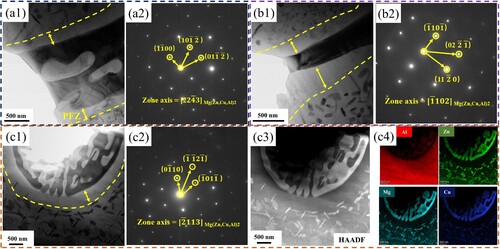
The exact structure of the different shaped second phases was analysed by TEM. shows the bright field images and selected area electron diffraction (SEAD) results of different morphological second phases. According to the calibration results, as shown in (a2), (b2) and (c2), it is mainly found that the skeletal, strip and point-like second phases in the triangular area are all η phases. It should be noted that by performing EDS scanning on the second phases, the results are shown in (c4), and the EDS pattern shows that the alloying elements Al, Zn, Mg, and Cu are distributed in the η phases. This is because the chemical composition of the η phases should be MgZn2, but the Zn atoms in it are easily replaced by Cu atoms and Al atoms to form a continuous solid solution without affecting the crystal structure. The results are similar to those reported by Chung et al [Citation53]. Mondal et al. found that when the Zn/Mg mass fraction ratio in aluminum alloys is >2.5, it is beneficial to the formation of η phases [Citation54]. The Zn/Mg ratio of the deposited material in this experiment is 3.7 > 2.5, so it can be inferred that the main second phases in the eutectic is the η phases.
Figure 10. TEM bright field image and SAED pattern of the second phases: (a1) The bright field image of the skeletal second phases at the triangle and (a2) the corresponding SAED pattern, (b1) The bright field image of the strip-shaped second phases and (b2) Corresponding SAED pattern, (c1) Point-like second phases and (c2) corresponding SAED image, (c3) corresponding HAADF-STEM image and (c4) EDS element scanning results.
In addition to the eutectic structure, the nanoscale precipitated phases are the decisive factor affecting the mechanical properties of Al-Zn-Mg-Cu alloy. At the same time, the precipitation behaviour plays a crucial role in the corrosion resistance of Al-Zn-Mg-Cu alloy, especially the SCC behaviour [Citation55]. Therefore, the characteristics and evolution of different precipitated phases should be studied. It is reported that three key factors in the microstructure affect the occurrence of SCC, namely MPs, GBPs and PFZ at grain boundaries [Citation56]. Therefore, the morphology, size and distribution of MPs, GBPs and PFZ in the Top, Middle and Bottom regions of the deposition components were observed respectively, and the results are shown in . The results show that MPs, GBPs and PFZ all show an increasing trend from top to bottom of the component. The size and distribution statistics of MPs, GBPs and PFZ are shown in .
Figure 11. TEM bright field images of precipitated phases at different positions: (a) Top region, (b) Middle region, (c) Bottom region. Respectively, 1 is a low-magnification image containing MPs, 2 is a high-magnification image containing MPs, 3 is a low-magnification image containing GBPs, and 4 is a high-magnification image containing GBPs.
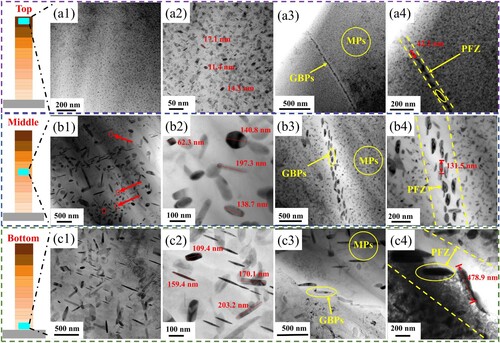
Table 3. Summaries of statistical parameters of MPs, GBPs and PFZ at different locations.
In the Top region, very fine point-like and short rod-like MPs were observed distributed in the matrix ((a1) and (a2)), the size of the GBPs was also very small, the GBPs were continuously distributed, the width of the PFZ was about 30 nm. In the Middle region, MPs grow significantly, with an average size of about 300 nm, and a large number of long rod-shaped, quadrilateral, rhombus-shaped and dot-shaped precipitates are distributed in the matrix ((b1) and (b2)). The GBPs and PFZ in the Middle region also grow significantly. The GBPs are continuously distributed in double rows, and the width of the PFZ grows to about 130 nm ((b4)). Compared with the Middle region, the average size of MPs in the Bottom region does not change significantly ((c1) and (c2)), but the sizes of GBPs and PFZ also grow dramatically, with GBPs growing to 300 nm and PFZ growing to 500 nm ((c4)). It is worth noting that although the average sizes of MPs in the Middle region and the Bottom region are not much different, there is a small precipitated phases with a size of about 30–150 nm in the matrix of the Middle region (marked by the red arrow in (b1)), which is not observed in the Bottom region, only large precipitated phases of 200–300 nm. This phenomenon also shows that the size of the precipitated phases in the Bottom region has reached a stable state, and at the same time, the diffusion of alloy elements in the matrix has also reached a balanced state.
In addition, PFZ is not only located at the grain boundary, but also appears at the phase boundary of the micron-scale second phases, as marked by the yellow dotted line in . The coarse second phases is often hard and brittle and can easily become a crack source. The existence of PFZ at this phase boundary not only weakens the crack propagation resistance, but also increases the potential difference between the second phases and the matrix, seriously endangering the mechanical properties and corrosion resistance.
The type of precipitated phases was further determined by HRTEM, HADDF-STEM and EDS, the results are shown in . Three precipitated phases were identified from the high-resolution images obtained along the [110]Al zone axis in the Top region, namely η′, T phase and GPII. In order to retrieve the types of precipitated phases in this article, we used the lattice parameters provided by Chung et al [Citation53]. On the [110]Al zone axis, GPII and η′ have similar habit planes. The identification of different phases was roughly dependent on their sizes, which increased from GPII zones (3–5 nm) to η′ (5–10 nm). Therefore, the GPII and η′ phases can be easily identified from (a1). In order to determine the coherent relationship between the type of MPs and the matrix, FFT was performed. The flaky η′ phases is considered to be a metastable phases with a hexagonal structure that is semi-coherent with the aluminum matrix [Citation57], the space group is P63/mmc [Citation58]. Observed on the [110]Al zone axis, the orientation relationship between η′ and the Al matrix is (0001)η'//(1
1)Al and [10
0]η'//[110]Al. The FFT pattern corresponding to η′ is shown in (a2), in which the stripe diffraction spots are located near 1/3 and 2/3 of
. The circular phases in (a1) are identified as T phase, and the corresponding FFT pattern is shown in (a3), the orientation relationship between T and Al matrix is (00
)T//(
1)Al and [210]T//[011]Al. Generally, the T phase has a wide composition range, with a Zn/Mg ratio of about 2.71, the T phase usually precipitates under low Zn/Mg ratio conditions in Al-Zn-Mg-Cu alloys [Citation59]. In this experiment, the deposition thermal cycle caused elements such as Zn and Mg to segregate at grain boundaries and dendrites, which reduced the concentrations of Zn and Mg in the Al matrix, creating favourable conditions for the formation of the T phase. The lath-shaped GPII zone is a Mg and Zn atom-rich region that is completely coherent with the aluminum matrix. The FFT pattern corresponding to the GPII is shown in (a4), which causes the stripes in the
direction to be significantly enhanced, which matches the diffraction characteristics of the GPII zone.
Figure 12. TEM characterisation of the precipitated phases: (a1) High-resolution image of the Top region obtained along the [110]Al zone axis, (a2–a4) Corresponding FFT diffractograms obtained from the lattice images of these three different precipitates in a1, (b1) Bright field image of the Middle region, (b2) SAED pattern of b1, (b3) High-resolution image of the polygonal precipitated phases with indexed FFT pattern, (b4) High-resolution image of the rectangular precipitated phases with indexed FFT pattern.
![Figure 12. TEM characterisation of the precipitated phases: (a1) High-resolution image of the Top region obtained along the [110]Al zone axis, (a2–a4) Corresponding FFT diffractograms obtained from the lattice images of these three different precipitates in a1, (b1) Bright field image of the Middle region, (b2) SAED pattern of b1, (b3) High-resolution image of the polygonal precipitated phases with indexed FFT pattern, (b4) High-resolution image of the rectangular precipitated phases with indexed FFT pattern.](/cms/asset/c3b5cffe-9cec-43ca-8563-c83414bacafb/nvpp_a_2348038_f0012_oc.jpg)
The usual precipitation sequence of Al-Zn-Mg-Cu alloy has been generally recognised as follows [Citation60]: supersaturated solid solution (SSS) → Guinier-Preston zones (GPI and GPII) → metastable η′ phase → stable η phase (MgZn2). The Middle region has experienced precipitation behaviour caused by additive manufacturing thermal cycles, so the GPII zones and most of the η′ phase may have been dissolved at this time. The coarse precipitated phases in the Middle region are shown in (b1). Further identification through HRTEM revealed that the polygonal and strip-shaped precipitates were the stable η phases ((b3) and (b4)).
3.2. Mechanical properties
3.2.1. Microhardness
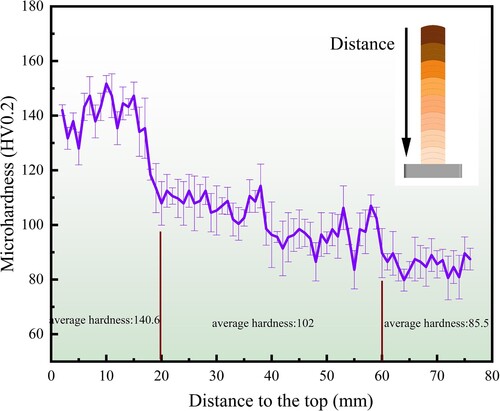
The hardness distribution is shown in . It is obvious that the hardness gradually decreases from top to bottom, and has a higher rate of decrease at about 20 mm from the top. Overall, the average hardness value for the 20 mm area from the top is approximately 140.6 HV. The rate of descent slows down in the 20–60 mm range from the top, and the average hardness is about 102 HV. The hardness value in the 60–80 mm area from the top basically does not change, and the average hardness is about 85.5 HV.
Figure 13. Microhardness distribution on BOT surface.
3.2.2. Tensile strength
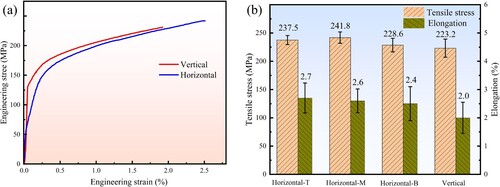
Tensile tests were conducted at different locations to evaluate the macroscopic mechanical properties, and the results are shown in . The average tensile strength and elongation of the deposited components can be obtained as 232.8 MPa and 2.4% respectively. It is worth noting that the tensile strength does not follow the change trend of hardness from top (Horizontal-T) to bottom (Horizontal-B) ((b)). Both tensile strength and elongation show dispersion in the data, which indicates the inhomogeneity of the mechanical properties of the deposited components. Comparing the tensile properties of the Middle region in the horizontal (Horizontal-B) and vertical directions (Vertical), the tensile strength in the horizontal direction is 8.3% higher than that in the vertical direction. In fact, tensile strength is affected by multiple factors such as interlayer defects, porosity and specific sampling locations, making it difficult to evaluate from a single factor.
Figure 14. (a) Typical tensile stress-strain curve, (b) strength and elongation.
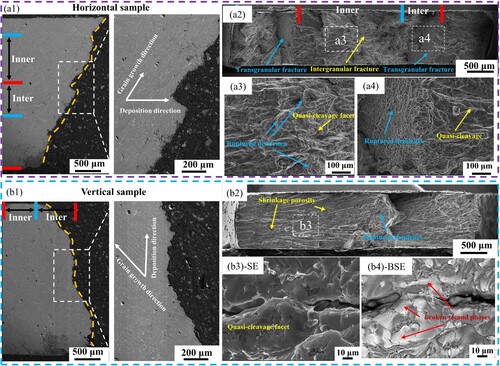
Overall, the large number of cleavage planes indicates that the fracture mode is brittle cleavage fracture, as shown in . Observing the fracture profile of the horizontal sample ((a1)), it can be found that the cracks mainly extend along the inclined columnar grain boundaries in the Inner-layer, and the fracture path is consistent with the grain growth direction, and when encountering the Inter-layer, a zigzag shape is formed. It can be judged from (a2) that intergranular fracture occurred in the Inner-layer. When the crack extended to the Inter-layer, it was hindered by the horizontal columnar crystals, and finally the Inter-layer underwent transgranular fracture. The outer surface of columnar crystals can be observed on the intergranular fracture surface ((a3)), and a dendritic fracture section is formed on the transgranular fracture surface ((a4)). Observing the fracture morphology of the vertical sample ((b1)), it can be found that the cracks still extend along the columnar grain boundaries. It can be judged from (b2) that when the intergranular fracture consumes the entire columnar grain boundary, a transgranular fracture will randomly occur and expand to another columnar crystal group surface, forming a dendritic fracture section. From (b3), it can be found that the interdendritic shrinkage porosity existing on the fracture surface is one of the reasons that affects the crack propagation. From the backscattered image ((b4)), it can be observed that the coarse second phases is continuously distributed at the grain boundaries.
Figure 15. (a1) Typical fracture of horizontal sample, (a2) macroscopic image of fracture section, (a3) secondary electron image of fracture of Inner-layer, (a4) secondary electron image of fracture of Inter-layer. (b1) Typical fracture of vertical sample, (b2) macroscopic image of the fracture section, (b3) high-magnification secondary electron image of the fracture section, (b4) high-magnification backscattered electron image of the fracture section.
3.3. Stress corrosion cracking behaviour
3.3.1. SCC susceptibility
shows the typical SSRT curves of Al-Zn-Mg-Cu deposition materials tested in air and NaCl solution. It can be obtained from the SSRT curve ((a)) that when performing SSRT in air, the following rules are followed: from Top to Bottom, the tensile strength decreases and the elongation increases. The Vertical sample has the highest average tensile strength of 292.2 MPa, and the Bottom sample has the highest average elongation of 10.8%. This rule is broken when SSRT is performed in NaCl solution ((b)). The Top sample has the highest average tensile strength of 139.4 MPa in NaCl solution, and the Middle sample has the highest average elongation of 2.8% in NaCl solution. By comparing SSRT curves in air and NaCl solution ((c)), it can be found that tensile strength and elongation decrease significantly in NaCl solution, indicating that NaCl solution seriously damages the mechanical properties of Al-Zn-Mg-Cu deposited materials. SCC susceptibility can be assessed simply by calculating the ratio of tensile strength/elongation that fails in corrosive solutions and in air, as shown in Equation (1), where is the strength loss rate and
is the elongation loss rate.
(1)
(1) In the formula, σc is the tensile strength of the sample in solution, σ0 is the tensile strength in dry air. δc is the elongation at break of the sample in solution, and δ0 is the corresponding value determined in dry air.
Figure 16. (a) Typical stress-strain curve after SSRT in air, (b) typical stress-strain curve after SSRT in corrosive solution, (c) typical stress-strain curves after SSRT in air and corrosive solution, (d) loss rates of tensile strength and elongation.
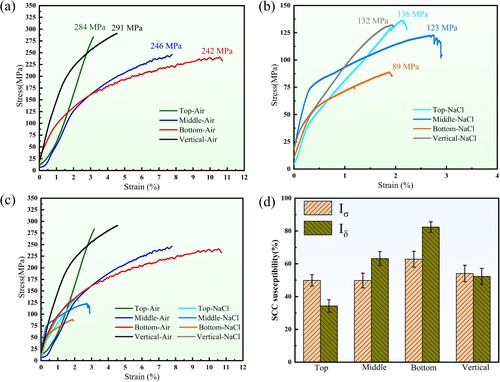
The statistically obtained values are shown in . Generally speaking, low Iσ and Iδ tend to represent good SCC resistance [Citation61]. The SCC resistance of each sample is compared in (d). The results show that Iσ and Iδ gradually increase from top to bottom, and the Bottom sample has the highest Iσ and Iδ, which are 62.8% and 82.4% respectively, which indicates that the Bottom sample has the lowest SCC resistance.
Table 4. SSRT parameters and correlative SCC indexes.
3.3.2. SCC fracture
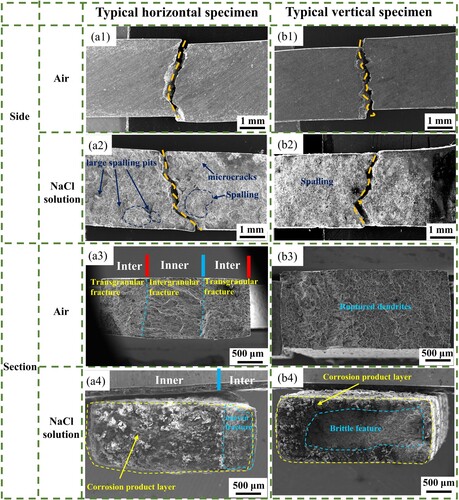
The side surfaces of the fracture surface after SSRT in air and NaCl solution are shown in . Through comparison, it can be found that the fracture paths in air and NaCl solution are the same. The cracks still extend along the inclined columnar grain boundaries in the Inner-layer. When they extend to the Inter-layer, a zigzag morphology is formed. Observing the fracture surface of SSRT in NaCl solution, severe spalling corrosion occurred on the surface, forming large-area spalling pits and microcracks, with large pieces of corrosion spalling and a large amount of corrosion products gathering. A large number of cleavage planes can be seen at the fracture surface ((a3)), indicating a typical brittle fracture. In NaCl solution, the fracture is surrounded by a layer of corrosion products, and the centre of the fracture is the brittle fracture area of the quasi-cleavage plane, which is a typical stress corrosion fracture morphology. For example, the fracture morphology of the Vertical sample after SSRT in NaCl solution is shown in (b4). Observing the fracture surface of the horizontal sample in the corrosive solution, as shown in (a4), it can be found that the fracture surface has obvious uneven morphology. This shows that the crack expansion rates of the Inner-layer and the Inter-layer are different during the corrosion fracture process, forming an uneven fracture process that is different from the Vertical sample ((b4)).
Figure 17. Fracture morphology after SSRT in air and NaCl solution.
4. Discussion
4.1. Formation mechanism of grain morphology
Analysis of the mechanical properties and SCC shows that inhomogeneity and anisotropy are determined by the grain morphology and precipitated phases morphology, so the evolution mechanism of the microstructure needs to be discussed. In Chapter 3.3.1, it was obtained that the deposition structure is composed of different grain shapes, which shows that the solidification methods at different positions of the molten pool during the WAAM process are different. It is well known that the temperature gradient (G) and the growth rate (R) jointly determine the microstructure of the molten pool solidification [Citation62]. This phenomenon can be explained through the discussion of G and R.
(a) shows the relationship between R and scanning speed (V). The purple line is the molten pool boundary at time t, and the red line is the molten pool boundary at time t + dt. As shown in the schematic diagram in the lower left corner of (a), the angle between the molten pool boundary normal direction n and V is denoted as α, and the angle between R and V is denoted as β. The distance that a given point on the molten pool boundary moves within the shortest time interval dt in the positive direction n satisfies the following relationship:
(2)
(2) Divide both sides of Equation (2) by dtcos(α-β) at the same time to get:
(3)
(3) At the fusion line of the additive molten pool, the grains grow along the direction of the maximum temperature gradient. The maximum temperature gradient direction at the fusion line is perpendicular to the fusion line, so the solidification process can be studied approximately as a directional solidification process. When dt is small, it can be considered that the difference between α and β is approximately zero, and Equation (3) can be expressed as:
(4)
(4) As shown in (b), α at the centre line position P1 at the top of the molten pool is equal to 0°. According to Equation (4), it has the maximum solidification speed, RP1 = V. The α at position P3 in the bottom area of the molten pool is equal to 90°, which has the minimum solidification speed, RP3 = 0. The R at position P2 in the middle region of the molten pool is between the two, and it can be obtained that RP1 > RP2 > RP3. Because the molten pool is elongated, the distance between the highest temperature point and the lowest temperature point at the top of the molten pool on the centre line is larger than the distance at the bottom of the molten pool. Therefore, the temperature gradient at the top boundary of the molten pool is smaller than that at the bottom boundary of the molten pool, so GP1 < GP2 < GP3 can be obtained. The influence of G and R on the morphology and size of the solidified structure is shown in (c) [Citation62]. The value of G/R determines the solidification mode and also determines the microstructure after solidification. The values of G/R at different positions are:
(5)
(5) The value of G/R plays a decisive role in the grain morphology of aluminum alloys. Based on the above results, it can be concluded that the P1 position is dominated by dendrite growth, and the P3 position is dominated by cellular crystal growth. Although this calculation is qualitative, it can still briefly explain the grain growth rules of the molten pool.
Generally speaking, the nucleation process of grains needs to satisfy both thermodynamics and the minimum structural size, that is, the nucleation work and critical nucleation radius. The crystallization process of the alloy in the molten pool occurs in the mushy zone with a certain concentration gradient at the front edge of the solid/ liquid interface. Therefore, the degree of supercooling in the mushy zone and the diffusion and migration of solute solvent atoms determine the grain nucleation and growth process. (a) is a schematic diagram of molten pool crystallization. During the WAAM process, the surface of the Inter-layer is exposed to the cooling air flow, resulting in surface supercooling, which triggers surface nucleation, solid crystal nuclei will be formed on the surface of the molten pool. Then, because the density of the solid crystal nuclei is greater than that of the surrounding liquid metal, they will grow and become new crystal grains as they sink into the molten pool. Therefore, the Inter-layer is mainly homogeneous nucleation growth.
Figure 18. (a) The relationship between R and V, (b) The distribution of temperature gradient and growth rate on the molten pool boundary, (c) The influence of temperature gradient G and growth rate R on the morphology and size of the solidified structure [Citation62].
![Figure 18. (a) The relationship between R and V, (b) The distribution of temperature gradient and growth rate on the molten pool boundary, (c) The influence of temperature gradient G and growth rate R on the morphology and size of the solidified structure [Citation62].](/cms/asset/de8eef6a-207c-49fa-8498-a9051f4d9557/nvpp_a_2348038_f0018_oc.jpg)
Figure 19. (a) Schematic diagram of molten pool crystallization, (b) The true morphology of grain orientation of cyclic interlayer structure.
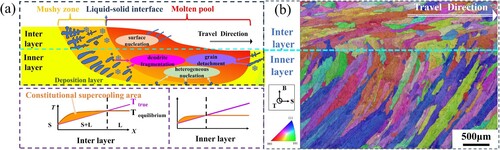
As mentioned above, the Inner-layer is a remelted structure. The strong convection of the Inner-layer destroys some dendrites. The forced convection leads to a reduction in the latent heat of melting and the temperature gradient at the S/L interface front. At this time, the homogenisation of the temperature field in the mushy zone leads to a reduction in supercooling [Citation63], which increases the nucleation rate. Therefore, compared to the Inter-layer, the Inner-layer has smaller component supercooling and a narrower mushy zone. At this time, the nucleation of new grains in the Inner-layer is affected by three mechanisms: (1) Molten pool convection causes the fragmentation of dendrite tips in the mushy zone, and these dendrite fragments serve as crystal nuclei required for the formation of new grains. (2) Molten pool convection causes partially melted grains to detach from the solid–liquid mixture surrounding the molten pool to form the required crystal nuclei. (3) Heterogeneous particles exist in the molten pool. The atoms of the liquid metal can be arranged into grain shapes on these heterogeneous particles, and these heterogeneous particles become heterogeneous crystal nuclei. It is obvious that the Inner-layer is mainly heterogeneous nucleation growth. Finally, under two different nucleation modes, the cyclic interlayer structure as shown in (b) is formed.
4.2. Evolution mechanism of precipitated phases
Al-Zn-Mg-Cu alloy is a heat-treatable strengthened aluminum alloy. The performance improvement mainly depends on the type, size and distribution of the precipitated phases [Citation64,Citation65]. The additive thermal cycle produces non-isothermal aging or annealing heat treatment effects on the structure, so it is necessary to analyse the evolution mechanism of the precipitated phases. For the non-equilibrium solidification process of multi-component alloys, the growth process of the precipitated phases is mainly realised through the diffusion of atoms, and the driving forces such as solid solubility, relative diffusivity of solute atoms and temperature need to be met [Citation66]. First, the top microstructure that has not been subjected to multiple thermal cycles is observed. From (a), it can be observed that there are a large number of quenching-induced η phases at grain boundaries, sub-grain boundaries and within grains. This is because although local rapid cooling occurs during the deposition process, the cooling rate is much lower than the rapid quenching in industrial production, and quenching-induced phases are often inevitably produced [Citation67]. Although the quenching-induced phases reduces the vacancy concentration, subsequent thermal cycles will produce solid solution and increase the equilibrium vacancy concentration. When the thermal cycle temperature meets the required temperature for non-isothermal aging to occur, the precipitation process of aging-induced η phases will be promoted. Therefore, the η phases in the deposited structure is a mixed structure when the quenching-induced process and the aging-induced process reach an equilibrium state. Generally speaking, it is difficult to distinguish between the two precipitated phases, but the quenching phases is often intentionally avoided in industrial production. Small-sized precipitates were found in the matrix in the Top area, as shown in (b). However, as the observation position moves away from the top of the sample, the size and density of the precipitates gradually increase. This phenomenon shows that the nanoscale precipitated phases is not formed in the solidification process, but precipitated in the subsequent thermal cycle of additive deposition, indicating that the deposited layer undergoes a complex evolution process of the precipitated phases under thermal cycles. A large number of dislocations were also observed in the Top deposited material, as shown in (c). These dislocations can promote nucleation during non-isothermal aging and become channels for element diffusion.
Figure 20. (a) Second phases precipitated by quenching, (b) MPs precipitated by quenching (dark field phases), (c) Dislocation, (d) Schematic diagram of the influence of thermal cycles on the precipitation process.
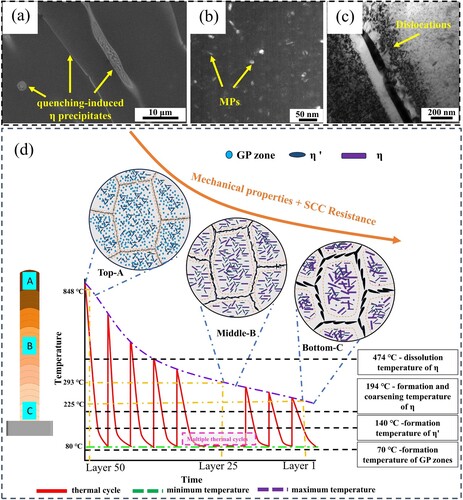
After the above analysis, combined with the DSC curve of the deposited material (), a schematic diagram of the thermal cycle precipitation process was obtained, as shown in (d). Our team has previously collected and simulated the temperature changes of the thermal cycle [Citation68]. The thermal cycle curve in (d) only illustrates the trend change of the deposition thermal cycle. In the top region A, which has not experienced multiple thermal cycles, a fine quenching-induced η phases is formed, no solid solution process occurs, and has a small precipitated phases size and a narrow PFZ. In the middle region B, the dynamically unstable state of solid solution and aging is reached, and gradually tends to the aging state. First, stay in the solid solution temperature range to dissolve the η phases induced by quenching. As the heat source moves away and the temperature decreases, the nucleation, growth and coarsening of the η phases occurs in the aging temperature range. At this time, a coarse precipitated phases and a wide PFZ are formed, and the aging-induced η phases becomes the main structure. Compared with region B, the bottom region C experienced a similar precipitation process as B, but only a long precipitation process occurred in the subsequent period. The precipitated phases are in an obvious over-aging stage, the elements further diffuse, and the growth of the precipitated phases size and PFZ width reaches a stable state.
4.3. Inhomogeneity and anisotropy
4.3.1. Inhomogeneity
It can be seen from the results in Chapters 3.2 and 3.3 that the mechanical properties and SCC susceptibility of WAAM Al-Zn-Mg-Cu alloy have obvious inhomogeneity and anisotropy. Al-Zn-Mg-Cu alloy is a high-strength aluminum alloy. The second phases particles precipitated during the aging process make the most significant contribution to alloy strengthening [Citation69]. These dispersed second phases particles desolvated from the supersaturated solid solution hinder dislocation movement, thereby increasing the strength of the alloy. Therefore, the performance of Al-Zn-Mg-Cu alloy is mainly affected by the distribution, density, morphology and size of the precipitated phases. The grain size of additive components does not change significantly along the height direction. It is obvious that the inhomogeneity is mainly related to the distribution of precipitated phases, and the anisotropy is mainly related to the morphology of the grains.
The main strengthening phases of Al-Zn-Mg-Cu alloy include GP zone and η′ phases, in which the GP zone is completely coherent with the aluminum matrix, the η′ phases is semi-coherent with the aluminum alloy, and the η′ phases is the main age-strengthening phases [Citation64], while the η phases is incoherent with the matrix. The results can be obtained from and . A small amount of GP zone and η′ phases are identified in the Top, and the alloying elements are solid dissolved into the aluminum matrix, so the strengthening mechanism is mainly solid solution strengthening. The Middle and Bottom recognise the η phases, so it is the second phases strengthening. Second phases strengthening can be described by the Orowan relationship [Citation70]:
(6)
(6) Here, α is the material constant, f is the particle volume fraction, and r is the particle radius. It can be judged from Equation (6) that the strengthening effect decreases as the number of second phases decreases and the size increases. Therefore, the hardness and strength show inhomogeneity, as shown in (a).
Figure 21. (a) Inhomogeneity of microstructure and mechanical properties, (b) Anisotropy of mechanical properties and SCC susceptibility.
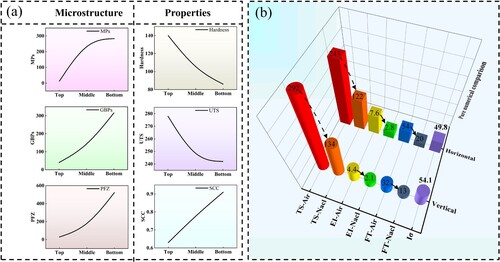
The SCC mechanism of Al-Zn-Mg-Cu alloy is mainly hydrogen-induced cracking and anodic dissolution. It is generally believed that intergranular corrosion mainly occurs in the early stage of SCC, and the η phases serves as the anode at the grain boundary and is corroded preferentially [Citation71]. That is, due to the electrochemical potential difference between the grain boundary precipitated phases and the surrounding aluminum matrix, it results in the formation of a corrosion galvanic cell, which in turn leads to anodic dissolution of the precipitated phases and the occurrence of SCC. GBPs and PFZ are highly reactive areas in the alloy and are also key factors affecting SCC. Although multivariable corrosion behaviour has certain limitations, it is generally believed that discontinuous GBPs and narrow PFZ are beneficial to improving SCC resistance [Citation72,Citation73]. As shown in (a), under the action of the additive thermal cycle, the GBPs coarsen and the PFZ width increases from the Top to Bottom, and the alloy elements aggregate in the precipitated phases. This increases the potential difference between grain boundaries, within grains and PFZ, thereby increasing SCC susceptibility. The research results of Li et al. [Citation74] and Liu et al. [Citation75] can prove the correctness of this conclusion.
4.3.2. Anisotropy
The crack generation and expansion of the tensile specimen mainly occurs on the grain boundaries in the direction of the long axis of the columnar crystals (), while the stress corrosion cracks also mainly propagate along the grain boundaries in the direction of the long axis of the columnar crystals (). It can be seen that the shearing stress perpendicular to the long axis of the columnar crystal is the main force leading to the crack generation and propagation. The growth direction of the columnar crystals of the deposited structure is inclined upward at 55° along the scanning direction. Therefore, when the direction of the tensile stress F is horizontal, the shearing stress of crack propagation is Fsin55° = 0.82F. When the direction of the tensile stress F is vertical, the shearing stress is Fcos55° = 0.57F. Obviously, to make the shear stress reach the critical stress for crack generation, the tensile stress required in the vertical direction is greater than that in the horizontal direction, so the strength of the vertical tensile sample is higher than that of the horizontal sample.
Stress corrosion cracks initiate at the location of crack nucleation. When the crack propagates and mechanical damage occurs or the passivation film is damaged, it will lead to corrosion of the exposed new metal and the initiation of crack sources. After an SCC crack is formed, the crack tip and the metal surface will form a corrosion cell, thereby prompting the crack tip to rapidly dissolve [Citation76]. Therefore, similar to the conventional tensile fracture mechanism, the vertical sample has higher tensile strength in the corrosive solution. It should be noted that although horizontal sample and vertical sample at the same position of additive components have the same or similar SCC susceptibility, there are large differences in fracture time and elongation, and there is obvious anisotropy, as shown in (b). Therefore, the use of conventional stress corrosion susceptibility testing methods to evaluate the SCC resistance of additive materials has certain limitations.
Since there are still unknown things in the currently deposited Al-Zn-Mg-Cu alloy, and the SCC susceptibility is also unknown, it is obviously unreasonable to use the heat treatment system of conventional manufacturing materials for performance or corrosion resistance enhancement. It also does not meet the strict definition of in-situ additive manufacturing. In our research layout, we believe that it is crucial to first clarify the corrosion behaviour of the deposited structure caused by additive heat for subsequent strength-corrosion resistance strengthening. We can actively design deposition strategies based on the influence of nanophase precipitation paths and grain morphology on SCC to avoid rough post-deposition processing. In fact, WAAM is mainly used for rapid prototyping of large structural parts, so post-heat treatment has obvious limitations. Trying to control corrosion performance during the deposition process will be our subsequent research plan.
5. Conclusions
In this work, the microstructure, mechanical properties and SCC susceptibility of WAAM Al-Zn-Mg-Cu alloy components were examined in detail, and the key reasons leading to inhomogeneity and anisotropy were analysed. The relationship between additive process – microstructure – mechanical properties – service performance was established. The following conclusions can be drawn:
The deposition structure consists of alternately arranged coarse columnar crystals (Inter-layer) with an aspect ratio of 3.45 and fine columnar crystals (Inner-layer) with an aspect ratio of 2.67. The low G/R value and homogeneous nucleation at the top of the molten pool cause the Inter-layer to solidify in the form of dendrite growth, while the high G/R value and heterogeneous nucleation at the bottom of the molten pool cause the Inner-layer to solidify in the form of cellular crystal growth.
The sizes of MPs, GBPs and PFZ increase to varying degrees as the distance from the top increases. From top to bottom, the size of MPs increases from 12.6 nm to 283.5 nm, the size of GBPs increases from 40.2 nm to 316.7 nm, and the PFZ width increases from 29.0 nm to 523.5 nm. Different positions of the deposited component experience different passes of non-isothermal thermal cycles, and different types of precipitated phases undergo dynamic unstable processes of solid solution and exsolution. The top MPs are the unstable η′ phases and GPII, and the bottom is the stable η phases.
Hardness, tensile strength, and SCC resistance decrease with increasing distance from the top, showing severe inhomogeneity. From top to bottom, the hardness dropped from 140.6 HV to 85.5 HV, the slow rate tensile strength dropped from 278.5 MPa to 242.3 MPa, and the SCC susceptibility increased from 49.9%/34.3% to 62.8%/82.4%.
The tensile strength and SCC susceptibility have large differences in the vertical and horizontal directions, exhibiting severe anisotropy. Although the SCC susceptibility factor in the horizontal and vertical directions are similar, 49.8%/63.2% and 54.1%/52.3% respectively, the tensile strength, fracture time and elongation are quite different. Therefore, the use of conventional SCC susceptibility testing methods to evaluate the SCC resistance of additive materials has certain limitations.
The inhomogeneity is attributed to the strengthening mechanism of unevenly distributed precipitated phases caused by additive thermal cycling. The anisotropy is attributed to the competitive behaviour of long-axis grains inclined to the scanning direction and short-axis grains inclined to the building direction during deformation and stress corrosion cracking.
Disclosure statement
No potential conflict of interest was reported by the author(s).
Data availability statement
The data that support the findings of this study are available from the corresponding author upon reasonable request.
Additional information
Funding
References
- Ahmet E, Isık A. A general view of industry 4.0 revolution from cybersecurity perspective. Int J Intell Syst Appl Eng. 2020;8:11–20. doi:10.18201/ijisae.2020158884
- Williams SW, Martina F, Addison AC, et al. Wire + arc additive manufacturing. Mater Sci Technol. 2016;32:641–647. doi:10.1179/1743284715Y.0000000073
- Wu B, Pan Z, Ding D, et al. A review of the wire arc additive manufacturing of metals: properties, defects and quality improvement. J Manuf Process. 2018;35:127–139. doi:10.1016/j.jmapro.2018.08.001
- DebRoy T, Wei H, Zuback J, et al. Additive manufacturing of metallic components – process, structure and properties. Prog Mater Sci. 2018;92:112–224. doi:10.1016/j.pmatsci.2017.10.001
- Lu B, Li D, Tian X. Development trends in additive manufacturing and 3D printing. Engineering. 2015;1:085–089. doi:10.15302/J-ENG-2015012
- Cunningham C, Flynn J, Shokrani A, et al. Invited review article: strategies and processes for high quality wire arc additive manufacturing. Addit Manuf. 2018;22:672–686. doi:10.1016/j.addma.2018.06.020
- Dong B, Cai X, Lin S, et al. Wire arc additive manufacturing of Al-Zn-Mg-Cu alloy: microstructures and mechanical properties. Addit Manuf. 2020;36:101447. doi:10.1016/j.addma.2020.101447
- Zhou Y, Lin X, Kang N, et al. Influence of travel speed on microstructure and mechanical properties of wire + arc additively manufactured 2219 aluminum alloy. J Mater Sci Technol. 2020;37:143–153. doi:10.1016/j.jmst.2019.06.016
- Qi T, Zhu H, Zhang H, et al. Selective laser melting of Al7050 powder: melting mode transition and comparison of the characteristics between the keyhole and conduction mode. Mater Des. 2017;135:257–266. doi:10.1016/j.matdes.2017.09.014
- Montero-Sistiaga ML, Mertens R, Vrancken B, et al. Changing the alloy composition of Al7075 for better processability by selective laser melting. J Mater Process Technol. 2016;238:437–445. doi:10.1016/j.jmatprotec.2016.08.003
- Wang H, Jiang W, Ouyang J, et al. Rapid prototyping of 4043 Al-alloy parts by VP-GTAW. J Mater Process Technol. 2004;148:93–102. doi:10.1016/j.jmatprotec.2004.01.058
- Kok Y, Tan XP, Wang P, et al. Anisotropy and heterogeneity of microstructure and mechanical properties in metal additive manufacturing: a critical review. Mater Des. 2018;139:565–586. doi:10.1016/j.matdes.2017.11.021
- Sun L, Jiang F, Huang R, et al. Anisotropic mechanical properties and deformation behavior of low-carbon high-strength steel component fabricated by wire and arc additive manufacturing. Mater Sci Eng A. 2020;787:139514. doi:10.1016/j.msea.2020.139514
- Carroll BE, Palmer TA, Beese AM. Anisotropic tensile behavior of Ti–6Al–4V components fabricated with directed energy deposition additive manufacturing. Acta Mater. 2015;87:309–320. doi:10.1016/j.actamat.2014.12.054
- Gokcekaya O, Ishimoto T, Hibino S, et al. Unique crystallographic texture formation in Inconel 718 by laser powder bed fusion and its effect on mechanical anisotropy. Acta Mater. 2021;212:116876. doi:10.1016/j.actamat.2021.116876
- Zhang X, Xiao Z, Yu W, et al. Influence of erbium addition on the defects of selective laser-melted 7075 aluminium alloy. Virtual Phys Prototyp. 2022;17:406–418. doi:10.1080/17452759.2021.1990358
- Yu Z, Yuan T, Xu M, et al. Microstructure and mechanical properties of Al-Zn-Mg-Cu alloy fabricated by wire + arc additive manufacturing. J Manuf Process. 2021;62:430–439. doi:10.1016/j.jmapro.2020.12.045
- Hamrani A, Bouarab FZ, Agarwal A, et al. Advancements and applications of multiple wire processes in additive manufacturing: a comprehensive systematic review. Virtual Phys Prototyp. 2023;18:e2273303. doi:10.1080/17452759.2023.2273303
- Fu R, Tang S, Lu J, et al. Hot-wire arc additive manufacturing of aluminum alloy with reduced porosity and high deposition rate. Mater Des. 2021;199:109370. doi:10.1016/j.matdes.2020.109370
- Guo X, Li H, Xue P, et al. Microstructure and mechanical properties of 600 MPa grade ultra-high strength aluminum alloy fabricated by wire-arc additive manufacturing. J Mater Sci Technol. 2023;149:56–66. doi:10.1016/j.jmst.2022.12.007
- Li S, Ning J, Zhang G-F, et al. Microstructural and mechanical properties of wire-arc additively manufactured Al–Zn–Mg aluminum alloy: the comparison of as-deposited and heat-treated samples. Vacuum. 2021;184:109860. doi:10.1016/j.vacuum.2020.109860
- Guo Y, Han Q, Lu W, et al. Microstructure tuning enables synergistic improvements in strength and ductility of wire-arc additive manufactured commercial Al-Zn-Mg-Cu alloys. Virtual Phys Prototyp. 2022;17:649–661. doi:10.1080/17452759.2022.2048236
- Liu D, Wu D, Ma G, et al. Effect of post-deposition heat treatment on laser-TIG hybrid additive manufactured Al-Cu alloy. Virtual Phys Prototyp. 2020;15:445–459. doi:10.1080/17452759.2020.1818021
- Pruncu CI, Hopper C, Hooper PA, et al. Study of the effects of hot forging on the additively manufactured stainless steel preforms. J Manuf Process. 2020;57:668–676. doi:10.1016/j.jmapro.2020.07.028
- Zhang M, Wang B, Li X, et al. Grain refinement of NiTi alloys during ultrasound-assisted wire-arc directed energy deposition. Virtual Phys Prototyp. 2024;19:e2289465. doi:10.1080/17452759.2023.2289465
- Su Y, Savinov R, Wang Y, et al. Microstructure and property enhancement of 7075 aluminium alloy via laser metal deposition augmented by in-situ ultrasonic vibration. Virtual Phys Prototyp. 2024;19:e2301482. doi:10.1080/17452759.2023.2301482
- Hackel L, Rankin JR, Rubenchik A, et al. Laser peening: a tool for additive manufacturing post-processing. Addit Manuf. 2018;24:67–75. doi:10.1016/j.addma.2018.09.013
- Lyu F, Wang L, Wang J, et al. Integrated control mechanism of ultrasound and ZrO2 particles on differential microstructures for the wire arc additive manufacturing. Virtual Phys Prototyp. 2023;18:e2274492. doi:10.1080/17452759.2023.2274492
- Wang T, Kang J, Darnell M, et al. Ultrasonically assisted hot-wire arc additive manufacturing process of AA7075 metal matrix nanocomposite. J Alloys Compd. 2023;936:168298. doi:10.1016/j.jallcom.2022.168298
- Li X, Zhang M, Fang X, et al. Improved strength-ductility synergy of directed energy deposited AZ31 magnesium alloy with cryogenic cooling mode. Virtual Phys Prototyp. 2023;18:e2170252. doi:10.1080/17452759.2023.2170252
- Hönnige J, Colegrove PA, Ganguly S, et al. Control of residual stress and distortion in aluminium wire + arc additive manufacture with rolling. Addit Manuf. 2018;22:775–783. doi:10.1016/j.addma.2018.06.015
- Fang X, Zhang L, Chen G, et al. Microstructure evolution of wire-arc additively manufactured 2319 aluminum alloy with interlayer hammering. Mater Sci Eng A. 2021;800:140168. doi:10.1016/j.msea.2020.140168
- Yuan T, Xu D, Jiang X, et al. Enhanced strength-plasticity of 2319 Al-Cu alloy formed by hybrid interlayer friction stir processing and wire-arc additive manufacturing. J Mater Process Technol. 2023;321:118146. doi:10.1016/j.jmatprotec.2023.118146
- Knight S, Pohl K, Holroyd N, et al. Some effects of alloy composition on stress corrosion cracking in Al–Zn–Mg–Cu alloys. Corros Sci. 2015;98:50–62. doi:10.1016/j.corsci.2015.05.016
- Zhang X, Liu B, Zhou X, et al. Laser welding introduced segregation and its influence on the corrosion behaviour of Al-Cu-Li alloy. Corros Sci. 2018;135:177–191. doi:10.1016/j.corsci.2018.02.044
- Sames WJ, List F, Pannala S, et al. The metallurgy and processing science of metal additive manufacturing. Int Mater Rev. 2016;61:315–360. doi:10.1080/09506608.2015.1116649
- Sander G, Tan J, Balan P, et al. Corrosion of additively manufactured alloys: a review. Corrosion. 2018;74:1318–1350. doi:10.5006/2926
- Rubben T, Revilla RI, De Graeve I. Influence of heat treatments on the corrosion mechanism of additive manufactured AlSi10Mg. Corros Sci. 2019;147:406–415. doi:10.1016/j.corsci.2018.11.038
- Gharbi O, Jiang D, Feenstra D, et al. On the corrosion of additively manufactured aluminium alloy AA2024 prepared by selective laser melting. Corros Sci. 2018;143:93–106. doi:10.1016/j.corsci.2018.08.019
- Immarigeon J, Holt R, Koul A, et al. Lightweight materials for aircraft applications. Mater Charact. 1995;35:41–67. doi:10.1016/1044-5803(95)00066-6
- Hutasoit N, Javed MA, Rashid RAR, et al. Effects of build orientation and heat treatment on microstructure, mechanical and corrosion properties of Al6061 aluminium parts built by cold spray additive manufacturing process. Int J Mech Sci. 2021;204:106526. doi:10.1016/j.ijmecsci.2021.106526
- Zhou L, Hyer H, Chang J, et al. Microstructure, mechanical performance, and corrosion behavior of additively manufactured aluminum alloy 5083 with 0.7 and 1.0 wt% Zr addition. Mater Sci Eng A. 2021;823:141679. doi:10.1016/j.msea.2021.141679
- Zhang X, Lv Y, Tan S, et al. Microstructure and corrosion behaviour of wire arc additive manufactured AA2024 alloy thin wall structure. Corros Sci. 2021;186:109453. doi:10.1016/j.corsci.2021.109453
- Revilla RI, Verkens D, Rubben T, et al. Corrosion and corrosion protection of additively manufactured aluminium alloys—a critical review. Materials (Basel). 2020;13:4804. doi:10.3390/ma13214804
- Xu C, Peng Y, Chen L-Y, et al. Corrosion behavior of wire-arc additive manufactured and as-cast Ni-Al bronze in 3.5 wt% NaCl solution. Corros Sci. 2023;215:111048. doi:10.1016/j.corsci.2023.111048
- Wu B, Pan Z, Li S, et al. The anisotropic corrosion behaviour of wire arc additive manufactured Ti-6Al-4V alloy in 3.5% NaCl solution. Corros Sci. 2018;137:176–183. doi:10.1016/j.corsci.2018.03.047
- Yuan T, Zhao X, Shan H, et al. Microcosmic mechanism of performance enhancement of wire arc additive manufactured Al-Zn-Mg-Cu alloy based on heat treatment. Sci Technol Weld Joining. 2023;28:569–579. doi:10.1080/13621718.2023.2209420
- Yuan T, Ren X, Chen S, et al. Al–Zn–Mg–Cu alloy with both high strength and high plasticity fabricated with wire arc additive manufacturing. Sci Technol Weld Joining. 2023;28:81–88. doi:10.1080/13621718.2022.2117532
- Chen Z, Mo Y, Nie Z. Effect of Zn content on the microstructure and properties of super-high strength Al-Zn-Mg-Cu alloys. Metall Mater Trans A. 2013;44:3910–3920. doi:10.1007/s11661-013-1731-x
- Adler PN, DeIasi R. Calorimetric studies of 7000 series aluminum alloys: II. Comparison of 7075, 7050 and RX720 alloys. Metall Trans A. 1977;8:1185–1190. doi:10.1007/BF02667404
- Liu J, Duarte HP, Kou S. Evidence of back diffusion reducing cracking during solidification. Acta Mater. 2017;122:47–59. doi:10.1016/j.actamat.2016.09.037
- Liu Y, Jiang D, Xie W, et al. Solidification phases and their evolution during homogenization of a DC cast Al–8.35Zn–2.5Mg–2.25Cu alloy. Mater Charact. 2014;93:173–183. doi:10.1016/j.matchar.2014.04.004
- Chung T-F, Yang Y-L, Huang B-M, et al. Transmission electron microscopy investigation of separated nucleation and in-situ nucleation in AA7050 aluminium alloy. Acta Mater. 2018;149:377–387. doi:10.1016/j.actamat.2018.02.045
- Mondal C, Mukhopadhyay A. On the nature of T(Al2Mg3Zn3) and S(Al2CuMg) phases present in as-cast and annealed 7055 aluminum alloy. Mater Sci Eng A. 2005;391:367–376. doi:10.1016/j.msea.2004.09.013
- Guo F, Duan S, Pan Y, et al. Stress corrosion behavior and microstructure analysis of Al-Zn-Mg-Cu alloys friction stir welded joints under different aging conditions. Corros Sci. 2023;210:110821. doi:10.1016/j.corsci.2022.110821
- Xie P, Chen S, Chen K, et al. Enhancing the stress corrosion cracking resistance of a low-Cu containing Al-Zn-Mg-Cu aluminum alloy by step-quench and aging heat treatment. Corros Sci. 2019;161:108184. doi:10.1016/j.corsci.2019.108184
- Li X, Hansen V, Gjønnes J, et al. HREM study and structure modeling of the η′ phase, the hardening precipitates in commercial Al-Zn-Mg alloys. Acta Mater. 1999;47:2651–2659. doi:10.1016/S1359-6454(99)00138-X
- Yang W, Ji S, Wang M, et al. Precipitation behaviour of Al–Zn–Mg–Cu alloy and diffraction analysis from η′ precipitates in four variants. J Alloys Compd. 2014;610:623–629. doi:10.1016/j.jallcom.2014.05.061
- Löffler H, Kovacs I, Lendvai J. Decomposition processes in al-zn-mg alloys. J Mater Sci. 1983;18:2215–2240. doi:10.1007/BF00541825
- Sha G, Cerezo A. Early-stage precipitation in Al–Zn–Mg–Cu alloy (7050). Acta Mater. 2004;52:4503–4516. doi:10.1016/j.actamat.2004.06.025
- Rout PK, Ghosh M, Ghosh K. Effect of solution pH on electrochemical and stress corrosion cracking behaviour of a 7150 Al–Zn–Mg–Cu alloy. Mater Sci Eng A. 2014;604:156–165. doi:10.1016/j.msea.2014.02.036
- Kou S. Welding metallurgy. Hoboken (NJ): A John Wiley & Sons, Inc.; 2003, 17–20.
- Derekar K. A review of wire arc additive manufacturing and advances in wire arc additive manufacturing of aluminium. Mater Sci Technol. 2018;34:895–916. doi:10.1080/02670836.2018.1455012
- Guyot P, Cottignies L. Precipitation kinetics, mechanical strength and electrical conductivity of AlZnMgCu alloys. Acta Mater. 1996;44:4161–4167. doi:10.1016/S1359-6454(96)00033-X
- Thevenet D, Mliha-Touati M, Zeghloul A. The effect of precipitation on the Portevin-Le Chatelier effect in an Al–Zn–Mg–Cu alloy. Mater Sci Eng A. 1999;266:175–182. doi:10.1016/S0921-5093(99)00029-5
- Liu Y, Jiang D, Li B, et al. Heating aging behavior of Al–8.35Zn–2.5Mg–2.25Cu alloy. Mater Des. 2014;60:116–124. doi:10.1016/j.matdes.2014.03.060
- Lim S, Yun S, Nam SW. Improved quench sensitivity in modified aluminum alloy 7175 for thick forging applications. Mater Sci Eng A. 2004;371:82–90. doi:10.1016/S0921-5093(03)00653-1
- Xu M, Chen S, Yuan T, et al. Effect of thermal cycles on the microstructure and properties of the Al–Zn–Mg–Cu alloy during wire-arc additive manufacturing. J Alloys Compd. 2022;928:167172. doi:10.1016/j.jallcom.2022.167172
- Ardell AJ. Precipitation hardening. Metall Trans A. 1985;16:2131–2165. doi:10.1007/BF02670416
- Kelly A, Fine M. The strength of an alloy containing zones. Acta Metall. 1957;5:365–367. doi:10.1016/0001-6160(57)90003-2
- Kairy S, Turk S, Birbilis N, et al. The role of microstructure and microchemistry on intergranular corrosion of aluminium alloy AA7085-T7452. Corros Sci. 2018;143:414–427. doi:10.1016/j.corsci.2018.08.033
- Lin J-C, Liao H-L, Jehng W-D, et al. Effect of heat treatments on the tensile strength and SCC-resistance of AA7050 in an alkaline saline solution. Corros Sci. 2006;48:3139–3156. doi:10.1016/j.corsci.2005.11.009
- Huang L, Chen K, Li S, et al. Influence of high-temperature pre-precipitation on local corrosion behaviors of Al–Zn–Mg alloy. Scr Mater. 2007;56:305–308. doi:10.1016/j.scriptamat.2006.09.028
- Li Z, Chen L, Tang J, et al. Response of mechanical properties and corrosion behavior of Al–Zn–Mg alloy treated by aging and annealing: a comparative study. J Alloys Compd. 2020;848:156561. doi:10.1016/j.jallcom.2020.156561
- Liu Y, Pan Q, Li H, et al. Revealing the evolution of microstructure, mechanical property and corrosion behavior of 7A46 aluminum alloy with different ageing treatment. J Alloys Compd. 2019;792:32–45. doi:10.1016/j.jallcom.2019.03.324
- Burleigh T. The postulated mechanisms for stress corrosion cracking of aluminum alloys: a review of the literature 1980–1989. Corrosion. 1991;47:89–98. doi:10.5006/1.3585235