
 ?Mathematical formulae have been encoded as MathML and are displayed in this HTML version using MathJax in order to improve their display. Uncheck the box to turn MathJax off. This feature requires Javascript. Click on a formula to zoom.
ABSTRACT
This study evaluates topologically optimized lattice structures for high strain rate loading, crucial for impact resistance. Using the BESO (Bidirectional Evolution Structural Optimisation) topology optimisation algorithm, CompIED and ShRIED topologies are developed for enhanced energy absorption and impact resistance. Micromechanical simulations reveal CompIED surpasses theoretical elasticity limits for isotropic cellular materials, while the hybrid design ShRComp achieves theoretical maximum across all relative densities. Compared to TPMS, truss, and plate lattices, the proposed structures exhibit higher uniaxial modulus. Manufactured via fused deposition modeling with ABS thermoplastic, their energy absorption capabilities are assessed through compression tests and impact simulations. The ShRComp lattice demonstrates superior energy absorption under compression compared to CompIED. Impact analyses of CompIED and ShRComp sandwich structures at varying velocities show exceptional resistance to perforation and higher impact absorption efficiency, outperforming other classes of sandwich structures at similar densities. These findings position these new and novel topologies as promising candidates for impact absorption applications.
1. Introduction
Advancements in material synthesis and additive manufacturing have allowed for the creation of multifunctional structures with unique material properties not typically found in traditional materials. Lattice materials are artificially created structures that combine lightweight and robust mechanical properties due to their porous nature, inspired by natural architects. They are designed at a microstructural level to exhibit distinctive mechanical characteristics such as negative Poisson’s ratio [Citation1], negative stiffness [Citation2], and a high strength-to-weight ratio [Citation3]. Various lattice materials have been created over the years, such as truss- [Citation4], surface- [Citation5], and plate-based lattice materials [Citation6]. The microstructural design of a lattice material has a considerable impact on the mechanical response on a macroscopic scale. Therefore, it is essential to optimise the topological features of the microstructure in order to improve the overall performance of the lattice structure.
Extensive research has focused on the link between topology and mechanics in various lattice materials. Altamimi et al. [Citation7] studied the mechanical characteristics of thirty varieties of strut-based lattice materials. By merging several lattice structures in a hybrid method, a reduction in anisotropic behaviour was achieved, leading to an overall improvement in mechanical characteristics. Topology hybridisation refers to combining dissimilar types of designs (i.e. parent structures) to form an offspring structure that exhibits unique mechanical properties when compared to those of the parent structures [Citation8]. Ayaz Uddin et al. [Citation9] found that modifying the shape of a pyramidal lattice structure enhanced its elastic modulus, collapse strength, and energy absorption in comparison to a traditional pyramidal lattice structure. Ejeh et al. [Citation10, Citation11] outlined methods to improve the quasi-static, dynamic, and flexural characteristics of lightweight TPMS-based structures by using functional gradation and topological hybridisation techniques. Viswanath et al. [Citation12] introduced a way to create solid- and beam-based lattice materials derived from the mesh points of Schoen’s Gyroid TPMS morphology. The beam-based Gyroids had a lower modulus but higher fatigue resistance compared to the solid-based versions.
The studies mentioned used heuristic methods to improve the mechanical characteristics of lattice materials. These tactics require a diverse array of materials, inquiries, and experiments to arrive at a decision regarding a specific strategy. A modern method explores the connection between topology and mechanical properties by using topology optimisation, which uses the finite element method to optimise material distribution in a design domain based on a specific set of constraints, loads, and boundary conditions.
There is a growing interest in maximising the stiffness-to-weight ratio of lattice materials. Xiao et al. [Citation13] created a group of lattice materials with increased stiffness by applying various compressive loading conditions to a continuum cube under variable volume restrictions. Alawwa et al. [Citation14] proposed a stiffness-based constrained-domain topology optimisation approach that maintains the original lattice material design while enabling the generation of new topologically optimum features under specified loading and boundary constraints. Almesmari et al. [Citation15] recently developed a group of cuboidal spherical plate lattice (CSPL) materials and enhanced their stiffness through the constrained-domain topology optimisation approach. The aforementioned studies considered the stiffness maximisation of lattice materials based on linear material definition and small deformation assumptions. In reality, lattice materials are exposed to intense loading conditions where both geometrical and material nonlinearity are involved. One of the topics that requires the utilisation of a nonlinear topology optimisation algorithm is maximising the internal energy dissipation (IED) of lattice materials. IED represents the dissipation of elastic and plastic strain energies when subject to external loading. In the literature, definitions such as crashworthiness [Citation16], elasto-plastic [Citation17], and energy absorption [Citation18] optimisation are also used interchangeably to describe the IED of structures. The investigation into optimising the IED capability of structures has attracted attention in domains that require designs in which collisions may result in severe consequences, including human injury and vehicle damage [Citation19].
Huang and Xie [Citation19, Citation20] devised a nonlinear topology optimisation approach using the Bidirectional Evolutionary Structural Optimisation (BESO) method to produce designs with enhanced IED while adhering to specified constraints on force and displacement. BESO is an extension of the Evolutionary Structural Optimisation (ESO) method that enables the addition of material to the structure in areas where it is most required while simultaneously removing inefficient material [Citation21]. The BESO approach has been widely employed to enhance the microscopic stiffness [Citation21–23] and nonlinear behaviour [Citation17] of lattice materials. Jia et al. [Citation16] employed a non-gradient topology optimisation method to enhance the crashworthiness of a solid beam under impact loads. The 3D designs that were created had geometrical aberrations, which prevented the fabrication and testing of the proposed designs. Wei et al. [Citation17] employed the nonlinear BESO optimisation method to enhance the IED of 2D continuum design domains under different macroscopic strain loadings, such as bi-axial tensile strain, pure shear strain, and multiple strain scenarios. Nevertheless, the designs were neither fabricated nor validated. Bohara et al. [Citation24] created auxetic structures by maximising the IED of a two-dimensional continuum design domain under compressive force. The optimised designs experienced significant topological aberrations, requiring a thorough reconstruction of the designs.
Existing research lacks in-depth studies on the mechanical characteristics of lattice materials with improved impact energy under various loading conditions. Evaluating the performance of topologically optimised designs at moderate strain rate loading scenarios, such as impact loading, is essential for determining their ability to withstand collisions. This is pivotal for the development of engineered materials with improved crash resistance and designed for additive manufacturing. Hence, this work focuses on the development, manufacturing, and testing of topologically optimised lattice materials with enhanced IED capabilities. This entails addressing the constraints of prior research, such as the challenges related to geometric distortions and the lack of verification of the effectiveness of the optimised lattice materials when subjected to impact loading conditions. The designs are optimised using the nonlinear BESO optimisation approach, considering compressive and shear loading conditions, fabricated using the fused deposition modeling technique and tested for their energy absorption abilities under both quasi-static compression and impact testing. Numerical simulations were conducted to investigate the mechanical response of these newly optimised structures. The numerical results revealed that these new optimised structures outperform their conventional counterparts, i.e. truss-based structures, in terms of perforation limit and impact absorption efficiency.
2. The BESO optimisation method
In order to confirm that the suggested optimisation approach results in designs with improved IED, two types of optimisation jobs are conducted on a continuum cube. The cube is subjected to an identical loading scenario and optimisation settings, with alternative objective functions. The first objective function, referred to as Task A, involves the maximisation of stiffness assuming linear elastic material behaviour. The second task, referred to as Task B, involves the maximisation of IED considering finite deformation elastic-plastic material behaviour with self-contact.
This following will present the mathematical basis for maximising the IED utilising the non-linear BESO optimisation technique. The mathematical derivations are based on the work conducted by Huang and Xie [Citation19, Citation25], who devised a complex solution for a topology optimisation problem that encompasses both material and geometric nonlinearities. Maximising the total external work W is comparable to maximising the total strain energy under quasi-static conditions. Thus, to attain the most efficient energy absorption structure, the total energy absorbed per unit volume (W/V) is optimised. It is feasible to express the optimisation problem that includes a volume constraint in the following manner [Citation19, Citation20]:
(1)
(1)
Here U, F, i, and n indicate the displacement vector, force vector, incremental load vector, and total number of load increments, respectively. The term indicates the desired volume for the obtained design, while
specifies the volume of an individual element. Values of 1.0 and a given small number (e.g.
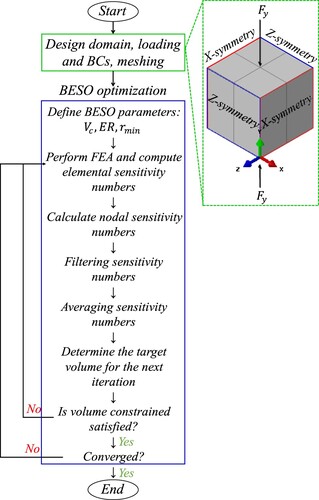
= 0.001) indicate the presence and absence of an element, respectively [Citation19, Citation20]. The BESO optimisation approach was implemented in a Python script [Citation26, Citation27], which interacts with the nonlinear solver in Abaqus using the Abaqus scripting interface (ASI). Initially, the finite element problem is defined in Abaqus/CAE, where the loading and boundary conditions, meshing, and step construction (specifically, the static step) are defined. The flowchart in shows the overall procedure for BESO optimisation using the Abaqus scripting interface.
After creating the Abaqus input file, the Python script is executed, and three optimisation parameters are specified: the target volume constraint (), the filter radius (
), and the evolutionary volume ratio (ER). The parameters for both tasks were defined as follows:
= 0.3,
= 0.72, and ER = 0.02. The constant (
) is a mesh-independent length scale utilised for conducting elemental filtering. It determines the number of nodes that will influence the sensitivity value of an element. Moreover, ER is a constant that is utilised to calculate the removal or addition of elements in each iteration. After the finite element solution is obtained, the sensitivity of elements in relation to the objective function is calculated in each iteration. The sensitivity numbers are filtered and subsequently averaged to mitigate the checkerboard effect.
Figure 1. Flow chart showing the overall procedure of BESO topology optimisation and a snippet of the applied loading and boundary conditions on the continuum design domain.
The sensitivity of the objective function with respect to a change in the design variable () is expressed as follows [Citation19, Citation20]:
(2)
(2) The variation of the external work (ΔW) is calculated by introducing an adjoint equation that incorporates a sequence of vectors of Lagrangian multipliers into the expression of the external work W. Thus, the variation of the external work is expressed as [Citation19, Citation20]:
(3)
(3) where
denotes the variation of internal force vector, which is required to solve for the equilibrium equations of the nonlinear structure iteratively.
The evolutionary structural optimisation method involves the elimination and addition of elements in order to optimise a structure. That is to say, the design variable is regarded as the element itself. Therefore, upon the complete removal of the jth element from the system, the volume variation can be mathematically represented as [Citation19, Citation20]:
(4)
(4) Following this, the variation of the overall strain energy is denoted as [Citation19, Citation20]:
(5)
(5)
where refers to the total strain energy of the jth element. Thus, the variation of the objective function is given as [Citation19, Citation20]:
(6)
(6) The elemental sensitivity number indicates the relative importance of elements according to the objective function’s variation. The definition of the non-dimensional elemental sensitivity number is the variation of the objective function with respect to volumetric variation W/V, which is expressed as [Citation19, Citation20]:
(7)
(7) When a continuous structure is partitioned into segments using low-order finite elements, the sensitivity levels at the interfaces between these components may exhibit discontinuities [Citation28]. This phenomenon leads to the creation of checkerboard patterns in the optimised topologies. To avoid this problem, the nodal strain energies are initially calculated by averaging strain energy values of the elements connected to the node as:
(8)
(8) where
denotes the nodal strain energy of jth node, and
represents the total number of elements connected to the jth node. Subsequently, a filter scheme is utilised to convert the nodal strain energy into element strain energy. For this purpose, the filter radius
is utilised for conducting elemental filtering. As depicted in Figure S1 (see supplementary material), nodes located inside the circular sub-domain
contribute to the computation of the strain energy of jth element as:
(9)
(9) where
is the total number of nodes in the sub-domain
, and
is the linear weight factor defined by:
(10)
(10) where
is defined as the distance between the center of the jth element and the ith node. Subsequently, elemental sensitivity numbers are obtained by substituting Eq. (9) into Eq. (7). Moreover, incorporating historical data into the sensitivity number helps in stabilising the evolutionary process and guarantees the convergence of the target function. The average scheme is given as
(11)
(11) where
is the current iteration number.
Prior to removing or adding elements to the current design, it is necessary to ascertain the target volume for the subsequent iteration. The evolution of the subject is denoted by:
(12)
(12) The sensitivity numbers of solid and void elements are then calculated. The elements are arranged in descending order based on their sensitivity numbers. If the element is solid, the sensitivity number is set to
= 0, and is thus eliminated since
(13)
(13) If an element is void, the sensitivity number is set to
= 1, and is added since
(14)
(14) where
and
are the threshold sensitivity numbers for deleting and adding elements. These thresholds are determined using bisection method that changes the threshold progressively as described by Huang and Xie [Citation29].
Convergence is achieved when the difference in the objective function value between iterations is less than a tolerance of 0.001. At this point, the raw output file is generated in the stl-file format. Subsequently, geometric post-processing operations are carried out to alleviate the rough surface and distortions that arise from the optimisation task. The optimisation tasks utilised the material properties of Aluminum 6061 alloy provided in [Citation30]. For Task A, it is assumed that the material has a linear definition and is subjected to a relatively small force of 1 N. The given values for the Young’s modulus and Poisson’s ratio are = 68 GPa and
= 0.3, respectively. The nonlinear material behaviour in Task B was described using the von Mises yield function with isotropic linear hardening considering finite deformation theory and including self-contact. In this model, besides penalising the Young’s modulus of the base material, the yield strength (
= 276 MPa) and the hardening modulus (
= 562 MPa) of the base material are also penalised through extending the classical Solid Isotropic Material with Penalisation (SIMP) scheme. The following material interpolation schemes have been implemented in many studies that involved topology optimisation for energy absorption with elastoplastic material behaviour [Citation31–34]:
(15)
(15)
(16)
(16)
(17)
(17)
The parameters ,
, and
denote the Young’s modulus, yield strength, and hardening modulus for a jth element in the design domain. The material parameters for a void element are denoted by
,
, and
. To prevent the stiffness matrix from becoming singular, rather small values (e.g. 10−6) are assigned to these parameters. The penalisation parameter, denoted as
in Eqs. (15)–(17), is used to penalise elements that have
densities between the extremes. The penalisation parameter was consistently set to
= 3 in both optimisation Task A and B. A force of 80 N, as shown in (a), was applied to the continuum cube in order to cause large deformations. It was found that a force greater than 80 N caused a convergence problem in the nonlinear solver. It is important to mention that if the applied load does not induce geometric and material nonlinearity, the result of the topology optimisation will remain the same. However, the result will be affected by the applied load when taking into account the nonlinearities in the optimisation procedure. Huang and Xie [Citation29] found that the filter technique proposed for the BESO algorithm functions as a low-pass filter, eliminating structural features below a certain length in an optimal design. Therefore, by employing a constant value for
, an identical topology is achieved regardless of the number of elements used in the mesh. Refining the geometry using a finer mesh in this scenario would solely result in the creation of topologies that possess smooth boundaries. This method was validated for both optimisation tasks, in which the topologies were generated using a varying number of elements, ranging from 25,000 to 175,000. Hence, identical geometries were achieved, albeit with more refined boundaries. It should be highlighted that all of the design domains considered in the present study were discretised using 175,000 elements.
2.1. Compression loading scenario
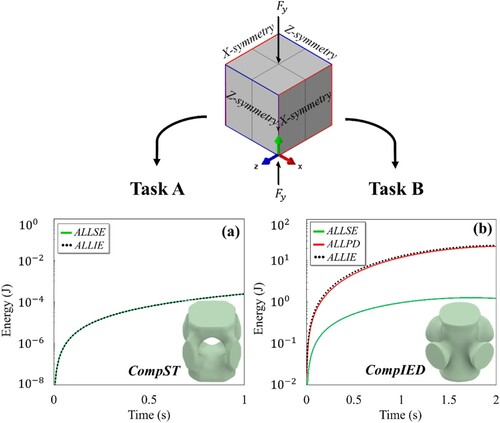
displays the changes over time in elastic strain energy (ALLSE), plastic strain energy (ALLPD), and internal energy (ALLIE), e.g. total strain energy, for the converged configurations of CompST and CompIED structures with a relative density of 0.3. The CompST topology was created using the optimisation Task A, while the CompIED topology was created using the optimisation Task B. The term ‘Comp’ is an abbreviation for ‘compression’ and is associated with the loading condition. The prefixes ST and IED are utilised to distinguish between Task A pertaining to maximising stiffness and Task B related to maximising internal energy dissipation. ALLIE refers to the collective energy, encompassing the cumulative elastic strain energy (ALLSE) and plastic strain energy (ALLPD). In the context of the CompST structure, (a) shows that the value of ALLIE is equivalent to ALLSE because there was no presence of plastic strain energy, which is attributed to the utilisation of an elastic material specification. On the other hand, (b) shows that the contribution of ALLSE to ALLIE in the CompIED topology is considerably less than the contribution of ALLPD. This indicates that the optimisation procedure for CompIED was mainly driven by the inelastic dissipated energy. Moreover, the CompIED structure exhibited a greater ALLIE value compared to the CompST structure. The preliminary finding indicates that the inclusion of material and geometric nonlinearities improves the total dissipation of internal energy in the optimised topology.
Figure 2. Displaying the evolution in elastic strain energy (ALLSE), plastic strain energy (ALLPD), and the total internal energy (ALLIE) for the converged configurations of (a) CompST and (b) CompIED structures with a relative density of 0.3.
Both of the topologies were arranged in a 4 × 4 × 4 array and subjected to quasi-static loading conditions in Abaqus/Explicit in order to analyze their energy absorption capabilities. In order to reduce the computational cost, one-eighth of the tessellated array was simulated. This was achieved by implementing the symmetric boundary conditions illustrated in (a). Both structures are subjected to a compressive strain of 0.6, using a smooth step amplitude to ensure quasi-static conditions. The models were meshed using the C3D10M element type, resulting in the generation of 300,000 elements. The contact interactions of the structure are defined by a general contact interaction with a friction coefficient of 0.3. The elasto-plastic quasi-static compression simulations were validated with experimental testing in a previous work conducted by the authors [Citation15], and details are provided in the supplementary material, Section S2.
Figure 3. Presenting findings from quasi-static compression simulations for CompST and CompIED lattice materials, including (a) numerical model setup for the CompST lattice material (b) stress-strain diagrams, and (c) equivalent plastic strain (PEEQ) contours for both lattice materials.
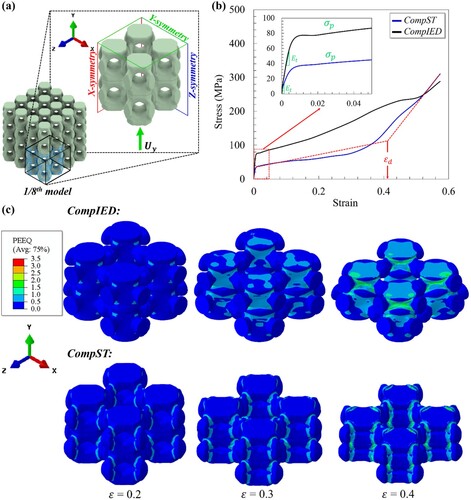
The properties of the material used to define the BESO optimisation task, specifically the Aluminum bilinear material model, were also utilised for the quasi-static compression simulations. As shown in (b), the optimisation results indicate that the CompIED structure has superior stress–strain behaviour as compared to the CompST structure. The energy absorption (EA) of both lattice materials is calculated by integrating the stress–strain diagram up to the point of densification strain ():
(18)
(18) The densification strain
signifies the point at which cell wall interactions begin to enhance the compressive resistance of a lattice structure [Citation35]. The densification strain is calculated by identifying the intersection point between the plateau stress line (
) and the tangent line (
) on the stress–strain curve of the lattice material, based on the tangent method [Citation35, Citation36] as illustrated in (b).
The CompIED and CompST lattice materials exhibited energy absorption capacities of 96.1 and 65.2 MJ/m3, respectively. This result demonstrates the effectiveness of the optimisation process in producing structures that have enhanced energy absorption capabilities. The CompIED structure, although intended for energy absorption optimisation, demonstrated a greater compressive modulus than the CompST structure, with respective values of 11.3 and 5.5 GPa. This is attributed to the higher ALLIE values of the CompIED topology in comparison to the CompST topology, which also showed very low ALLSE values, as shown in (a). This is consistent with the findings of Buhl et al. [Citation37] and Huang and Xie [Citation25], who found that incorporating geometric and material nonlinearities in the topology optimisation process results in a structure that is stiffer compared to a structure optimised using only linear topology optimisation. (c) displays the equivalent plastic strain (PEEQ) contours of the lattice materials at various levels of compressive strain. The CompIED lattice material mostly supported the applied load along the vertical trunk on the y-axis, enhancing the topology’s resistance to the load, while the CompST structure lacks adequate material support on the vertical y-axis, resulting in a weakness in withstanding the imposed load.
2.2. Shear loading scenario
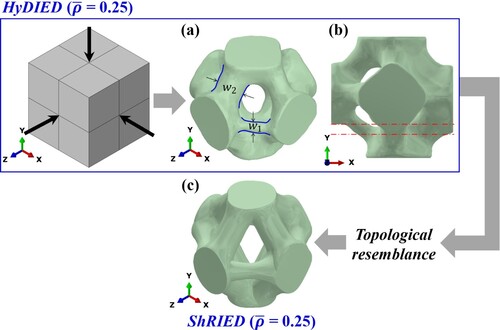
Almesmari et al. [Citation15] and Ejeh et al. [Citation10, Citation11] proposed the utilisation of a topological hybridisation method to improve the mechanical characteristics of lattice materials. In addition to the CompIED architecture, which was optimised for uniaxial compressive loading, a second topology called ShRIED was developed to maximise IED performance under double shear loading conditions. The term ‘ShR’ is an abbreviation for ‘shear’ and is associated with the loading condition and the prefix IED refers to internal energy dissipation. The goal is to merge the design of these two topologies in order to create a hybrid offspring that exhibits improved performance in terms of IED when subjected to both compressive and shear loading situations. For example, impact loading is a complex scenario that encompasses various deformation modes driven by the combined load cases of shearing and compression.
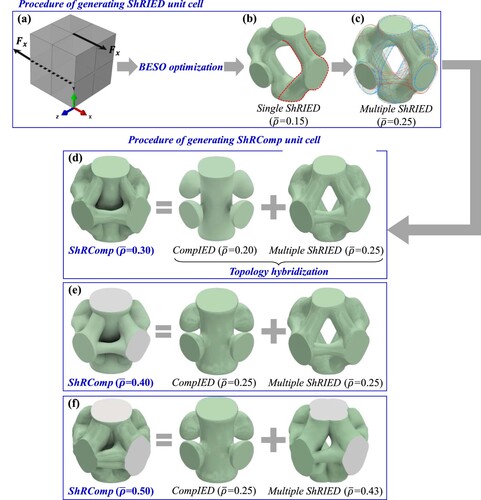
depicts the procedure of constructing a single unit cell of the ShRIED topology and subsequently merging it with a CompIED unit cell to generate the hybrid ShRComp architecture. In this scenario, a continuum cube was subjected to two shear forces applied to the positive and negative y-faces of the cube. The parameters for the optimisation task were defined as follows: = 0.15,
= 0.72, and ER = 0.02. The degrees-of-freedom of the central nodes located at the positive and negative x- and z-faces have been constrained to prevent rigid body motion (refer to (a)). (b) depicts the result of the topology optimisation process, showing a geometry with diagonal and thick ligaments (highlighted as red dots) that are aligned with the applied forces. These diagonal elements will improve the overall strength of the structure and assist in withstanding shear stresses. The single ShRIED topology was employed to superimpose two additional ShRIED unit cells, resulting in a cubic design that features connected overhang ligaments, as shown in red and blue colours in (c). The final form of the ShRIED unit cell is composed of three unit cells: two unit cells positioned opposite each other along the global x-axis and one unit cell oriented along the z-axis. The ShRIED and the CompIED unit cells were combined at a relative density of 0.25 and 0.20, respectively, to form the ShRComp unit cell with a relative density of 0.30, as shown in (d). Various combinations of CompIED and ShRIED unit cells were hybridised to create ShRComp topologies with relative densities ranging from 0.3 to 0.5. The design domains were discretised using 175,000 elements with
= 0.72 and ER = 0.02. The specific combinations of these relative densities and the considered topologies are depicted in (e) and (f). The ShRComp topologies are created by combining the ShRIED and CompIED topologies, rather than using the BESO algorithm directly to solve the combined loading scenario. This approach was implemented to ensure the generation of topologies in a cubic manner, which is essential for the tessellation of a periodic structure. The process of topology hybridisation was carried out in Autodesk Inventor 2023 software.
Figure 4. A schematic illustrates the process of creating the ShRComp unit cells for a range of relative densities. This includes generating a unit cell for ShRIED, which involves (a) applying double shear loading to a continuum cube, (b) creating a single ShRIED unit cell, (c) developing multiple ShRIED designs with cubic design, and (d) the process for producing the ShRComp unit cell with = 0.3. The analogous procedure is applied to produce the ShRComp unit cells with relative densities of (e) 0.4 and (f) 0.5 based on the specified ShRIED and CompIED combinations.
2.3. Hydrostatic loading scenario
In addition to the scenarios of uniaxial compression and shear loading, the hydrostatic compressive loading scenario was also taken into account in order to enhance the lattice structure’s resistance to pressure loading. (a) depicts the HyDIED unit cell, which illustrates the result of maximising the energy absorption of a solid cube under compressive hydrostatic loading. The term ‘HyD’ is an abbreviation for ‘hydrostatic’ and is associated with the loading condition, and the prefix IED refers to internal energy dissipation. The optimisation parameters employed were analogous to those utilised in the generation of the CompIED and ShRIED unit cells, with a volume constraint of 0.25. With the objective of preventing rigid body motion, the central nodes located at the negative x-, y-, and z-faces were fully constrained. The figure demonstrates that the HyDIED unit cell has topological similarity to the ShRIED unit cell when considering the same relative density. (a) illustrates the distinctly organic shape of the HyDIED topology, characterised by a significant disparity in the proportions of ligament widths. (b) depicts the uneven distribution of materials (referred to as the design domain) within the HyDIED unit cell in the xy-plane, which is bordered by two dashed red lines. These geometric asymmetries can be reduced by using symmetric boundary conditions to provide a uniform material distribution. This is demonstrated in the ShRIED unit cell seen in (c). The analysis demonstrated that hydrostatic and shear loading conditions produced nearly identical topologically optimal structures in terms of maximising energy absorption. Therefore, the HyDIED design was excluded from the ShRComp topology, and only the ShRIED design was taken into account, together with the CompIED topology.
Figure 5. Demonstrating the topological resemblance between the HyDIED and ShRIED unit cells, showing: (a) isometric view and (b) side view for the HyDIED unit cell, and (c) isometric view for the ShRIED unit cell.
It should be highlighted that the ShRIED topology exhibits a topological similarity to the topology optimised (TO) lattice structure studied by Alkhatib et al. [Citation38, Citation39]. In addition to demonstrating isotropic energy absorption capacity under quasi-static loading conditions [Citation38], the TO lattice structure has also been reported to display isotropic energy absorption capacity when subjected to high strain rates using the Split Hopkinson Pressure Bar [Citation39]. As a new insight, the present work aims to investigate the impact absorption efficiency, impact resistance, and perforation limit of a new set of topology optimised lattice structures at different impact velocities. These structures include an elementary design (i.e. CompIED) and hybrid designs (ShRComp), which incorporate the design of ShRIED.
3. Micromechanical finite element analysis
The present study adopts the micromechanical finite element homogenisation approach based on a representative volume element (RVE) to compute the effective elastic properties of the CompIED and ShRComp topologies. The elastic properties include the uniaxial , bulk
, and shear
moduli. Using the micromechanics plugin for Abaqus/CAE developed by Dassault Systems, periodic boundary conditions (PBCs) were imposed on the RVEs to capture their effective bulk response and ensure displacement compatibility and traction continuity across the boundaries of the adjacent unit cells [Citation40–43]. A comprehensive outline of the PBCs used in the study is provided in Section S3 of the supplementary material. The micromechanical finite element homogenisation scheme utilises the volume averaging approach to calculate the average values of the components of the stress tensor
, such that [Citation44]:
(19)
(19) The components of the Cauchy stress tensor are denoted by
. The volume of a unit cell is represented by
, and the spatial coordinates are represented by
and
. For a periodic microstructure, the average stresses can be determined by applying the principle of continuity of tractions. This involves relating the average stresses to the ratios of the resultant traction forces on the boundary surfaces to the corresponding areas of the boundary surfaces [Citation44]:
(20)
(20) where
represents the resultant reaction force in the direction of applied displacement, whereas
represents the cross-sectional area of the boundary surface.
Small deformation and linear elastic isotropic material behaviour were assumed for the base material, with Young’s modulus of = 1 GPa and Poisson’s ratio of
= 0.35. The analysis was performed with an assumption of linear elastic orthotropic behaviour, which requires nine independent material constants to describe the stiffness matrix of the lattice materials by using the following constitutive relation:
(21)
(21) The stiffness tensor, written in the Voigt form as
, is computed using the nine independent effective elastic constants:
,
,
,
,
,
,
,
,
.
illustrates the performance comparison between the CompIED and ShRComp unit cells with currently available designs such as TPMS [Citation45], truss [Citation46], and plate-based structures [Citation15]. The homogenisation process yields effective properties that lie between lower and upper bounds derived by variational methods, such as the Hashin-Shtrikman upper (HSU) bound [Citation47]. In lattice materials, these bounds are determined by assigning zero stiffness to one of the phases in a two-phase system. The bounds on the bulk, shear, and Young’s moduli are expressed as the following [Citation48]:
(22)
(22)
(23)
(23)
(24)
(24)
Figure 6. Demonstrating the effective elastic properties of the CompIED and ShRComp RVEs in comparison to TPMS, truss-, and plate-based structures, showing: (a) uniaxial modulus, (b) shear modulus, and (c) bulk modulus, and (c) Poisson’s ratio.
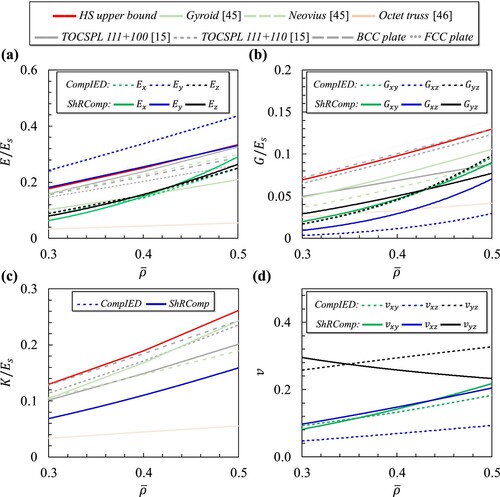
In the above equations, denotes the relative density of a lattice material, and the subscript (HSU) and (s) denote Hashin-Shtrikman upper bound and solid base material properties, respectively. The HSU bound is also included in as a performance benchmark.
Figure S5 displays the deformed shapes and von Mises stress distributions of the analyzed configurations subjected to the specified loading conditions for unit cells with a relative density of 0.4. As shown in (a), the CompIED topology had a very stiff response when loaded along the y-axis, going beyond the HSU bound by at least 30% within the given range of relative density. The uniaxial modulus along the y-axis exceeds the octet truss and FCC plate designs by 152% and 30%, respectively. This is mostly due to the thick ligament of the CompIED design in the y-axis direction. The ligaments along the x- and z-axes are relatively thin, leading to lower stiffness in these directions compared to most topologies, with the exception of the octet truss design. When loaded along the y-axis, the ShRComp structure reached the HS upper bound within the specified range of relative density. The thin ligaments in the x- and z-axes resulted in reduced stiffness in those orientations. The performance of the CompIED and ShRComp topologies along the y-axis was also compared to a specific collection of auxetic metamaterials, which included versions of hexagonal, triangular, and their variations [Citation49, Citation50]. When subjected to tension, these auxetic metamaterials experience an increase in thickness that is perpendicular to the direction of the applied force. Figure S4 (see supplementary material) demonstrates that none of these auxetic structures achieve the theoretical elastic limit on Young’s modulus. This observation confirms that the CompIED and ShRComp topologies are dominant in terms of stiffness along the y-axis. Figure S5 (a) shows that the predominant material resistance is concentrated in the vertical trunk along the y-axis in both topologies, with the ligaments in the x- and z-directions being thinner and offering less resistance.
(b) demonstrates that both structures exhibit shear moduli that lie within the range of values observed for octet truss and Gyroid TPMS topologies in the xy-, xz-, and yz-planes. The structures were also exposed to hydrostatic loading, resulting in equal tensile strains in perpendicular directions. This underscores the even distribution of stress in both structures, as depicted in Figure S5 (c). (c) illustrates that both the CompIED and ShRComp structures possess bulk moduli values that are greater than the octet truss topology but lower than the other topologies.
(d) presents the Poisson’s ratios in the xy-, xz-, and yz-planes as they vary with relative density. The ratios are computed using the expressions: ,
, and
, where ϵ represents the strain of the lattice material in a particular direction. The Poisson’s ratios of the CompIED topology exhibit a gradual increase as the relative density increases. The values exhibit a relatively small magnitude and are in close proximity to zero when the relative densities are lower. This is anticipated since deforming the CompIED topology in the xz-plane results in a negligible amount of deformation, focusing mostly on the elongations of the thin ligaments along the x- and y-axes. The Poisson’s ratio in the yz-plane exhibited values that were considerably greater than zero as a result of the elongation of CompIED topology along the y-axis, which greatly contributes to the elastic deformation of the structure. Furthermore, the Poisson’s ratio of the ShRComp topology in the xz-plane exhibited greater values compared to the CompIED topology. The incorporation of shearing components has predominantly contributed to the increasing deformation of the structure in this plane.
Hill [Citation51], Voigt [Citation52], and Reuss [Citation53] devised averaging schemes that offer a universal description of the effective mechanical response for polycrystalline materials composed of granules with random orientations. The Voigt averaging approach relies on the stiffness matrix, and the bulk modulus and shear modulus are given by [Citation52]:
(25)
(25)
(26)
(26) where
and
represent the bulk and shear moduli obtained from the Voigt averaging method. While the bulk (
) and shear (
) moduli obtained from the Reuss averaging scheme are given by [Citation53]:
(27)
(27)
(28)
(28) where
represents the compliance tensor written in the Voigt representation. Moreover, based on the Hill average scheme, the following parameters representing the macroscopic elastic properties of a polycrystalline material are obtained as [Citation51]:
(29)
(29)
(30)
(30)
(31)
(31)
(32)
(32)
The distributions of elastic anisotropy for CompIED and ShRComp topologies were computed at a relative density of 0.4 using the Hill average method. These distributions are displayed in . The computations were executed utilising the VELAS open-source toolkit developed in GNU Octave [Citation54]. Both topologies demonstrate the greatest stiffness in the y-direction and the least resistance to deformation in the x- and z-directions under uniaxial loading, as depicted in (a). (b) demonstrates that the highest shear resistance is observed along the yz-plane for both topologies. According to (b), the shear moduli were highest in the yz-plane for both topologies. (c) indicates that the highest resistance to hydrostatic stress for both designs is located along the y-axis. This outcome is expected since the prevalent distribution of the material along the main skeleton of the topologies is along the y-axis.
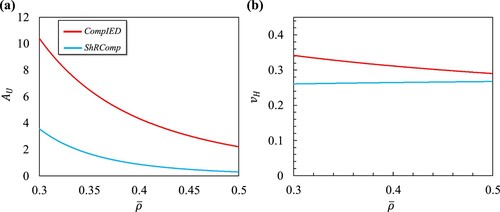
The elastic anisotropy index quantifies the directional dependence of a lattice material’s elastic characteristics. Ranganathan and Starzewski [Citation55] developed a universal elastic anisotropy index () to describe the anisotropy of crystal systems by incorporating all stiffness coefficients, including both shear and bulk components. For periodic crystals that are spatially isotropic, the
value is zero. The extent to which the
deviates from zero indicates the degree of anisotropy in a single crystal. Ranganathan’s universal anisotropy index is expressed as follows [Citation55]:
(33)
(33) (a) demonstrates that the elastic anisotropy of both topologies is greatly affected by relative density, exhibiting a sharp decline in the universal anisotropy index with increasing relative density. Both topologies have isotropic characteristics at higher relative densities, with the ShRComp topology showing near-isotropic behaviour at a relative density of 0.5. This encourages the use of ShRComp topology at higher relative densities as optically isotropic material, where the index of refraction remains constant in all directions [Citation56]. (b) demonstrates that the
of the ShRComp topology remains relatively constant (e.g.
0.26) despite an increase in relative density within the specified range. The same graph also shows that the CompIED topology demonstrates a decreasing trend in
as relative density rises up to 0.5.
Figure 7. Representations of elastic anisotropy distributions for CompIED and ShRComp topologies at a relative density of 0.4, showing: (a) uniaxial modulus, (b) shear modulus, and (b) bulk modulus
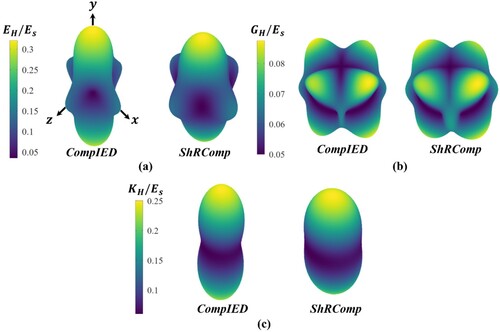
Figure 8. Calculations of the (a) universal anisotropy index and (b) Poisson’s ratio using the Hill’s averaging approach for CompIED and ShRComp topologies.
4. Additive manufacturing
The mechanical behaviour of the proposed topologies in a tessellated pattern was analyzed using three different relative densities: = 0.3, 0.4, and 0.5. The lattice structures were produced by the Fused Deposition Modeling (FDM) additive manufacturing technique on a Sindoh 3D WOX1 printer using Acrylonitrile Butadiene Styrene (ABS) filament. This technology utilises a heated extrusion nozzle to liquefy the material and place it layer by layer along a predetermined route.
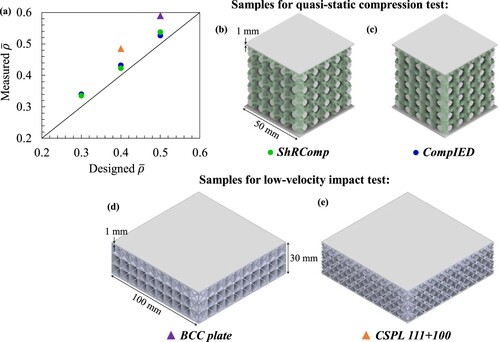
Here we examine the response of the structures to quasi-static and dynamic loads by analyzing two forms of tessellations: cubic tessellation and sandwich structure configuration. The CompIED and ShRComp lattice materials were arranged in a 55
5 cubic pattern with a unit cell size of 10 mm for quasi-static compression testing (refer to (b) and (c)). Two types of lattice materials, namely, the BCC plate lattice and the CSPL 111 + 100 [Citation15], were examined for conducting low-velocity impact tests (refer to (d) and (e)). The BCC plate lattice sandwich structure was tested to calibrate a numerical model for simulating the impact response of lattice materials. The specifics of the calibration will be discussed in the next sections. The core consisted of lattice materials surrounded by two thin face sheets, each with 1 mm thickness. The samples were 100
100
30 mm in size, with each unit cell measuring 10 mm. The BCC plate sandwich structure has a relative density of 0.5. Polymeric foam cores are typically inserted between glass fiber epoxy face sheets to enhance pressure absorption prior to reaching or damaging the core. This setup may lead to specific failure modes, such as face delamination and face/core interface failure [Citation57]. The current work does not address these potential failures; thus, both the core and face sheets were 3D printed together as a single part using the same base material.
Figure 9. (a) A comparison of the relative densities of additively manufactured samples based on designed and actual measurements. CAD models displaying samples for quasi-static compression tests, including (b) ShRComp and (c) CompIED structures. CAD models of samples for low-velocity impact testing, including (d) BCC plate and (e) CSPL 111 + 100.
The numerical model was validated by testing the CSPL 111 + 100 lattice material [Citation15], arranged in a sandwich structure configuration resembling that of the BCC plate lattice, with a relative density of 0.4. The objective of this type of impact testing is to establish a calibrated and verified computational model that precisely predicts the impact characteristics of various sandwich structures. The developed model will be utilised to quantitatively analyze the mechanical characteristics of the CompIED and ShRComp sandwich structures.
Due to the significant reliance of FDM-printed parts’ surface roughness and mechanical strength on process parameters, multiple print jobs were executed to optimise print quality, material usage, and print duration. A summary of these process parameters is provided in . These process parameters were optimised in prior studies [Citation15, Citation58].
Table 1. A summary of the process parameters utilised in the FDM printer (Sindoh 3D WOX1).
The samples were weighed post-printing, and their measured relative densities were determined and compared with the designed values, as illustrated in (a). Each sample was printed twice, so the measured relative density is the average of the two samples. The measured relative density of the additively manufactured samples exceeds the designed relative density. The phenomenon may be due to an inadequate choice for material flow rate, which determines the amount of filament deposited during printing. The material flow rate was set at 110%, perhaps leading to an overestimation of the mass of the printed samples.
5. Experiments
5.1. Quasi-static compression testing
The quasi-static compression tests aimed to study the uniaxial modulus and energy absorption of CompIED and ShRComp lattice materials under a quasi-static strain rate of 0.001 1/s. (a) illustrates stress–strain curves of the CompIED lattice material for relative densities of 0.3, 0.4, and 0.5, displaying a stretch-dominated deformation behaviour with a sharp decrease in strength after yielding. The ShRComp lattice material showed comparable brittle behaviour with a longer plateau stress, as shown in (b). The stress–strain curves indicate that adding additional ShRIED components to the CompIED design activated the bending deformation mode, leading to a longer plateau zone compared to a deformation mode dominated by stretching. The deformation patterns for both lattice materials at different strain levels are demonstrated in the supplementary material (refer to Figure S6).
Figure 10. Presenting findings from quasi-static compression experiments, including stress-strain curves for (a) CompIED, and (b) ShRComp lattice materials.
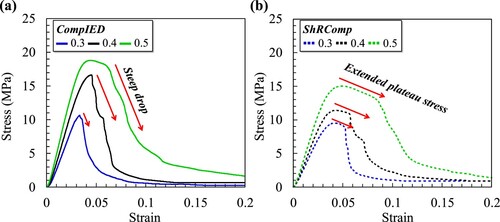
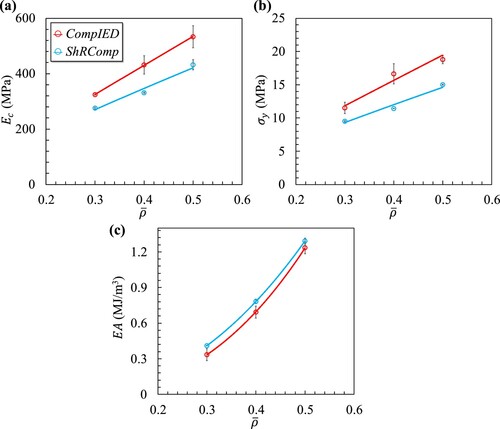
depicts the performance of CompIED and ShRComp lattice materials based on their uniaxial modulus, uniaxial yield strength, and energy absorption (EA) capabilities derived from the quasi-static compression tests. The CompIED lattice material displayed a higher uniaxial modulus and yield strength compared to the ShRComp lattice material for the same relative densities. The ShRComp lattice structure, however, excels in energy absorption, as seen in (c). This is primarily due to the prolonged plateau stress area, which enhanced the energy absorption capacity. The (EA) was estimated for all samples until reaching the fracture strain (i.e. = 0.2). The majority of the energy absorption takes place before reaching a strain of 0.1. After reaching this point, the structures no longer have the ability to carry loads effectively and are able to absorb an additional 5% of the load between strains of 0.1 and 0.2.
Figure 11. Mechanical properties of CompIED and ShRComp lattice materials obtained from quasi-static compression testing, showing: (a) uniaxial modulus, (b) uniaxial yield strength, and (c) energy absorption.
5.2. Low-velocity impact testing
The low-velocity impact tests were performed using the INSTRON CEAST 9350 drop-weight impact tower. The system is equipped with a 30 kN dynamic load cell and an optical laser system for measuring the velocity of the indenter. The system is also equipped with the CEAST DAS 64k data acquisition system, which provides the following outputs: impact force, indenter displacement, indenter velocity, and impact energy in time domain series, all at a sampling rate of 3 MSPS (million samples per second). shows the experimental setup and depicts the custom-made fixture used during the impact test. The fixture plate is composed of a 60-mm cutout, which allows the indenter to impact the sandwich structure. In order to prevent any rotational movements, the fixture is clamped on the plate stand mount using lateral clamps.
Figure 12. Illustrations of the INSTRON CEAST 9350 impact tower, and schematics showing the details of clamping a BCC plate lattice sandwich structure into the test fixture. All dimensions in mm.
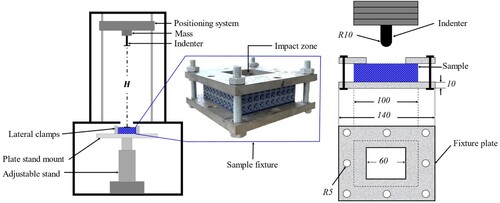
Several samples of BCC plate sandwich structures were tested at different impact energies with the objective of calibrating a numerical model capable of accurately simulating the dynamic response of sandwich structures made of ABS thermoplastic. In the following experiments, the impact mass was fixed at 10.448 kg, while different combinations of initial impact height () and velocity (
) were used to obtain impact energies of 30, 50, and 70 J. These parameters are summarised in .
Table 2. Initial impact height, velocity, and impact energy data for evaluating the BCC plate sandwich structure.
(a) shows the absorbed impact energy () by the BCC plate sandwich structures at different initial impacts of 30, 50, and 70 J. The x-axis of the graph represents the impact duration (T) in milliseconds (ms). In this context, the absorbed impact energy [Citation59] is defined as the difference in kinetic energy between the initial (
) and residual velocity (
) and given by:
(34)
(34) where (m) represents the mass of the indenter and (
) represents the final velocity of the impactor as it starts to penetrate an object.
Figure 13. Presenting the results for the BCC plate sandwich structure, including (a) absorbed energy, (b) impact force, and (c) indenter velocity plots.
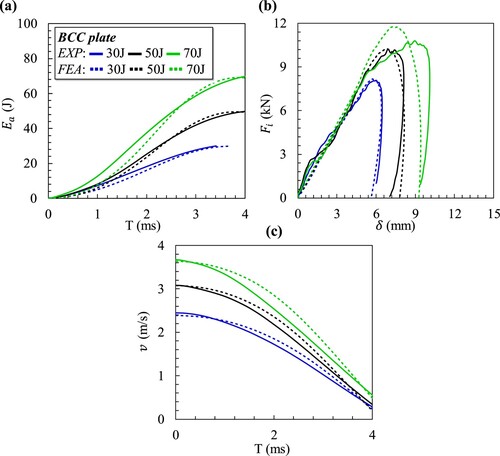
The sandwich structures in this impact energy range remained intact and absorbed all the applied impact energy without being fully perforated. The anti-rebound system was utilised in all trials to prevent multiple impacts on the sample. Therefore, the absorbed energy graphs do not display elastic (rebound) energy. The residual velocity is a crucial parameter that describes the perforation resistance of sandwich structures. (c) illustrates the correlation between the indenter velocity () and the indenter displacement (
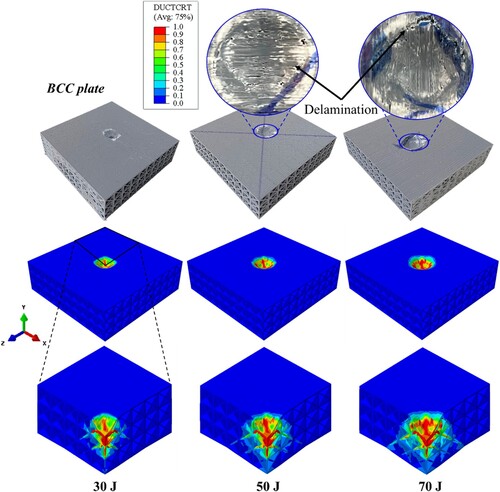
). For the considered range of impact energies, the indenter’s residual velocity is zero, suggesting that no perforation took place, as shown in . Moreover, delamination occurred in the upper facesheets at 50 J and 70 J, which is expected when polymeric additively manufactured specimens are subjected to impact loads.
Figure 14. Demonstrating pictures of the BCC plate sandwich structures impacted at different energies, along with the FEA predictions showing the damage initiation criterion contours (DUCTCRT).
6. Calibration and verification of the computational model
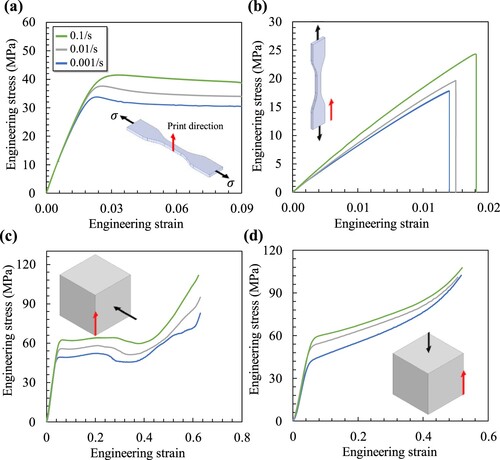
6.1. Mechanical characterisation of the base material
The mechanical response of the base material was investigated under uniaxial tension and compression loading at variant strain rates of 0.001, 0.01, and 0.1. The uniaxial tension tests were conducted according to the ASTM D638 standard using type IV tensile samples. While the uniaxial compression tests were performed using dense cubic samples with a dimension of 20 × 20 × 20 mm3. Furthermore, two types of loading directions were considered in order to explore the influence of the additive manufacturing anisotropy on the performance of the base material, namely, loading the samples parallel and transverse to the print direction. (a)–(d) shows the stress–strain curves of the tensile and compression samples tested at different strain rates and loading directions. (a) shows that testing the tensile sample transverse to the print direction resulted in strain-softening behaviour. The linear behaviour of the base material in this case is independent of the strain rate, where the uniaxial modulus is almost the same at different strain rates (i.e. 2000–2055 MPa). However, a clear viscoplastic behaviour is noticed beyond the yield point, as the magnitude of the uniaxial yield strength increased with increasing strain rate. The same trend is also noticed for the compression samples, where the plastic region of the stress–strain curves exhibits strain hardening and viscoplastic behaviour. Except for (b), which shows a brittle behaviour of the base material when the tensile load is applied parallel to the print direction.
Figure 15. Demonstrating results of the uniaxial compression and tension testing under variant strain rates, showing the stress-strain curves for: (a) transverse tension, (b) parallel tensions, (c) transverse compression, (d) parallel compression.
6.2. Calibration of computational model
The Drucker-Prager material model was employed to simulate the behaviour of the base material. This model is suitable for representing materials that exhibit pressure-dependent yield and is frequently used for modeling polymeric materials with higher compressive yield strength than tensile yield strength. The linear Drucker-Prager yield criterion [Citation60] was used to describe the plastic flow of the base material and is given by:
(35)
(35) where (
) is the von Mises equivalent stress, (
) is the hydrostatic stress, (
) is the friction angle of the material, which represents the slope of the linear yield surface in the
stress plane, and (
) is the cohesion of the material. Furthermore, in order to ensure that the flow direction is uniquely defined, the flow potential (
) chosen [Citation60] in the model is defined as:
(36)
(36) where (
) corresponds to the dilation angle in the
stress plane.
The yield stress ratio approach was utilised to define the rate-dependent yield strength of the base material as follows:
(37)
(37) where (
) corresponds to the materials yield stress,
is the static stress–strain behaviour, and
is the ratio of the yield stress at nonzero strain rate to the static yield stress (e.g.
= 1.0). One of the methods to define (
) is through specifying the Cowper–Symonds overstress law [Citation61], given as:
(38)
(38) where (
) and (
) are material parameters, i.e. multiplier and exponent, respectively, that are defined in Abaqus along with the Drucker-Prager material model parameters. Furthermore, the model incorporates the strain hardening suboption to precisely represent the strain hardening phenomenon observed in the compression behaviour of the base material. The Drucker-Prager strain hardening effect was defined using the compressive true stress versus plastic strain response obtained from testing the base material at a strain rate of 0.001.
The material’s damage state was simulated using the ductile damage model, which incorporates criteria for damage initiation and a law for damage evolution. This type of damage model has been widely utilised to model the damage in metals [Citation62–64] and polymeric lattice materials [Citation9, Citation65]. Multiple simulations were performed in order to calibrate the Drucker-Prager material model and the ductile damage model parameters to fit the load-displacement curves of the BCC plate sandwich structure demonstrated in (b). The parameters summarised in provided the best fit to the curves. Section S5 in the supplementary material provides details regarding the calculation of the parameters associated with the ductile damage model.
Table 3. Parameters used for defining the Drucker-Prager material model and the ductile damage law.
The calibration of the material model was carried out using the material’s response to transverse loading, as shown in (a) and (c) for tension and compression, respectively. The calibration process did not include the material behaviour under parallel loading since the material exhibited a brittle response when subjected to tensile loading, as seen in (b). This behaviour does not accurately depict the plastic deformation and strain softening of the base material under different strain rates, as an abrupt failure occurs at extremely small strain values. To ensure compatibility with the calibrated material model, all of the lattice materials examined in this study were loaded in a direction perpendicular to the print direction. The damage model parameters in are obtained using the compression true stress–strain curve obtained by testing a tensile sample at a strain rate of 0.001/s, as shown in Figure S7 (a) in the supplementary material.
The low-velocity impact simulations were conducted using the Abaqus/Explicit solver, employing a time step of 0.01 s. Utilising symmetry, only one-fourth of the full impact setup was considered in the simulations. To minimise the computational cost, the semi-automatic mass scaling feature was enabled with a goal time increment of 110−8 sec. The selection of this value consistently produced reliable outcomes with a negligible percentage variation in the elemental mass (i.e. less than 0.09%) and is based on numerous trials. As depicted in (a), a hemispherical, and discrete rigid indenter was modeled with a length of 40 mm and a radius of 10 mm. Due to the intricate interactions between the indenter and the sandwich structure, as well as between the different members of the sandwich structure, a general contact interaction was employed with a normal and tangential contact behaviour with a friction coefficient of 0.4. The quarter model was meshed using a C3D10M element consisting of 600,000 elements, ensuring at least two elements were present across the plate thickness. The indenter was meshed using a 3-node 3D rigid triangular facet element (R3D3), with a total of 206 elements. It was found that additional mesh refinement of the model will greatly increase the computational time without any noticeable change in the accuracy of the output response.
Figure 16. Demonstrating the numerical model setup and outputs obtained from simulating the BCC plate sandwich structure with an impact energy of 70 J, showing: (a) the computational model loading and boundary conditions, (b) the equivalent plastic strain contours (PEEQ), (c) the damage evolution parameter, and (d) the Mises stress contours.
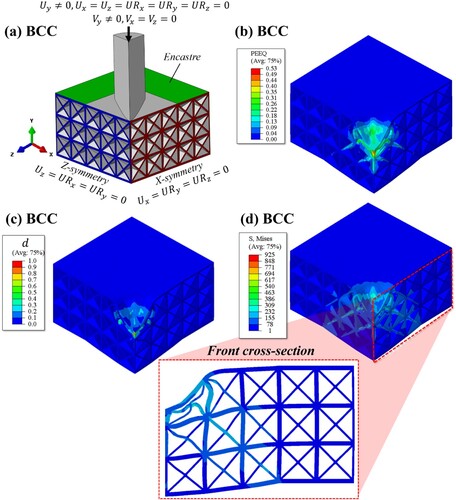
(a) shows the details of the numerical model and the applied loading and boundary conditions. Symmetric boundary conditions are applied to the positive z (highlighted in blue) and positive x (highlighted in red) faces of the sandwich structure. In order to impose the clamping effect of the fixture as demonstrated in , the surface highlighted in green located on the positive y-face and its opposite negative y-face were encastered (e.g. all DOFs were constrained). The impact mass and initial velocity were assigned to a reference point located on the hemispherical indenter. Except for the translation on the y-axis, all DOFs of the reference point were constrained in order to prevent rigid body motion of the indenter. It should be noted that the mass and initial velocities of the impactor were assigned based on the values reported in the experimental section.
In order to obtain the indenter force-displacement response, the nodal reaction force of the reference point and the displacement of the indenter’s reference point in the y-axis were extracted and compared with the experimental data as shown in (a)–(c) for the cases with impact energies of 30, 50, and 70 J. The results illustrate the proficiency of the numerical model in accurately predicting the absorbed energy, impact force, and indenters’ velocity observed at various impact energies, displaying a high level of concordance with experimental findings. Beyond the peak force, the applied impact energy is successfully absorbed by the sandwich structure, thus stopping the indenter from further penetration, subsequently, a sharp drop in the curve is observed.
displays the computational model’s estimates of the damage initiation criterion contours (known as DUCTCRT) for the BCC plate sandwich structure at various impact energies. Damage initiation at the material point is accomplished when DUCTCRT reaches a value of 1.0. The contours represent the presence of localised damage in the vicinity of the impact area. Observing the quarter sections of the sandwich structures reveals that a greater number of elements satisfied the damage initiation condition as the impact energy escalated from 30 to 70 J.
The results obtained by simulating the BCC plate sandwich structure with an impact energy of 70 J are shown in (b)–(d). The plastic strain contours (PEEQ) depicted in (b) illustrate that a certain set of elements has reached the failure strain, defined by the damage model (i.e. 0.1). (c) displays the evolution of the damage parameter (), which characterises the damage of the elements once they have met the damage initiation threshold. The contours indicate the occurrence of a localised damage near the impact zone. Only a small portion of the damaged elements exhibited a total loss of stiffness (i.e. d = 1), whereas the majority of the damaged region experienced a degradation of stiffness ranging from 40% to 50% (i.e. d = 0.4 and 0.5). Furthermore, the stress contours depicted in (d) show that the impact event caused a localised deformation of the unit cells around the impact zone which resulted in the buckling of the constituent plates, as highlighted in the cross-sectional view in the y-z plane.
The verification of the computational model, which involves predicting the experimental impact force-penetration curve of the CSPL 111 + 100 sandwich structure, is outlined in the supplementary material in section S6.
7. Impact response of the CompIED and ShRComp structures
The effectiveness of a sandwich structure as a protective system is often assessed using three key parameters: the transmitted peak force (), the impact absorption efficiency (
), and its perforation limit. The impact absorption efficiency is a measure of how effectively a sandwich structure absorbs impact energy during perforation. It is calculated by comparing the initial impact energy (
) to the absorbed impact energy (
).
Furthermore, the perforation limit is the factor that determines the level of resistance to perforation in a sandwich structure. Structures that have a higher perforation limit can absorb a larger amount of impact energy before reaching the point of perforation. As highlighted by Sarvestani et al. [Citation66], it is important for an impact absorption system to absorb as much energy as possible at a minimal peak force transmitted to an object.
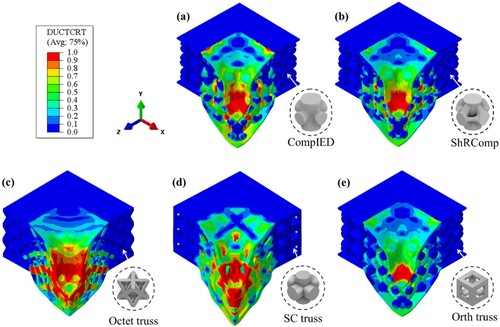
The impact response of the CompIED and ShRComp sandwich structures was numerically investigated at various impact velocities. The acquired peak force, impact absorption efficiency, and perforation limit were compared to several commonly used strut-based lattice structures, such as the octet truss, the simple cubic (SC) truss, and the orthogonal (ortho) truss, in order to establish a performance benchmark. A relative density of 0.4 was considered for the core of all these sandwich structures. Simulation results from testing the sandwich structures at an impact velocity of 10 m/s are shown in Figures S9 and S10 in the supplementary material, and below. shows that the octet truss, CompIED, and ShRComp sandwich structures exhibited localised DUCTCRT contours. Figure S10 shows that the octet truss sandwich structure experienced the greatest deformation at the onset of perforation. In contrast, the ShRComp and CompIED structures exhibited better perforation resistance along the y-axis.
Figure 17. The DUCTCRT contours generated from simulating various types of sandwich structures with an impact velocity of 10 m/s are demonstrated. These include: (a) CompIED, (b) ShRComp, (c) Octet truss, (d) SC truss, and (e) Orth truss.
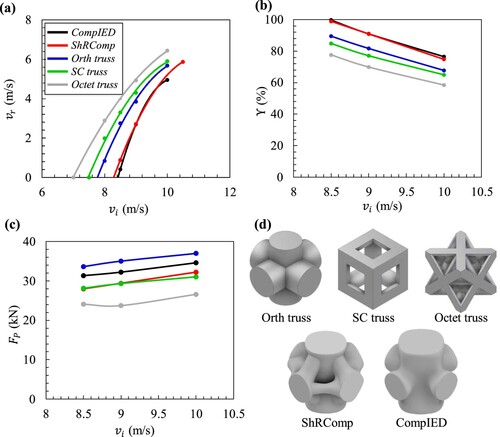
The superior performance of the CompIED and ShRComp sandwich structures in relation to impact absorption efficiency and perforation limit is evident when comparing them to alternative lattice materials across the designated range of impact velocities ((a)–(b)). The method of determining the perforation limit of each structure was by means of a polynomial regression curve. The perforation limits of the CompIED and ShRComp sandwich structures were quite close to each other, 8.4 and 8.3 m/s, respectively. Both the CompIED and ShRComp sandwich structures exhibited virtually total absorption of the initial impact at an impact velocity of vi = 8.5 m/s. This indicates that the impact velocity barely penetrated both structures. Conversely, for the same impact velocity, the remaining truss-based sandwich structures exhibited much lower impact absorption efficiency () values, with the octet truss lattice exhibiting the lowest (
) value of 77.6%. In the impact scenarios that were examined, the CompIED and ShRComp structures exhibited values of (
) that were nearly equivalent, similar to the perforation limit. It was discovered that when sandwich structures are exposed to higher impact velocities, their impact absorption capability diminishes due to the increased structural damage. When considering peak load, the CompIED structure exhibited the second-highest peak force response, with the orth truss surpassing it first, followed by the ShRComp, SC, and Octet trusses, in that order. Despite not demonstrating the minimum peak force, the proposed structures show efficient performance in terms of perforation limit and impact absorption efficiency, thereby rendering them appropriate for their usage as impact absorption apparatus.
Figure 18. Demonstrating the outputs obtained from simulating the considered sandwich structures at variant impact velocities, showing: (a) the transmitted peak force, (b) the impact absorption efficiency and (c) the perforation limit force, and (d) 3D models demonstrating unit cells of the considered structures with a relative density of 0.4.
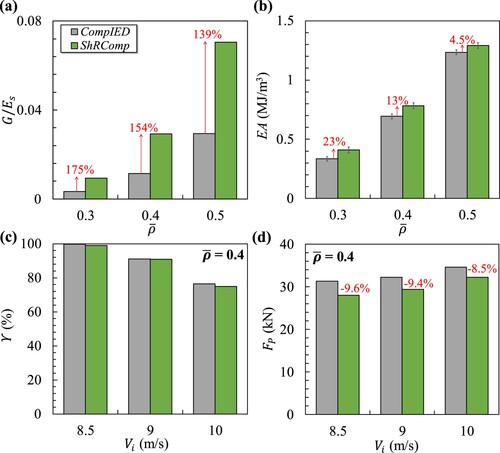
shows an overview of the enhanced performance realised in the ShRComp topology. The inclusion of shearing components in the CompIED topology significantly increased the shearing resistance by over 100% for the given relative densities, as measured by the normalised shear modulus (). Moreover, (b) demonstrates the superiority of the ShRComp lattice material in terms of its ability to absorb energy when subjected to a quasi-static loading condition. (c) demonstrates that both the CompIED and ShRComp sandwich structures displayed comparable impact absorption efficiency. However, (d) reveals that the ShRComp structure displayed a lower peak force. In view of its impact response, the ShRComp topology is highly efficient due to its ability to function as an optimal impact absorption system. This indicates that it possesses the utmost level of impact absorption and the minimal peak force. This demonstrates the successful application of topology optimisation and hybridisation methods to generate lattice materials that have enhanced energy absorption properties under both quasi-static and dynamic loading scenarios.
Figure 19. Comparing the performance of the CompIED and ShRComp topologies, showing: (a) normalised shear modulus (numerical), (b) energy absorption (compression experiment), (c) impact absorption efficiency (numerical), and (d) peak force (numerical).
8. Conclusion
This study employed the nonlinear BESO optimisation approach to create a new series of lattice materials with enhanced internal energy dissipation. The designs were optimised specifically for compressive and shear loading conditions, leading to the development of the CompIED and ShRIED designs. The lattice materials’ performance was enhanced through hybridising the topologies at varying relative densities. The proposed designs were analyzed using micromechanical finite element homogenisation simulations to investigate their orthotropic effective mechanical properties. The proposed topologies exhibited a higher uniaxial modulus compared to TPMS, auxetic, truss-, and plate-based lattice materials when subjected to loading in the direction of maximal stiffness of the structures. The samples were fabricated using the fused deposition modeling technique, utilising ABS thermoplastic material. The energy absorption abilities of the proposed designs were evaluated by quasi-static compression testing, while their mechanical response to impact loading was investigated using numerical simulations. The ShRComp lattice material, which combines the CompIED and ShRIED designs, exhibited enhanced energy absorption when exposed to quasi-static compressive loads, surpassing the performance of CompIED. A numerical analysis was conducted to assess the impact response of the CompIED and ShRComp sandwich structures at different impact velocities. The acquired peak force, impact absorption efficiency, and perforation limit were compared to several classes of sandwich structures, such as the octet truss, the simple cubic (SC) truss, and the orthogonal (ortho) truss, in order to establish a performance benchmark. Both the CompIED and ShRComp sandwich structures demonstrated superior perforation resistance and impact absorption efficiency. Despite not demonstrating the minimum transmitted peak force, the proposed designs showed remarkable performance in terms of perforation limit and impact absorption efficiency, which makes them suitable for use as protective systems in impact absorption applications. However, it is noteworthy that the current lattice structures for impact loading have been optimised assuming quasi-static loading conditions; albeit the promising results of the obtained impact behaviour, future work can investigate generating optimised lattice structures considering greater loading values (i.e. beyond 80 N) and impact loading scenarios. Also, further research should focus on examining the failure mechanisms caused by the interface between the face and core. This will contribute to broadening the use of the suggested designs as lightweight and composite structures. Given the remarkable mechanical performance of the engineered structures in terms of both quasi-static and dynamic impact loading, it is recommended for future research to focus on their utilisation in applications that require lightweight structures capable of bearing loads and absorbing impacts. An example of such an application is the use of these structures as the core structure of a spacecraft panel.
Supplemental Material
Download MS Word (17.2 MB)Disclosure statement
No potential conflict of interest was reported by the author(s).
Data availability statement
Data can be made available upon request to corresponding author.
Additional information
Funding
References
- Wang W, Jin Y, Mu Y, et al. A novel tubular structure with negative Poisson’s ratio based on gyroid-type triply periodic minimal surfaces. Virtual Phys Prototyp. 2023;18(1):e2203701. doi:10.1080/17452759.2023.2203701
- Ha CS, Lakes RS, Plesha ME. Cubic negative stiffness lattice structure for energy absorption: numerical and experimental studies. Int J Solids Struct 2019;178–179:127–135. doi:10.1016/j.ijsolstr.2019.06.024
- Li Z, Chen Z, Liu J, et al. Additive manufacturing of lightweight and high-strength polymer-derived SiOC ceramics. Virtual Phys Prototyp. 2020;15(2):163–177. doi:10.1080/17452759.2019.1710919
- Zhang J, Huang H, Liu G, et al. Stiffness and energy absorption of additive manufactured hybrid lattice structures. Virtual Phys Prototyp. 2021;16(4):428–443. doi:10.1080/17452759.2021.1954405
- Peng C, Marzocca P, Tran P. Triply periodic minimal surfaces based honeycomb structures with tuneable mechanical responses. Virtual Phys Prototyp. 2023;18(1):e2125879. doi:10.1080/17452759.2022.2125879
- Berger JB, Wadley HNG, McMeeking RM. Mechanical metamaterials at the theoretical limit of isotropic elastic stiffness. Nature. 2017;543(7646):533–537. doi:10.1038/nature21075
- Altamimi S, Lee DW, Barsoum I, et al. On stiffness, strength, anisotropy, and buckling of 30 strut-based lattices with cubic crystal structures. Adv Eng Mater 2022;24(7). doi:10.1002/adem.202101379
- Almesmari A, Alagha AN, Naji MM, et al. Recent advancements in design optimization of lattice structured materials. Adv Eng Mater 2023. doi:10.1002/adem.202201780
- Uddin MA, Barsoum I, Kumar S, et al. Enhancing compressive performance in 3D printed pyramidal lattice structures with geometrically tailored I-shaped struts. Mater Des 2024;237:112524. doi:10.1016/j.matdes.2023.112524
- Ejeh CJ, Barsoum I, Abou-Ali AM, et al. Combining multiple lattice-topology functional grading strategies for enhancing the dynamic compressive behavior of TPMS-based metamaterials. J Mater Res Technol. 2023;27:6076–6093. doi:10.1016/j.jmrt.2023.10.247
- Ejeh CJ, Barsoum I, Abu Al-Rub RK. Flexural properties of functionally graded additively manufactured AlSi10Mg TPMS latticed-beams. Int J Mech Sci 2022;223(January). doi:10.1016/j.ijmecsci.2022.107293
- Viswanath A, Khan KA, Barsoum I. Design of novel isosurface strut-based lattice structures: effective stiffness, strength, anisotropy and fatigue properties. Mater Des 2022;224. doi:10.1016/j.matdes.2022.111293
- Xiao Z, Yang Y, Xiao R, et al. Evaluation of topology-optimized lattice structures manufactured via selective laser melting. Mater Des 2018;143:27–37. doi:10.1016/j.matdes.2018.01.023
- Alawwa F, Barsoum I, Al-rub RKA. Modeling, testing, and optimization of novel lattice structures for enhanced mechanical performance. Mech Adv Mater Struct 2023: 2262987. doi:10.1080/15376494.2023.2262987
- Almesmari A, Barsoum I, Al-Rub RKA. Modelling, optimization, and testing of novel cuboidal spherical plate lattice structures. Virtual Phys Prototyp. 2024;19(1):e2308514. doi:10.1080/17452759.2024.2308514
- Jia J, Da D, Hu J, et al. Crashworthiness design of periodic cellular structures using topology optimization. Compos Struct 2021;271; doi:10.1016/j.compstruct.2021.114164
- Chen W, Xia L, Yang J, et al. Optimal microstructures of elastoplastic cellular materials under various macroscopic strains. Mech Mater 2018;118:120–132. doi:10.1016/j.mechmat.2017.10.002
- Zeng Q, Duan S, Zhao Z, et al. Inverse design of energy-absorbing metamaterials by topology optimization. Adv Sci 2022: 1–10. doi:10.1002/advs.202204977
- Huang X, Xie YM. Optimal design of energy absorption structures. In: Evolutionary topology optimization of continuum structures. Chichester: John Wiley & Sons, Ltd; 2010. p. 151–171. doi:10.1002/9780470689486.ch8
- Huang X, Xie YM, Lu G. Topology optimization of energy-absorbing structures. Int J Crashworthiness. 2007;12(6):663–675. doi:10.1080/13588260701497862
- Huang X, Xie YM. Optimal design of periodic structures using evolutionary topology optimization. Struct Multidiscip Optim 2008;36(6):597–606. doi:10.1007/s00158-007-0196-1
- Huang X, Zhou SW, Xie YM, et al. Topology optimization of microstructures of cellular materials and composites for macrostructures. Comput Mater Sci 2013;67:397–407. doi:10.1016/j.commatsci.2012.09.018
- Xie YM, Zuo ZH, Huang X, et al. Convergence of topological patterns of optimal periodic structures under multiple scales. Struct Multidiscip Optim 2012;46(1):41–50. doi:10.1007/s00158-011-0750-8
- Bohara RP, Linforth S, Nguyen T, et al. Novel lightweight high-energy absorbing auxetic structures guided by topology optimisation. Int J Mech Sci 2021;211; doi:10.1016/j.ijmecsci.2021.106793
- Huang X, Xie YM. Topology optimization of nonlinear continuum structures. In: Evolutionary topology optimization of continuum structures. John Wiley & Sons, Ltd; 2010. p. 121–150. doi:10.1002/9780470689486.ch7
- Zuo ZH, Xie YM. A simple and compact Python code for complex 3D topology optimization. Adv Eng Softw 2015;85:1–11. doi:10.1016/j.advengsoft.2015.02.006
- Zhao Z-L, Rong Y, Yan Y, et al. A subdomain-based parallel strategy for structural topology optimization. Acta Mech Sin 2023;39(9):422357. doi:10.1007/s10409-023-22357-x
- Jog CS, Haber RB. Stability of finite element models for distributed-parameter optimization and topology design. Comput Methods Appl Mech Eng. 1996;130(3):203–226. doi:10.1016/0045-7825(95)00928-0
- Huang X, Xie YM. Bi-Directional evolutionary structural optimization method. In: Evolutionary topology optimization of continuum structures. Chichester: John Wiley & Sons, Ltd; 2010. p. 17–38. doi:10.1002/9780470689486.ch3
- Thota J, Trabia MB, O’Toole BJ. Computational prediction of low impact shock propagation in a lab-scale space bolted frame structure. Int J Comput Methods Exp Meas. 2015;3(2):139–149. doi:10.2495/CMEM-V3-N2-139-149
- Abueidda DW, Kang Z, Koric S, et al. Topology optimization for three-dimensional elastoplastic architected materials using a path-dependent adjoint method. Int J Numer Methods Eng 2021;122(8):1889–1910. doi:10.1002/nme.6604
- Maute K, Schwarz S, Ramm E. Adaptive topology optimization of elastoplastic structures. Struct Optim 1998;15(2):81–91. doi:10.1007/BF01278493
- Li L, Zhang G, Khandelwal K. Topology optimization of energy absorbing structures with maximum damage constraint. Int J Numer Methods Eng 2017;112:737–775. doi:10.1002/nme
- Patel NM, Kang BS, Renaud JE, et al. Crashworthiness design using topology optimization. J Mech Des Trans ASME. 2009;131(6). doi:10.1115/1.3116256
- Li QM, Magkiriadis I, Harrigan JJ. Compressive strain at the onset of densification of cellular solids. J Cell Plast 2006;42(5):371–392. doi:10.1177/0021955X06063519
- Miltz J, Gruenbaum G. Evaluation of cushioning properties of plastic foams from compressive measurements. Polym Eng & Sci. 1981;21(15):1010–1014. doi:10.1002/pen.760211505
- Buhl T, Pedersen CBW, Sigmund O. Stiffness design of geometrically nonlinear structures using topology optimization. Struct Multidiscip Optim 2000;19(2):93–104. doi:10.1007/s001580050089
- Alkhatib SE, Karrech A, Sercombe TB. Isotropic energy absorption of topology optimized lattice structure. Thin-Walled Struct 2023;182:110220. doi:10.1016/j.tws.2022.110220
- Alkhatib SE, Xu S, Lu G, et al. Rate-dependent behaviour of additively manufactured topology optimised lattice structures. Thin-Walled Struct 2024;198:111710. doi:10.1016/j.tws.2024.111710
- Xia Z, Zhang Y, Ellyin F. A unified periodical boundary conditions for representative volume elements of composites and applications. Int J Solids Struct 2003;40(8):1907–1921. doi:10.1016/S0020-7683(03)00024-6
- Xia Z, Zhou C, Yong Q, et al. On selection of repeated unit cell model and application of unified periodic boundary conditions in micro-mechanical analysis of composites. Int J Solids Struct 2006;43(2):266–278. doi:10.1016/j.ijsolstr.2005.03.055
- Baghous N, Barsoum I, Abu Al-Rub RK. Generalized yield surface for sheet-based triply periodic minimal surface lattices. Int J Mech Sci 2023;252; doi:10.1016/j.ijmecsci.2023.108370
- Baghous N, Barsoum I, Abu Al-Rub RK. The effect of Lode parameter on the yield surface of Schoen’s IWP triply periodic minimal surface lattice. Mech Mater 2022;175; doi:10.1016/j.mechmat.2022.104473
- Abu Al-Rub RK, Lee D-W, Khan KA, et al. Effective anisotropic elastic and plastic yield properties of periodic foams derived from triply periodic Schoen’s I-WP minimal surface. J Eng Mech. 2020;146(5):1–19. doi:10.1061/(asce)em.1943-7889.0001759
- Abueidda DW, Abu Al-Rub RK, Dalaq AS, et al. Effective conductivities and elastic moduli of novel foams with triply periodic minimal surfaces. Mech Mater 2016;95:102–115. doi:10.1016/j.mechmat.2016.01.004
- Deshpande VS, Fleck NA, Ashby MF. Effective properties of the octet-truss lattice material. J Mech Phys Solids. 2001;49:1747–1769. doi:10.1016/S0022-5096(01)00010-2
- Hashin Z, Shtrikman S. A variational approach to the theory of the elastic behaviour of multiphase materials. J Mech Phys Solids. 1963;11(2):127–140. doi:10.1016/0022-5096(63)90060-7
- Grenestedt JL. Effective elastic behavior of some models for perfect cellular solids. Int J Solids Struct 1999;36(10):1471–1501. doi:10.1016/S0020-7683(98)00048-1
- Chen Z, Wu X, Xie YM, et al. Re-entrant auxetic lattices with enhanced stiffness: a numerical study. Int J Mech Sci 2020;178:105619. doi:10.1016/j.ijmecsci.2020.105619
- Ruan H, Ning J, Wang X, et al. Novel tubular structures with negative Poisson’s ratio and high stiffness. Phys Status Solidi. 2021;258(4):2000503. doi:10.1002/pssb.202000503
- Hill R. The elastic behaviour of a crystalline aggregate. Proc Phys Soc Sect A. 1952;65(5):349. doi:10.1088/0370-1298/65/5/307
- Voigt W. Lehrbuch der Kristallphysik (mit Ausschluss der Kristalloptik). 1st ed. Wiesbaden: Vieweg + Teubner Verlag Wiesbaden; 1966. doi:10.1007/978-3-663-15884-4
- Reuss A. Berechnung der Fließgrenze von Mischkristallen auf Grund der Plastizitätsbedingung für Einkristalle. ZAMM - J Appl Math Mech / Zeitschrift für Angew. Math. und Mech. 1929;9(1):49–58. doi:10.1002/zamm.19290090104
- Ran Z, Zou C, Wei Z, et al. VELAS: An open-source toolbox for visualization and analysis of elastic anisotropy. Comput Phys Commun 2023;283; doi:10.1016/j.cpc.2022.108540
- Ranganathan SI, Ostoja-Starzewski M. Universal elastic anisotropy index. Phys Rev Lett Aug 2008;101(5). doi:10.1103/PhysRevLett.101.055504
- Tanner RI. Rheo-optical properties. In: G Allen, JC Bevington, editor. Comprehensive polymer science and supplements. Amsterdam: Pergamon; 1989. p. 633–641. doi:10.1016/B978-0-08-096701-1.00056-2
- Viotti ID, Gomes GF. Delamination identification in sandwich composite structures using machine learning techniques. Comput Struct 2023;280:106990. doi:10.1016/j.compstruc.2023.106990
- Almesmari A, Sheikh-ahmad J, Jarrar F. Optimizing the specific mechanical properties of lattice structures fabricated by material extrusion additive manufacturing. J Mater Res Technol. 2022;22:1821–1838. doi:10.1016/j.jmrt.2022.12.024
- Tao Q, Ren P, Shi L, et al. Energy absorption and impact behavior of composite sandwich panels under high-velocity spherical projectile. Int J Impact Eng 2022;162:104143. doi:10.1016/j.ijimpeng.2021.104143
- Smith M. ABAQUS/standard user’s manual, version 6.9. Providence, RI: Dassault Systèmes Simulia Corp; 2009.
- Cowper GR, Symonds PS. (1957). Strain-hardening and strain-rate effects in the impact loading of cantilever beams.
- Barsoum I, Khan F, Molki A, et al. Modeling of ductile crack propagation in expanded thin-walled 6063-T5 aluminum tubes. Int J Mech Sci 2014;80:160–168. doi:10.1016/j.ijmecsci.2014.01.012
- Lundkvist A, Barsoum I, Barsoum Z, et al. Geometric and material modelling aspects for strength prediction of riveted joints. Metals (Basel). 2023;13(3). doi:10.3390/met13030500
- Elkhodbia M, Mubarak G, Gadala I, et al. Experimental and computational failure analysis of hydrogen embrittled steel cords in a reinforced thermoplastic composite pipe. Eng Fail Anal 2024;157:107962. doi:10.1016/j.engfailanal.2024.107962
- Schneider J, Schiffer A, Hafeez F, et al. Dynamic crushing of tailored honeycombs realized via additive manufacturing. Int J Mech Sci 2022;219(August 2021):107126. doi:10.1016/j.ijmecsci.2022.107126
- Yazdani Sarvestani H, Akbarzadeh AH, Niknam H, et al. 3D printed architected polymeric sandwich panels: energy absorption and structural performance. Compos Struct. 2018;200:886–909. doi:10.1016/j.compstruct.2018.04.002