
 ?Mathematical formulae have been encoded as MathML and are displayed in this HTML version using MathJax in order to improve their display. Uncheck the box to turn MathJax off. This feature requires Javascript. Click on a formula to zoom.
ABSTRACT
Lattice structures are crucial for weight reduction, and laser powder bed fusion (LPBF) is an efficient fabrication method. However, there's a notable research gap in understanding the residual deformation of LPBF-fabricated lattice structures. This study investigates the residual deformation of three basic lattice structures, body centre cell (BCC), face centre cell (FCC), and diamond cell (DC), fabricated via LPBF to reveal their deformation mechanisms. Analysis covers horizontal direction, building direction, and total deformations, unveiling complex structural responses. Lower relative densities exhibit a prevalent structural deformation mode (SDM) causing significant deformations, while higher densities shift to an intrinsic deformation mode (IDM) dominated by contraction during fabrication. The FCC structure shows optimal stability with minimal residual deformation across most densities. This study offers insightful findings and a detailed mechanistic analysis of residual deformation in LPBF-fabricated lattice structures, applicable across various configurations, ensuring design process uniformity and reliability.
| Nomenclature | ||
| A | = | laser absorbtivity |
| C | = | heat capacity |
| d | = | deformation, μm |
| E | = | elasticity modulus, GPa |
| Ep | = | plastic tangent modulus, GPa |
| G | = | shear modulus, GPa |
| H | = | scanning spacing, μm |
| Hv | = | volume enthalpy, W × m−1×s−1 |
| K | = | thermal conductivity, × 109J × m−3 |
| L | = | dimension, μm |
| mL | = | heat source coefficient |
| = | unit vector | |
| N | = | equivalent layer number |
| P | = | laser power, W |
| q | = | power density, J/mm3 |
| r | = | laser spot radius, μm |
| T | = | temperature, °C |
| Telem | = | elements temperature, °C |
| Tmelting | = | melting point temperature, °C |
| Tf | = | fluid medium temperature °C |
| Tamb | = | ambient temperature °C |
| ΔT | = | temperature change °C |
| V | = | volumn |
| Greek | ||
| α | = | thermal expansion coefficient, × 10−6/°C |
| ϵe | = | emissivity |
| ϵp | = | the plastic normal strain |
| γp | = | the plastic shear strain |
| ρm | = | density, g × mm−3 |
| ρ | = | relative density |
| η | = | laser penetration depth, μm |
| σSB | = | Boltzmann constant, J × K−1 |
| σ0.2 | = | yield strength, MPa |
| ν | = | Poisson's ratio |
| σ | = | normal stress, MPa |
| Abbreviate | ||
| BCC | = | body centre cell |
| BD | = | building direction |
| BD-p | = | positive building direction |
| BD-n | = | negative building direction |
| DC | = | diamond cell |
| Eqv | = | equivalent |
| FCC | = | face centre cell |
| HD | = | horizontal direction |
| IDM | = | intrinsic deformation mode |
| JFDM | = | joint fusion deformation mode |
| LPBF | = | laser powder bed fusion |
| SDM | = | structural deformation mode |
1. Introduction
Lattice structures have garnered extensive attention from both academia and industry since their inception, emerging as a pivotal strategy for weight reduction in various components across different sectors. Their chief advantage lies in their capacity to ensure commendable mechanical properties[Citation1–3], efficient heat transfer characteristics [Citation4], and exceptional energy absorption capabilities[Citation5], while effectively reducing the overall weight of the structure. The widespread applications of lattice structures span diverse industries[Citation6], including but not limited to biomedical [Citation7,Citation8], aerospace [Citation9], and rail vehicles [Citation10].
Despite their remarkable benefits, the fabrication of these intricate lattice configurations poses significant challenges using conventional production methodologies. Laser powder bed fusion (LPBF) technology is an advanced approach that offers a distinct and innovative manufacturing method [Citation11–13]. LPBF operates by layering 3D models and incrementally processing them, granting excellent design freedom and manufacturing flexibility [Citation14,Citation15]. Within this context, LPBF stands out for its unique advantages in crafting metallic lattice structures.
The last decade has witnessed a surge in scholarly exploration dedicated to the LPBF fabrication of lattice structures [Citation16]. A primary focus of these studies has been the meticulous examination of the mechanical properties exhibited by these lattice formations. Scholars have delved extensively into understanding the tensile [Citation17,Citation18], compressive [Citation19,Citation20], bending [Citation21,Citation22], and creep behaviours [Citation23] displayed by various lattice configurations. Furthermore, comparative studies evaluating mechanical properties pre – and post-heat treatment have been undertaken [Citation17,Citation24]. Raffaele De Biasi et al [Citation25] conducted research that underscored the pronounced influence of lattice orientation during the molding process on fatigue properties. Expanding beyond mechanical assessments, researchers have ventured into assessing the biological properties of lattice structures in the context of medical applications [Citation26–28].
Over recent years, the focal point of research concerning LPBF fabricating lattice structures has gradually shifted towards enhancing processing quality. Yinchuan Wang et al. [Citation29] highlighted the divergence of the LPBF forming process for lattice structures from the conventional cubic forming due to the restricted molding area inherent in a single layer of lattice structures. Consequently, tailoring the LPBF process for molding lattice structures becomes imperative. Furthermore, scholars have observed a higher incidence of forming defects in LPBF lattice structures compared to their ordinary cubic counterparts[Citation18,Citation30,Citation31], significantly impacting the mechanical properties of these lattice structures [Citation32]. Likewise, distinct disparities in the microstructure of LPBF lattice structures in contrast to ordinary cubic specimens have been noted [Citation30,Citation33]. Moreover, Fabio Guaglione et al. [Citation34] extensively investigated the strut diameter limitations in LPBF moldable lattice structures, achieving a remarkable 2% relative density in lattice structures. Similarly, J. NORONHA et al. [Citation35] explored the manufacturability of LPBF within hollow lattice configurations with varying outer diameters, wall thicknesses, and inclinations, concluding that the manufacturing process for hollow lattice structures should entail an angle greater than 22.5° between the lattice branches and the horizontal plane. Collectively, these studies signify the relative maturity of the LPBF process in shaping lattice structures, encompassing considerations of metallurgical defects, microstructural nuances, mechanical properties, and other influential factors. Such comprehensive investigations have substantiated the utilisation of LPBF lattice structures in industrial applications.
In the realm of shape control, limited research has been conducted thus far. Surface quality issues have emerged as a prominent concern in LPBF lattice structures. Lorena Emanuelli et al. [Citation36] observed a pervasive unmelted powder situation within these structures, significantly impacting surface quality. Yinchuan Wang et al. [Citation29] identified varying process parameters as influential factors affecting surface quality, where these concerns directly impact molding accuracy [Citation37]. Beyond surface quality investigations, Junhao Ding et al. [Citation38] delved into the molten depth-induced staircase effect, compression-induced thickening effect, and scrape-induced thinning effect, proposing corresponding compensation strategies. Additionally, Chaolin Tan et al. [Citation39] scrutinised the impact of laser track width, beam compensation, and contour distance on the dimensions of LPBF lattice structures. While a handful of studies have focused on dimensional accuracy, they predominantly revolve around surface quality or dimensional deviations due to scanning strategy stemming from the forming process. Regrettably, there is still a significant lack of research on the overall deformation of the structure, which is more critical to the control of the shape of the LPBF lattice structure.
Several studies have examined the residual deformation characteristics specific to LPBF, highlighting differences compared to conventional machining. LPBF typically fabricates parts on a substrate. Research by Zaeh et al. [Citation40] demonstrated that removing the support structure from the part induces warping and deformation. Ahmed et al. [Citation41] investigated the impact of wall thickness on residual deformation in LPBF thin walls, finding that residual deformation decreases as wall thickness increases. Jayanath et al. [Citation42] observed maximum residual deformation in LPBF box parts at the midpoints of the part edges, attributing this to compressive stresses from the underlying material and substrate. X. Liang et al. [Citation43] proposed an intrinsic strain method to study the residual deformation of thin-walled braced complex structures fabricated by LPBF, primarily focusing on regular structures. F. Calignano [Citation44] analyzed the effect of supports on overhanging structures deformation and proposed effective methods for optimising the supports.
Most existing research focuses on LPBF forming basic geometries, largely omitting comprehensive studies on residual deformation in LPBF lattice structures. Distortion in lattice structures affects both dimensional accuracy and shape precision, leading to deviations between the molded and designed parts and posing challenges during assembly and use. Additionally, dimensional distortions significantly impact the mechanical properties of lattice structures [Citation45]. However, comprehensive investigations into these deformation phenomena specific to LPBF lattice structures are notably absent from the current body of research.
In summary, residual deformation in additively manufactured lattice structures can lead to significant performance degradation and is likely to accumulate with an increasing number of lattice cells in large parts. Research in this area has not yet been reported, highlighting the need for innovative methodologies to study residual deformation in the additive manufacturing of intricate structures. Understanding the mechanisms governing residual deformation in these structures is crucial. This paper introduces a novel finite element analysis approach that focuses on the residual deformation of unit cells using a layer-by-layer equivalence method. By investigating various cell models and relative densities, this study reveals the unique distribution patterns and mechanisms of residual deformation in lattice structures. This research lays the groundwork for understanding dimensional accuracy in additively manufactured lattice structures. The proposed finite element model can predict and analyze residual deformation in complex lattice structures used in LPBF. The results of this predictive analysis can be used to improve the design and manufacturing consistency of additively manufactured complex structures by employing design pre-compensation methods, thereby enhancing their quality and performance.
2. Finite element analysis model
2.1. Model assumptions
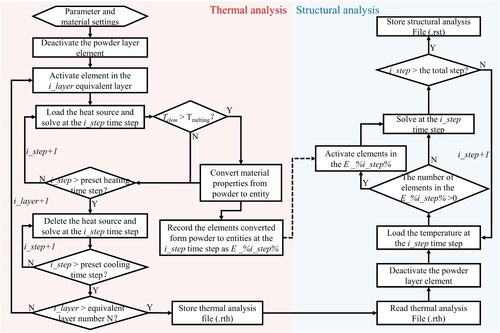
This investigation employed ANSYS to formulate the finite element model, integrating the thermodynamic indirect coupling method. The entire finite element solution process is realised through a secondary APDL language. Initially, the temperature distribution was resolved by applying the Fourier heat transfer equation. Subsequently, this temperature data was incorporated into the structural solution through the stress governing equations. The element birth and death technique was used to simulate the case where the unprocessed layer does not transmit temperature and stress. Herein, the unit representing the unprocessed layer was deactivated, assigning infinitesimally small mechanical properties. These inactive elements were reactivated upon the element temperature Telem is greater than melting temperature Tmelting, reinstating their mechanical properties. In terms of time step loading and evolution, an asymptotic time step strategy is used in order to ensure the convergence of the computation. Using excessively large time steps can impede the convergence of transient computational processes, while overly small time steps can hamper computational efficiency. In the context of LPBF, where material temperatures can change at rates up to 106 °C/s during heating and cooling phases, it's essential to adjust time steps accordingly. Small time steps in the order of microseconds (µs) are appropriate during rapid temperature changes, while larger time steps ranging from milliseconds (ms) to seconds (s) can be utilised during the cooling phase, depending on the size of the model. The heat source loading time and cooling duration depend on the process parameters and the equivalent layer scanning volume.
Currently, common finite element models for additive manufacturing can be categorised into three types depending on the research object: single-track model, single-layer model, and multi-layer model. Due to their different research objects, their research focuses are usually different [Citation46]. Due to the limitations of computational efficiency and data volume, these three models have different mesh sizes, resulting in different spatial resolutions. The single-track model is usually used to study the melting behaviour at every tiny moment of a single-track [Citation47–49]. Single-layer models are usually used to study the effect of different scanning strategies on the temperature or stress field, ignoring the melting behaviour of single-track [Citation50–52]. Multi-layer models are usually used to study the residual stress distribution and dimensional accuracy of a given structure, without considering the effects of scanning strategies and single-track melting behaviour [Citation40,Citation53,Citation54].
The object of this study is a complex structure, so the multi-layer model was used, as shown in . The thickness of the powder layer in LPBF processing is usually 0.02 mm-0.06 mm [Citation55,Citation56]. For the lattice with a height of tens of millimetres, the use of actual layer thicknesses would result in an extremely large amount of data and low computational efficiency. Therefore, we used the equivalent method of combining multiple real powder layers into one equivalent layer to simplify calculations. Multi-layer models are usually used to study the residual stress distribution and dimensional accuracy of a given structure, without considering the effects of scanning strategies and single-track melting behaviour, which was also used in other studies [Citation57,Citation58]. The lattice structure is rotationally symmetric and the effect of the scanning strategy is not considered in our model. Therefore, the results in the X-direction are usually completely equivalent to those in the Y-direction. In the subsequent analysis, we call the X-direction and Y-direction the horizontal directions (HD) for the convenience of description, and the Z-direction the building direction (BD). If not specified, the horizontal direction takes the X-direction results as representative.
Figure 1. The multi-layer model used in this work.
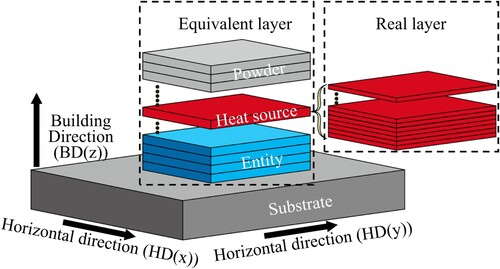
Certainly, here is an expanded description of the LPBF process concerning the multi-layer model:
Within each equivalent layer, a uniform heat flow density is uniformly applied. Consequently, the entirety of the equivalent layer experiences heating and cooling in unison, optimising computational efficiency.
In meshing, a single layer of mesh is used in each equivalent layer, and this approach ensures that the deformation within a single equivalent layer remains consistent. Topology sharing nodes are performed between equivalent layers to ensure good transfer of physical quantities.
The bilinear isotropic (BISO) hardening strategy of ANSYS was used in this study. Under the BISO hardening criterion, the position and shape of the yield surface remains unchanged when in the loaded state, but simply expands or shrinks proportionally in size. The bilinear isotropic hardening criterion is described by a bilinear effective stress versus effective strain curve. The initial slope of the curve is the modulus of elasticity, and above the yield stress, a plastic strain occurs and the slope is the plastic tangent modulus. This option uses the von Mises yield criterion and the von Mises stress σeqv can be calculated by Equation (1):
(1)
Figure 2. The secondary developed APDL language flowchart.
2.2. Governing equations and heat source
2.2.1. Thermal analysis
Since LPBF has a large temperature gradient and cooling rate, the Fourier heat transfer equation was used in solving the temperature field [Citation59]:
(2)
(2) where k is the thermal conductivity. q is the power density of the heat source. ρm is the density, and C is the specific heat capacity of the material.
In addition, the heat transfer between the solid and the surrounding fluid medium and the thermal radiation from the powder bed and the entity need to be considered, which are expressed by the following equations, respectively [Citation62]
(3)
(3)
(4)
(4) where Tf is the temperature of the fluid medium surrounding the entity and Tamb is the ambient temperature, both of which are room temperature 25 °C. hconv is the convective heat transfer coefficient; σSB is the Boltzmann constant; and ϵe is the emissivity of the material. We combine the two into a composite heat transfer coefficient:
(5)
(5)
2.2.2. Structural analysis
In the deformation of metal under stress, the metal usually goes through three stages: elastic deformation, plastic deformation, and fracture. Therefore, elastoplastic models were used for structural analysis. The basic governing equations were the set of stress–strain equations for thermo-elastoplastic bodies [Citation63,Citation64], which consisted of equilibrium, geometric, and physical equations, respectively:
(6)
(6)
(7)
(7)
(8)
(8) where σ is the normal stress and τ represents the shear stress; ϵ is the normal strain and γ represents the shear strain; E, G, and ν are the modulus of elasticity, shear modulus, and Poisson's ratio, respectively. ϵp is the plastic normal strain; γp is the plastic shear strain, α is the coefficient of thermal expansion, and ΔT is the amount of temperature change.
2.2.3. Heat source
In our finite element analysis, heat input is facilitated through the creation of a heat source. We omitted the laser transmission process, instead directly applying a heat flux density with a distinct distribution to the laser spot position. Among prevalent heat source models – surface heat source, body heat source, combined heat source, and equivalent heat flux density [Citation57,Citation65], extensively utilised in finite element analyses – we specifically opt for the equivalent heat flux density model. This choice is instrumental in achieving simultaneous processing across multiple real powder layers within the context of our multi-layer model. The equivalent heat flux density [Citation66,Citation67] is as follows:
(9)
(9) where mL is the heat source coefficient, and H is the scanning spacing. The value of mL is corrected by comparing the experimental results to get the accurate heat input. A is the absorbtivity of powder material, and P is the power of the laser. η is the laser penetration depth, usually taken as the powder layer thickness. r is the laser spot radius. In this model, the several real powder layers are equated to one equivalent powder layer, which is heated and cooled simultaneously. The number of equivalent layers is recorded as N. The smaller the N is, the lower the efficiency and the higher the accuracy. The confirmation of the N value will be explained in the next section.
2.3. Material properties
In this study, the substrate material is 316L, and the powder material is GH4099. The components of GH4099 are shown in [Citation68]. At present, GH4099 already has a mature LPBF manufacturing process, and there have been related heat treatment [Citation56] and mechanical [Citation68] research. GH4099 can already be used to manufacture complex structures through LPBF. The thermophysical parameters required in the above thermal governing equations are the volume enthalpy H and the thermal conductivity K. The thermal conductivity of GH4099 was obtained from the Chinese Aerospace Materials Handbook [Citation69]. The thermal conductivity of GH4099 powder was calculated using the Yagi-kunii model [Citation70]. The detailed calculation procedure can be found in our previously published literature [Citation70]. The thermal conductivity and volumetric enthalpy of 316L were obtained from the Ref. [Citation71]. The volumetric enthalpy of GH4099 lacked the relevant literature and was calculated using the JmatPro physical parameter calculation software. The temperature-dependent mechanical properties of GH4099 are shown in . These mechanical properties are synthesised from Ref. [Citation56,Citation68,Citation69] .
Figure 3. The volume enthalpy H [Citation69]and the thermal conductivity K [Citation72] of GH4099 and 316L.
![Figure 3. The volume enthalpy H [Citation69]and the thermal conductivity K [Citation72] of GH4099 and 316L.](/cms/asset/fc0db197-ba16-40e8-8a2c-bcfd350a11fd/nvpp_a_2367104_f0003_oc.jpg)
Table 1. The compositions of GH4099 [Citation68].
Table 2. The mechanical properties of the GH4099 entity [Citation56,Citation68,Citation69].
3. Lattice modeling
Three quintessential lattice structures were chosen as the samples: the body centre cell (BCC), face centre cell (FCC), and diamond cell (DC). Recognising the prevalent utilisation of lattice structures for weight reduction purposes, we opted to maintain a consistent relative density, denoted as ρ, rather than fixing the strut diameter. The relative density of the lattice structures was set at 5%, 15%, 25%, 35%, and 45%. The relative density is calculated as follows:
(10)
(10) where Vlattice is the volume of the lattice, and Vcubic is the volume of the cube at the same size as the lattice. The choice of relative density takes into account the molding difficulty of the lattice as well as the weight reduction performance. Lattice structure with 5% or less relative density will have a strut diameter of less than 1 mm, which puts high demands on the fabricating process. Lattice structure with 45% or more relative density will have a poor weight reduction effect, and is usually not considered for lightweight design. We've added the details to the manuscript. In the actual study, we considered the maximum deviation of the volume fraction within 3% as compliant for the convenience of fabricating. We considered this deviation in the quantitative data analysis and plotted it in the images.
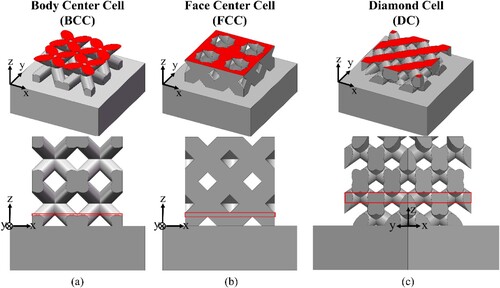
In practical applications, the lattice structure rarely exists solely as an individual cell. Hence, it becomes imperative to account for the neighbouring cells’ impact on the studied cell. Departing from a unit cell lattice, our modelling approach involves an 8-cell lattice, depicted in . This 8-cell lattice can be envisioned as a single cell situated at the structure's core, encompassed by an adjoining segment of the surrounding lattice directly linked to that central cell. Our analytical methodology extracts and scrutinises outcomes solely from the single central cell for focused analysis and interpretation. The substrate spans 15 × 15 × 10 mm³, while the unit cell's outline measures 10 × 10 × 10 mm³.
Figure 4. Three typical cells and their meshing selected for this study (a) BCC, (b) FCC, (c) DC.
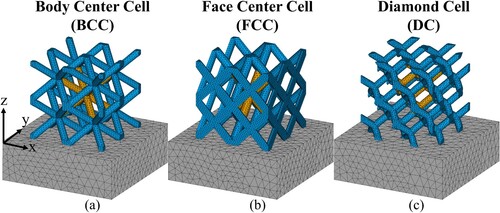
Finite element models commonly employ tetrahedral or hexahedral elements to represent the solution area [Citation52,Citation59,Citation73]. Given the intricate nature of our research object, we opted for tetrahedral elements due to their superior geometrical adaptability. For the transient temperature field solution, we utilised the SOLID291 quadratic shape thermal effect element, while the corresponding SOLID187 structural effect element was employed for transient structural analysis.
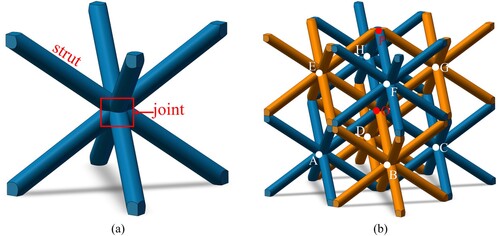
The configuration of the lattice structure's struts and joint components is delineated in . For expeditious referencing in Section 4, the joints and struts of the BCC are designated for descriptive convenience. The central joint is labelled as O. Any point where multiple struts converge is acknowledged as a joint. Due to the lattice's periodic nature, certain joints may equivalently correspond to one another under specific circumstances.
Figure 5. (a) The struts and joint parts of the lattice structure, (b) Naming of joints and struts.
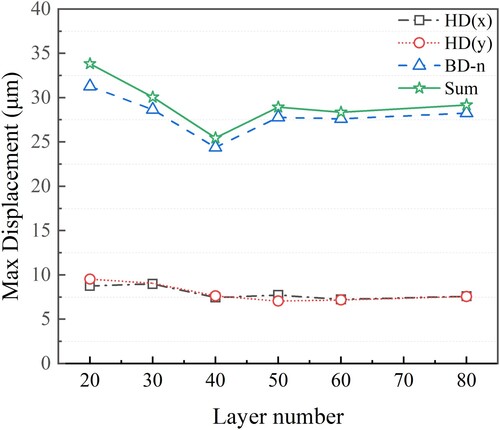
Given that each equivalent layer contains only one element in the building direction, the mesh size is contingent upon the number of equivalent layers N. Consequently, comparative simulations were conducted for the BCC with a 35% relative density, varying the values of N to ascertain the optimal parameter. The simulations encompassed values of N spanning from 20 to 80.
The results of the residual deformation are explained here. A positive deformation value indicates a direction aligning with the coordinate axis, while a negative value indicates an opposite direction as shown in . For deformations along the X and Y axes (horizontal direction), positive and negative values are symmetrical. The maximum residual deformation is determined by averaging the absolute values of positive maximum residual deformation and negative maximum residual deformation. However, in the Z-axis (building direction), the positive and negative residual deformations differ. These are designated as BD-p and BD-n, respectively. The maximum residual deformation in each direction is separately calculated. Subsequent discussion reveals that dBD-n generally surpasses dBD-p significantly. Therefore, the focus lies on residual deformations in the X (dHD(x)) and Y (dHD(y)) directions, alongside the dominant residual deformations in the building direction dBD-n and total residual deformation ds, as depicted in . The ds is the vector sum of the dHD(x), dHD(y), and dBD, calculated as:
(11)
(11) The maximum deformation dmax is
(12)
(12) The analysis reveals a trend of stabilisation in maximum residual deformation with horizontal direction dHD(x) and dHD(y) beyond N = 40, while the building direction residual deformation dBD-n and total residual deformation ds tend to stabilise after N > 50. When N = 80, the computation time for one simulation case is about 90 hours, which is an unacceptable computational efficiency. Balancing calculation accuracy and computational efficiency, we opt for N = 50, establishing an equivalent layer thickness of 0.4 mm for the lattice structure. The edge length of the tetrahedral elements is set to 0.7 mm. Similarly, for the thin wall structure utilised in model validation, we adopt N = 50, establish a same equivalent layer thickness and elements size with lattice structure These settings align with our considerations regarding both accuracy and computational efficiency across the diverse structures under analysis.
Figure 6. Schematic diagram of deformation.
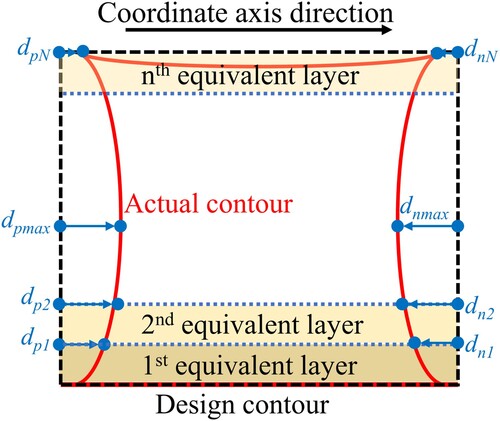
Figure 7. Max displacement for different numbers of equivalent layers.
4. Results and discussion
4.1. Experimental verification of the model
The primary aim of this section is to calibrate the simulation model by aligning it with experimental data, specifically to derive precise values for the mL parameters within the equivalent heat source. The specimens used for experimental verification were fabricated by a self-developed LPBF machine which was named TS300A. An IPG-YLR-500 fibre laser with a maximum laser power of 500 W was used as the laser source. Before the experiments, GH4099 spherical powders with particle sizes of 15–53 μm were dried in a vacuum drying oven. Argon was circulated as a protective gas in the molding chamber during the fabricating process, and the oxygen content was controlled below 100 ppm. The process parameters utilised for experiments were the same as the simulation, i.e. 340 W laser power, 1400 mm/s scanning speed, 0.04 mm layer thickness, and 0.11 mm hatch spacing. After fabrication, the YOZ sides of the specimens were sandblasted for residual deformation. The measurement process met the Chinese national standard GB/T 21389–2008. The simulation and experimental results are shown in .
Figure 8. (a) Scanning strategy of experimental validation (b) Experiment specimen (c) X-component residual deformation distribution of simulation and experimental measurement position (d) comparison between experiment and simulation.
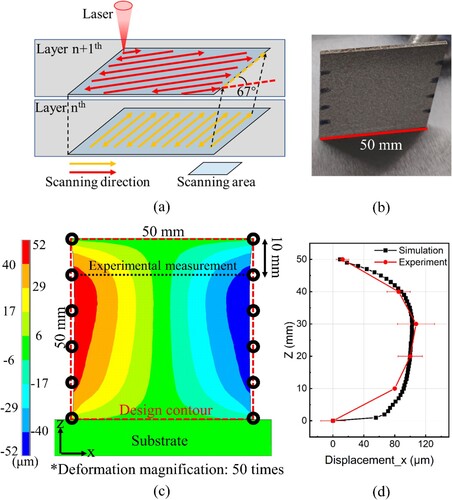
In finite element structural analysis, results fall into two categories: direct and indirect. We rely on deformations to validate the accuracy of our model as the deformation is the only direct result of finite element structural analysis. The dimensions used for model verification include a substrate size of 60 × 20 × 10 mm³ for the thin wall structure. The thin wall itself measures 50 × 50 × 2 mm³. In the experiment, the X direction dimension along the building direction was measured every 10 mm. Each point was measured five times and averaged. The experimental deformation de is defined as:
(13)
(13) where Ldesign and Le are the design and experimentally measured dimensions, respectively.
The experimental deformation was obtained by making a difference with the design dimension of 50 mm. In the simulation, since the four prongs in the z-direction are completely equivalent, we extracted all the residual deformation data on the prongs at x = 10 mm and y = 4 mm. After several calibrations, the final equivalent heat source coefficient mL was determined to be 0.5. Notably, both experimental and simulated X-component residual deformations exhibit a concave C-shaped trend. The maximum deviation between experimental and simulated residual deformations is 11.52 μm (14.4%). It means that the model is highly accurate.
4.2. Horizontal residual deformation
4.2.1. Residual deformations distribution
The assessment of lattice residual deformation encompasses four facets: horizontal residual deformation dHD(x) and dHD(y), building direction residual deformation dBD, and total residual deformation ds. Given the complexity of lattice structure deformation, a supplementary dynamic figure in the Appendix offers a more intuitive demonstration of these observations. The Appendix contains the deformation kinematics of the forming process for three lattice single-cell structures with 5% relative density and 45% relative density.
We extracted contour maps to analyze the distribution of residual deformation. Given the lattice's rotational symmetry, we utilise absolute values for quantitative analysis. and present the contour map of dHD(x) and dHD(y), respectively. In these maps, red arrows denote locations with the largest positive residual deformation, whereas blue arrows signify areas with the largest negative residual deformation. Notably, the distribution of dHD(x) and dHD(y), as observed in the contour maps, remains almost identical, differing only in the direction of residual deformation. Examining the variation in different relative densities of lattices involves extracting the maximum residual deformation from each computational case, depicted in . The trends of maximum X-component residual deformation dHD(x)-max and maximum Y-component residual deformation d HD(y)-max parallel the relative density ρ. Therefore, dHD will next be used as a proxy for both, taking the value of dHD(x).
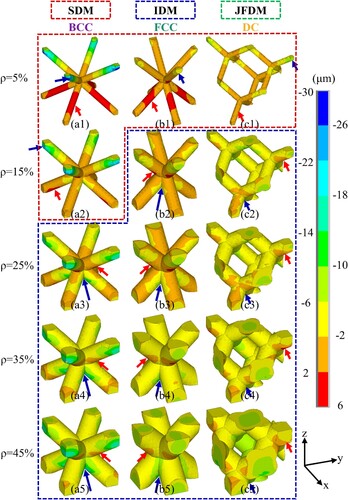
Figure 9. X-component residual deformation distribution at different relevant densities and different lattice types. The red arrow points to the position with the largest positive residual deformation and the blue arrow points to the position with the largest negative residual deformation. (a) BCC, (b) FCC, (c) DC. SDM: structural deformation mode, IDM: intrinsic deformation mode, JFDM: joint fusion deformation mode.
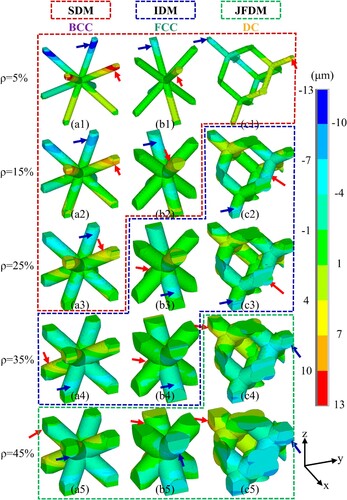
Figure 10. Y-component residual deformation distribution at different relevant densities and different lattice types. The red arrow points to the position with the largest positive residual deformation and the blue arrow points to the position with the largest negative residual deformation. (a) BCC, (b) FCC, (c) DC. SDM: structural deformation mode, IDM: intrinsic deformation mode, JFDM: joint fusion deformation mode.
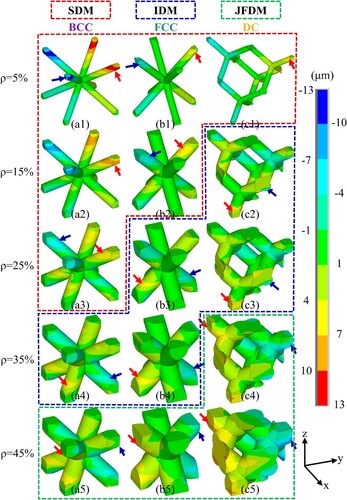
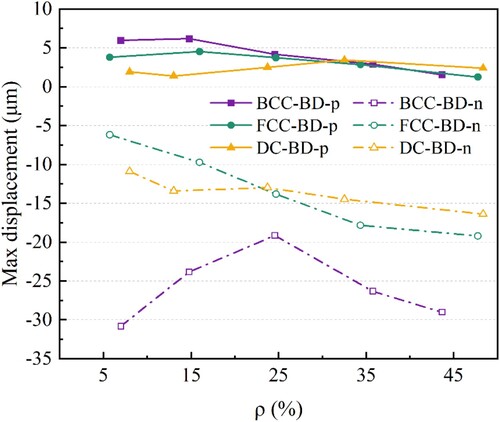
Figure 11. The maximum horizontal residual deformation with the relative density change.
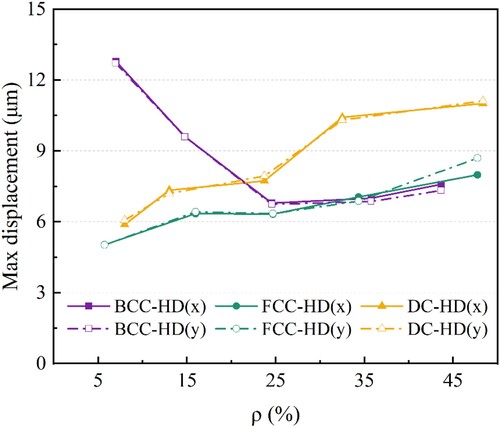
At 5% relative density, the upper joints of all three lattice types display deformation away from the lattice centre, with the maximum horizontal residual deformation dHD-max concentrated in these areas. For BCC, FCC, and DC, dHD-max measures 12.97, 5.03, and 5.89 μm, respectively. Notably, the dHD-max of BCC significantly surpasses that of the other two lattices, indicating relatively poorer structural stability. Furthermore, the dHD-max of the BCC decreases and then increases with rising relative density, reaching a minimum of 6.86 μm at 25% relative density before ascending to 7.72 μm at 45% relative density. The dHD-max of FCC and DC steadily increases with rising relative density, reaching 8.22 and 11.07 μm, respectively, at 45% relative density.
4.2.2. Deformation mechanisms
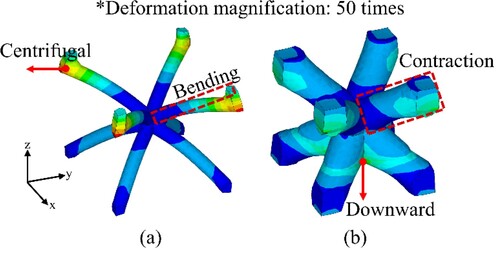
The deformation in the lattice presents two distinctive aspects: structural deformation and intrinsic deformation. Both are caused by thermal stresses present in the LPBF process, creating significant residual stresses due to rapid cooling rates up to 106°C/s [Citation74,Citation75], and just behave differently with different lattice types and relative densities. The structural deformation is clearly characterised by the shape distortion of the lattice structure that cannot maintain its original shape, while the intrinsic deformation results in the radial contraction of struts or joints on the basis of the shape maintaining the original shape. The deformation modes that are mainly characterised by structural deformation we call structural deformation mode (SDM), and the deformation modes that are mainly characterised by intrinsic deformation we call intrinsic deformation mode (IDM). The two deformation modes aspects represented by 5% relative density BCC lattice and 35% relative density BCC lattice are shown in . SDM is conspicuous in low relative density, attributed to the lattice's complex structure and its diminished resistance to deformation with low relative density. When residual stresses accumulate, structures with poor structural stability can exhibit deformations that deviate from their original shape. For instance, in the BCC lattice with 5% relative density, thinner and less resistant struts in low relative density lattices predominantly govern overall deformation, leading joints E, F, G, and H, and their connections to joint O to horizontally deform away from it and sink toward the substrate ((a)). In the BCC lattice, SDM is most characterised by struts bending. As the relative density increases, the increase in the cross-sectional area of the lattice leads to an increase in the stability of the structure along with an increase in the residual stresses, which in turn leads to a contraction of the structure itself [Citation42,Citation76]. At this point the deformation mode is converted from SDM to IDM. In the BCC structure with 35% relative density, maximum inward deformation occurs in the strut's centre, akin to the C-shaped shrinkage observed in thin-wall model validation ((b)), both of which are intrinsic deformations. In the BCC lattice, IDM leads to radial contraction in the middle of the struts and subsidence at the bottom of the joints.
Figure 12. The deformation mode: (a) structural deformation mode (SDM). and (b) intrinsic deformation mode (IDM). The red dotted line is the design outline.
We specifically analyze the horizontal deformation in the lattice structure using the BCC as a detailed example. The dHD-max of the BCC shows a fluctuating trend with increasing relative density. From 5% to 25% relative density, dHD-max on joints E, F, G, and H is indicative of structural deformation, representing a SDM. At 25% relative density, a slight shift occurs in the location of dHD-max, moving from entire joints E, F, G, and H to the upper surfaces of struts OE, OF, OG, OH ( (a3)), resulting from a combination of intrinsic and structural deformation. As relative density increases, lattice strength grows, nearly suppressing structural deformation entirely. When the relative density reaches 35%, dHD-max relocates from the lattice top to the middle of struts AO, BO, CO, and DO, signifying a transition from SDM to IDM. This relative density marks the critical boundary between SDM and IDM, denoted as ρS-I. At 45% relative density, the position of dHD-max shifts form the middle of struts to the junction between struts. Although akin to the location at 5% relative density, the direction is opposite due to joints E, F, G, and H aligning with joints O in the Z-direction, leading to a joint fusion phenomenon between joints A, B, C, D, and O. This fusion is depicted in , with BCC exhibiting the least fused joint volume. Fusioned joint increases shrinkage compared to individual joints and struts, directing dHD-max to this overlapping section, representing a joint fusion deformation mode (JFDM). Despite joint fusion, intrinsic deformation remains the primary source of deformation in JFDM, characterising an overall contraction towards the centre, resembling a cubic shape.
Figure 13. The joint fusion phenomenon of (a) BCC with 45% relative density, (b) FCC with 45% relative density, and (c) DC with 45% relative density. The area shown by the red cross-section or line is the joint fusion area.
The dHD-max in FCC demonstrates an escalating trend with rising relative density. The deformation of FCC is SDM at 5% and 15% relative density. However, the FCC possesses strong structural stability. Notably, at 5% relative density, the dHD-max in FCC is merely 38.8% of that of the BCC. However, at 25% relative density, FCC undergoes a transition from SDM to IDM, with ρS-I smaller than that of BCC. Interestingly, unlike the BCC, the dHD-max shifts from the lattice top to the middle of struts, indicating a deviation in deformation behaviour. Upon reaching 45% relative density, FCC displays joint fusion, adopting the JFDM. Similar to BCC, dHD-max relocates to the junction between struts. Notably, post 25% relative density, dHD-max in both BCC and FCC becomes nearly identical due to their similar single-cell configurations, both manifesting IDM characteristics at this stage.
The deformation mode in DC appears intricate in the contour map but shares a resemblance to the aforementioned patterns. At 5% relative density, DC exhibits SDM, with dHD-max concentrated at the top joints. Transitioning to 15% relative density, SDM shifts to IDM, with ρS-I smaller than that of BCC and FCC. Notably, at this density, structural deformation in DC is entirely suppressed, and dHD-max relocates to the bottom joints. Advancing to 35% relative density, DC transforms into JFDM, displaying a more pronounced joint fusion phenomenon than BCC and FCC. Notably, a section of the XOY cross-section of the entire 8-cell lattice forms a cohesive whole ( (c)), with dHD-max depicted in (c4), (c5).
FCC consistently demonstrates the smallest dHD-max among the three lattice types across various relative densities. Notably, the difference compared to BCC diminishes significantly at higher relative densities. At 45% relative density, DC's dHD-max surpasses that of BCC and FCC by 43.4% and 34.7%, respectively. This disparity primarily arises from a more pronounced joint fusion phenomenon in DC compared to the other lattice types.
This section concludes with a summary of the deformation mechanism: Residual deformation is a common occurrence in lattice structures during additive manufacturing, stemming from two primary sources: structural deformation and intrinsic deformation. These sources coexist in varying proportions, leading to different types of residual deformation based on relative densities and lattice structures. When structural deformation plays a dominant role, the deformation can be referred to as SDM. it is mainly characterised by the bending of the strut which cannot maintain its original shape. The main factor is the structural stability of the lattice. When the intrinsic deformation plays a dominant role, the deformation can be called IDM. its main characteristic is that the lattice can keep its original shape but the strut is prone to radial shrinkage. Among the IDM deformations, there is a special kind of deformation, JFDM, which mainly occurs in large relative density lattices where the joints fusion occurs. It is mainly characterised by an overall contraction similar to that of a 100% relative density cube.
4.3. Building direction residual deformation
4.3.1. Residual deformations distribution
The contour map of the extracted building direction residual deformation is displayed in . Analysis of the contour map reveals that the building direction positive residual deformation dBD-p predominantly manifests when relative density is low, concentrating notably on struts in the lower section of the lattice. Conversely, the building direction negative residual deformation dBD-n is concentrated at the bottom of joints across all three lattice types.
Figure 14. Building direction residual deformation distribution at different relevant densities and different lattice types. The red arrow points to the position with the largest positive residual deformation and the blue arrow points to the position with the largest negative residual deformation. (a) BCC, (b) FCC, (c) DC. SDM: structural deformation mode, IDM: intrinsic deformation mode, JFDM: joint fusion deformation mode.
displays the extracted building direction maximum residual deformation. Notably, the maximum building direction positive residual deformation dBD-pmax across all three lattices is smaller than the maximum building direction negative residual deformation dBD-nmax. The majority of dBD-pmax values are below 5 μm. Specifically, dBD-pmax for BCC and FCC experiences a slight decrease with rising relative density, while for DC, it fluctuates around 2 μm. Conversely, dBD-nmax for the three lattices showcases downward deformation toward the substrate, notably observed in the top joints across all lattice types at 5% relative density. At this relative density, dBD-nmax for BCC, FCC, and DC registers 30.8, 6.19, and 10.89 μm, respectively. Notably, dBD-nmax for BCC initially declines and then ascends with increasing relative density. After reaching a minimum of 19.13 μm at 25% relative density, it climbs to 29 μm at 45% relative density. Conversely, dBD-nmax for FCC and DC increases consistently with rising relative density, reaching 19.18 and 16.39 μm, respectively, at 45% relative density.
Figure 15. The maximum building direction residual deformation with the relative density change.
4.3.2. Deformation mechanisms
In terms of building direction deformation, both BCC and FCC exhibit similar behaviours. Across all relative densities, dBD-nmax predominantly occurs at the joint bottom, while dBD-pmax concentrates at the struts’ lower sections for both lattices. Deformation accumulation diminishes as the distance from the substrate increases.
Focusing on detailed analysis, we will elaborate on BCC behaviour. At 5% and 15% relative density in BCC, dBD-nmax surfaces at the bottom of joints E, F, G, and H, while dBD-pmax concentrates at the lower portions of struts AO, BO, CO, and DO. At 5% relative density, the AO, BO, CO, and DO struts exhibit an overall upward bending. By 15% relative density, structural deformation in the struts diminishes, yet intrinsic deformation causes strut contraction. This amalgamation of intrinsic and structural deformation sustains dBD-pmax at the lower sections of AO, BO, CO, and DO struts. This deformation primarily stems from structural deformation, representing SDM. Advancing to 25% relative density, increased resistance to structural deformation prompts a shift to IDM. Struts undergo self-shrinkage, accompanied by joint contraction and downward deformation at their base. Upon surpassing 25% relative density, dBD-nmax localises at the base of joint O, while dBD-pmax appears at the lower segments of struts OE, OF, OG, and OH.
This mechanism unfolds as follows: downward deformation at joints E, F, G, and H triggers a subsequent downward contraction in the struts and joints beneath them, cumulatively inducing a cascading downward deformation along the building direction. Consequently, joint O experiences more significant downward deformation than joints E, F, G, and H. This amplifies the overall downward contraction of struts AO, BO, CO, and DO in contrast to OE, OF, OG, and OH struts. However, this overarching downward deformation gets counteracted by the upward shrinkage of the struts’ lower surfaces. Consequently, with identical strut contraction, dBD-pmax manifests at the lower surface of struts OE, OF, OG, OH. Regarding building direction deformation, the joint fusion phenomenon exhibits minimal influence. Notably, there is no manifestation of JFDM in building direction deformation at higher relative densities.
The building direction deformation in FCC and BCC showcases comparable traits, differing mainly in FCC's excellent structural stability, resulting in a reduced structural deformation. When FCC is at 15% relative density, the transition in building direction deformation from SDM to IDM is notable.
The building direction analysis of DC reveals a more intricate pattern. At lower relative densities, dBD-nmax in DC concentrates at the top joints, with negligible positive deformation across the lattice. This indicates that structural deformation in DC entails solely negative deformation in the building direction. Upon reaching 15% relative density, the transition from SDM to IDM becomes apparent. Post 15% relative density, dBD-nmax shifts to the base of joints at the lattice bottom, while dBD-pmax localises at the base of joints atop the lattice. Intrinsic deformation emerges as the primary deformation source. A visual representation of DC's intrinsic deformation is depicted in the GIF provided in the Appendix. Notably, dBD-p is significantly minor compared to dBD-n and can be disregarded. Both FCC and DC exhibit smaller dBD-nmax compared to BCC. FCC records the smallest dBD-nmax at lower relative densities, while at higher relative densities, DC displays the smallest dBD-nmax.
4.4. Total residual deformation
The distribution of the extracted total residual deformation is depicted in , while the trend of the maximum total residual deformation ds-max concerning relative density is illustrated in .
Figure 16. Total residual deformation distribution at different relevant densities and different lattice types. The red arrow points to the position with the largest residual deformation. (a) BCC, (b) FCC, (c) DC. SDM: structural deformation mode, IDM: intrinsic deformation mode.
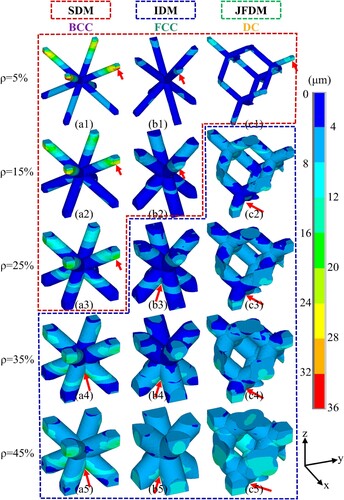
Figure 17. The maximum total residual deformation with the relative density change.
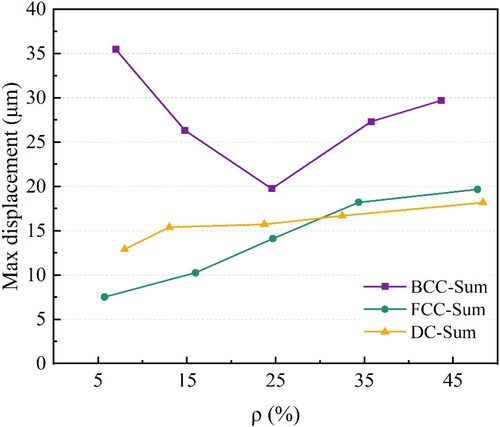
The maximum total residual deformation of the BCC structure first decreases and then increases with the relative density increase. The ds-max starting from its peak of 35.5 μm at 5% relative density, reaching its lowest point at 19.8 μm at 25% relative density, and subsequently ascending to 29.7 μm at 45% relative density. Both the FCC and DC structures exhibit an augmentation in ds-max with increasing relative density. Specifically, the ds-max of the FCC structure escalates from a minimum value of 7.5 μm at 5% relative density to a maximum of 19.7 μm at 45% relative density. Similarly, the DC structure sees an increase from a minimum of 12.9 μm at 5% relative density to a maximum of 18.2 μm at 45% relative density.
Examining reveals that ds-max coincides with dHD-max under lower relative densities, implying that horizontal deformation predominantly influences total deformation at this stage. However, under higher relative densities, ds-max aligns with the location of dBD-nmax, suggesting that building direction deformation governs total deformation at this phase. When horizontal deformation follows SDM, total deformation mirrors this pattern, while the remaining lattices exhibit IDM. Notably, joint fusion does not conspicuously impact total deformation. Comparing the lattices, BCC records larger ds-max values than FCC and DC. At lower relative densities, FCC exhibits the lowest ds-max while at higher relative densities, DC displays the lowest ds-max among the three lattices.
5. Conclusions
The finite element analysis model was developed to explore the residual deformation distribution and mechanism of lattice structures during the LPBF process. The experimental results agree with the simulated results in the case of model verification, only a 14.4% maximum deviation exists. Three distinctive lattice structures, i.e. BCC FCC, and DC with varying relative densities were simulated using this model. The conclusions can be drawn as follows:
The residual deformation during LPBF processing of lattice structures can be categorised into two main types: structural deformation and intrinsic deformation. In lattice dominated by structural deformation, shape distortion usually occurs due to their poor structural stability, leading to the SDM. The lattice dominated by intrinsic deformation usually suffer from shrinkage due to their large cross-sectional area, leading to the IDM. When the relative densities of the lattice are large, lattice structures may exhibit joint fusion phenomena, where the primary shrinkage occurs due to intrinsic deformation within the fused joints, referred to as the JFDM.
The deformation mode shifts from SDM to IDM as the relative density increases. For total deformation, the relative densities of deformation mode shifts from SDM to IDM for the BCC, FCC, and DC structures are 35%, 25%, and 15%, respectively.
At small relative densities, the maximum horizontal residual deformation is at the same level as the maximum building direction residual deformation. In this case, the horizontal deformation dominates the total deformation. When the relative density increases, the building direction deformation will increase significantly and dominate the total deformation.
Both the maximum horizontal residual deformation and the maximum residual deformation in the building direction exhibit an increase with the elevation of relative density for the FCC structure and the DC structure. In contrast, for the BCC structure, the maximum horizontal residual deformation and the maximum residual deformation in the molding direction initially decrease and then subsequently increase with the ascent of relative density. This suggests that, at low relative density, the BCC structure demonstrates inferior structural stability. In the comparison of the maximum residual total deformation of the three structures, the FCC is overall superior.
At small relative densities, the location of the maximum total residual deformation coincides with the location of the horizontally oriented deformation, proving that the total deformation is dominated by the horizontal deformation. In large relative density, the location of the maximum deformation amount is consistent with the location of the building direction negative deformation, proving that the total deformation is dominated by the deformation in the building direction.
The residual deformation pattern from finite element simulation guides pre-compensation methods to improve design and manufacturing consistency. Regarding design and manufacturing, FCC structures are most suitable for LPBF due to superior resistance to residual deformation. Optimal manufacturing relative densities for BCC, FCC, and DC lattices are 25%, 5%, and 5%, respectively, not factoring in weight reduction and mechanical properties. We intend to conduct a detailed analysis of the evolution mechanism of residual stress and the distribution of LPBF-fabricated lattice structures. Additionally, investigating the accumulation behaviour of residual deformation in multi-cell lattice structures is also a worthwhile pursuit.
Disclosure statement
No potential conflict of interest was reported by the author(s).
Data availability statement
The data that support the findings of this study are available from the corresponding author, Linda Ke, upon reasonable request.
Additional information
Funding
References
- Pham M-S, Liu C, Todd I, et al. Damage-tolerant architected materials inspired by crystal microstructure. Nature. 2019;565(7739):305–311. doi:10.1038/s41586-018-0850-3
- Kim SH, Yeon S-M, Lee JH, et al. Additive manufacturing of a shift block via laser powder bed fusion: the simultaneous utilisation of optimised topology and a lattice structure. Virtual Phys Prototyp. 2020;15(4):460–480. doi:10.1080/17452759.2020.1818917
- Shi K, Gu D, Liu H, et al. Process-structure multi-objective inverse optimisation for additive manufacturing of lattice structures using a physics-enhanced data-driven method. Virtual Phys Prototyp. 2023;18(1):e2266641.
- Mahmoud D, Tandel SRS, Yakout M, et al. Enhancement of heat exchanger performance using additive manufacturing of gyroid lattice structures. Int J Adv Manuf Technol. 2023;126(9–10):4021–4036. doi:10.1007/s00170-023-11362-9
- Ku M-H, Ni K, Lin Q-E, et al. Novel laser powder bed fusion corrax maraging stainless steel lattice with superior specific strength and energy absorption. J Mater Res Technol. 2023;25:5240–5248. doi:10.1016/j.jmrt.2023.07.027
- Gu D, Shi X, Poprawe R, et al. Material-structure-performance integrated laser-metal additive manufacturing. Science. 2021;372(6545):eabg1487.
- Tan C, Zou J, Li S, et al. Additive manufacturing of bio-inspired multi-scale hierarchically strengthened lattice structures. Int J Mach Tools Manuf. 2021;167:103764.
- Jin J, Wu S, Yang L, et al. Ni–Ti multicell interlacing gyroid lattice structures with ultra-high hyperelastic response fabricated by laser powder bed fusion. Int J Mach Tools Manuf. 2024;195:104099.
- Bici M, Brischetto S, Campana F, et al. Development of a multifunctional panel for aerospace use through SLM additive manufacturing. Procedia CIRP. 2018;67:215–220. doi:10.1016/j.procir.2017.12.202
- Mantovani S, Campo GA, Giacalone M. Steering column support topology optimization including lattice structure for metal additive manufacturing. Proc Inst Mech Eng C-J Mech Eng Sci. 2020;236(21):10645–10656. doi:10.1177/0954406220947121
- Qi Y, Zhang H, Zhang W, et al. Heat treatment of Al-Cu-Li-Sc-Zr alloy produced by laser powder bed fusion. Mater Charact. 2023;195:112505.
- Liu J, Li Z, Lin D, et al. Eutectic high-entropy alloys and their applications in materials processing engineering: A review. J Mater Sci Technol. 2024;189:211–246. doi:10.1016/j.jmst.2023.10.057
- Lin D, Chen Q, Xi X, et al. Laser powder bed fusion to fabricate high-entropy alloy FeCoCrNiMo0.5 with excellent high-temperature strength and ductility. Mater Sci Eng A. 2024;900:146413.
- Xiao Z, Zhou J, Qi Y, et al. The effect of support structure on residual stress in laser powder bed fusion of Ti6Al4 V alloy. J Mat Res Technol. 2023;27:7927–7934. doi:10.1016/j.jmrt.2023.11.139
- Lin D, Xi X, Ma R, et al. Fabrication of a strong and ductile FeCoCrNiMo0.3 high-entropy alloy with a micro-nano precipitate framework via laser powder bed fusion. Compos Part B-Eng. 2023;266:111006.
- Li X, Chua JW, Yu X, et al. 3D-Printed lattice structures for sound absorption: current progress, mechanisms and models, structural-property relationships, and future outlook. Adv Sci (Weinh). 2024;11(4):e2305232. doi:10.1002/advs.202305232
- Köhnen P, Haase C, Bültmann J, et al. Mechanical properties and deformation behavior of additively manufactured lattice structures of stainless steel. Mater Des. 2018;145:205–217. doi:10.1016/j.matdes.2018.02.062
- Magarò P, Alaimo G, Carraturo M, et al. A novel methodology for the prediction of the stress–strain response of laser powder bed fusion lattice structure based on a multi-scale approach. Mater Sci Eng A. 2023;863. doi:10.1016/j.msea.2022.144526
- Fu J, Ding J, Qu S, et al. Improved light-weighting potential of SS316L triply periodic minimal surface shell lattices by micro laser powder bed fusion. Mater Des. 2022;222:111018.
- Çalışkan Cİ, Khan HM, Ural MM. Hybrid material usage in TPMS forms fabricated by additive manufacturing, comparison of mechanical strength of lattices produced with AlSi10Mg and 7050. Mater Today Commun. 2023;36. doi:10.1016/j.mtcomm.2023.106872
- Rashid R, Masood S, Ruan D, et al. Design optimization and finite element model validation of LPBF-printed lattice-structured beams. Metals-Basel. 2023;13(2):184.
- Cansizoglu O, Harrysson O, Cormier D, et al. Properties of Ti–6Al–4 V non-stochastic lattice structures fabricated via electron beam melting. Mater Sci Eng A. 2008;492(1–2):468–474. doi:10.1016/j.msea.2008.04.002
- Bhuwal AS, Pang Y, Maskery I, et al. Creep characterization of inconel 718 lattice metamaterials manufactured by laser powder bed fusion. Adv Eng Mater. 2023:2300643.
- Yang X, Ma W, Gu W, et al. Multi-scale microstructure high-strength titanium alloy lattice structure manufactured via selective laser melting. RSC Adv. 2021;11(37):22734–22743. doi:10.1039/D1RA02355A
- De Biasi R, Murchio S, Sbettega E, et al. Efficient optimization framework for L-PBF fatigue enhanced Ti6Al4 V lattice component. Mater Des. 2023;230. doi:10.1016/j.matdes.2023.111975
- Gatto ML, Cerqueni G, Groppo R, et al. Improved biomechanical behavior of 316L graded scaffolds for bone tissue regeneration produced by laser powder bed fusion. J Mech Behav Biomed Mater. 2023;144. doi:10.1016/j.jmbbm.2023.105989
- Bregoli C, Fiocchi J, Biffi CA, et al. Additively manufactured medical bone screws: an initial study to investigate the impact of lattice-based voronoi structure on implant primary stability. Rapid Prototyp J. 2023;30(1):60–72.
- Gao M, He D, Wu X, et al. Design, preparation, and mechanical property investigation of Ti–Ta 3D-auxetic structure by laser powder bed fusion. Adv Eng Mater. 2023;25(16):2300242.
- Wang Y, Wang L, Liu D, et al. Mechanisms of processing map difference between laser powder bed fusion of Mg solid cubes and lattice structures. Addit Manuf. 2023;76. doi:10.1016/j.addma.2023.103773
- Liu H, Gu D, Qi J, et al. Dimensional effect and mechanical performance of node-strengthened hybrid lattice structure fabricated by laser powder bed fusion. Virtual Phys Prototyp. 2023;18(1):e2240306.
- Mishra AK, Chavan H, Kumar A. Effect of cell size and wall thickness on the compression performance of triply periodic minimal surface based AlSi10Mg lattice structures. Thin-Walled Struct. 2023;193. doi:10.1016/j.tws.2023.111214
- Günther F, Pilz S, Hirsch F, et al. Experimental and numerical characterization of imperfect additively manufactured lattices based on triply periodic minimal surfaces. Mater Des. 2023;233. doi:10.1016/j.matdes.2023.112197
- Hussain S, Alagha AN, Haidemenopoulos GN, et al. Microstructural and surface analysis of NiTi TPMS lattice sections fabricated by laser powder bed fusion. J Manuf Process. 2023;102:375–386. doi:10.1016/j.jmapro.2023.07.055
- Guaglione F, Caprio L, Previtali B, et al. Single point exposure LPBF for the production of biodegradable Zn-alloy lattice structures. Addit Manuf. 2021;48. doi:10.1016/j.addma.2021.102426
- Noronha J, Qian M, Leary M, et al. Manufacturability of Ti-6Al-4 V hollow-walled lattice struts by laser powder bed fusion. Jom. 2021;73(12):4199–4208. doi:10.1007/s11837-021-04914-5
- Emanuelli L, Biasi RD, Plessis Ad, et al. Metrological characterization of porosity graded β-Ti21S triply periodic minimal surface cellular structure manufactured by laser powder bed fusion. Int J Bioprinting. 2023;9(4):729.
- Wu S, Yang L, Chen P, et al. Performance optimization of Si/SiC ceramic triply periodic minimal surface structures via laser powder bed fusion. J Am Ceram Soc. 2023;106(12):7419–7439. doi:10.1111/jace.19397
- Ding J, Qu S, Zhang L, et al. Geometric deviation and compensation for thin-walled shell lattice structures fabricated by high precision laser powder bed fusion. Addit Manuf. 2022;58. doi:10.1016/j.addma.2022.103061
- Tan C, Li S, Essa K, et al. Laser powder bed fusion of Ti-rich TiNi lattice structures: process optimisation, geometrical integrity, and phase transformations. Int J Mach Tools Manuf. 2019;141:19–29. doi:10.1016/j.ijmachtools.2019.04.002
- Zaeh MF, Branner G. Investigations on residual stresses and deformations in selective laser melting. Prod Eng. 2009;4(1):35–45. doi:10.1007/s11740-009-0192-y
- Ahmed M, Atta G. Dimensional quality and distortion analysis of thin-walled alloy parts of AlSi10Mg manufactured by selective laser melting. J Manuf Mater Proc. 2019;3(2). doi:10.3390/jmmp3020051
- Jayanath S, Achuthan A. A computationally efficient hybrid model for simulating the additive manufacturing process of metals. Int J Mech Sci. 2019;160:255–269. doi:10.1016/j.ijmecsci.2019.06.007
- Liang X, Dong W, Hinnebusch S, et al. Inherent strain homogenization for fast residual deformation simulation of thin-walled lattice support structures built by laser powder bed fusion additive manufacturing. Addit Manuf. 2020;32. doi:10.1016/j.addma.2020.101091
- Calignano F. Design optimization of supports for overhanging structures in aluminum and titanium alloys by selective laser melting. Mater Des. 2014;64:203–213. doi:10.1016/j.matdes.2014.07.043
- Tian W, Li Q, Wang Q, et al. Additive manufacturing error quantification on stability of composite sandwich plates with lattice-cores through machine learning technique. Compos Struct. 2024;327. doi:10.1016/j.compstruct.2023.117645
- Wang Y, Chen C, Qi Y, et al. Residual stress reduction and surface quality improvement of dual-laser powder bed fusion. Addit Manuf. 2023;71:103565.
- Loh LE, Chua CK, Yeong WY, et al. Numerical investigation and an effective modelling on the selective laser melting (SLM) process with aluminium alloy 6061. Int J Heat Mass Transfer. 2015;80:288–300. doi:10.1016/j.ijheatmasstransfer.2014.09.014
- Li YL, Gu DD. Parametric analysis of thermal behavior during selective laser melting additive manufacturing of aluminum alloy powder. Mater Des. 2014;63:856–867. doi:10.1016/j.matdes.2014.07.006
- Matsumoto M, Shiomi M, Osakada K, et al. Finite element analysis of single layer forming on metallic powder bed in rapid prototyping by selective laser processing. Int J Mach Tools Manuf. 2002;42(1):61–67. doi:10.1016/S0890-6955(01)00093-1
- Nickel AH, Barnett DM, Prinz FB. Thermal stresses and deposition patterns in layered manufacturing. Mat Sci Eng a-Struct. 2001;317(1–2):59–64. doi:10.1016/S0921-5093(01)01179-0
- Parry LA, Ashcroft IA, Wildman RD. Geometrical effects on residual stress in selective laser melting. Addit Manuf. 2019;25:166–175. doi:10.1016/j.addma.2018.09.026
- Li Z, Xu R, Zhang Z, et al. The influence of scan length on fabricating thin-walled components in selective laser melting. Int J Mach Tools Manuf. 2018;126:1–12. doi:10.1016/j.ijmachtools.2017.11.012
- Yang YP, Jamshidinia M, Boulware P, et al. Prediction of microstructure, residual stress, and deformation in laser powder bed fusion process. Comput Mech. 2017;61(5):599–615. doi:10.1007/s00466-017-1528-7
- Li C, Liu JF, Fang XY, et al. Efficient predictive model of part distortion and residual stress in selective laser melting. Addit Manuf. 2017;17:157–168. doi:10.1016/j.addma.2017.08.014
- Roberts IA, Wang CJ, Esterlein R, et al. A three-dimensional finite element analysis of the temperature field during laser melting of metal powders in additive layer manufacturing. Int J Mach Tools Manuf. 2009;49(12–13):916–923. doi:10.1016/j.ijmachtools.2009.07.004
- Hu YL, Lin X, Li YL, et al. Effect of heat treatment on the microstructural evolution and mechanical properties of GH4099 additive-manufactured by directed energy deposition. J Alloys Compd. 2019;800:163–173. doi:10.1016/j.jallcom.2019.05.348
- An K, Yuan L, Dial L, et al. Neutron residual stress measurement and numerical modeling in a curved thin-walled structure by laser powder bed fusion additive manufacturing. Mater Des. 2017;135:122–132. doi:10.1016/j.matdes.2017.09.018
- Chen C, Yin J, Zhu H, et al. The effect of process parameters on the residual stress of selective laser melted inconel 718 thin-walled part. Rapid Prototyp J. 2019;25(8):1359–1369. doi:10.1108/RPJ-09-2018-0249
- Hussein A, Hao L, Yan C, et al. Finite element simulation of the temperature and stress fields in single layers built without-support in selective laser melting. Mater Des (1980–2015). 2013;52:638–647. doi:10.1016/j.matdes.2013.05.070
- Chakrabarty J. Applied plasticity. New York: Springer; 2000.
- Li Y, Zhou K, Tan P, et al. Modeling temperature and residual stress fields in selective laser melting. Int J Mech Sci. 2018;136:24–35. doi:10.1016/j.ijmecsci.2017.12.001
- Yin J, Zhu H, Ke L, et al. A finite element model of thermal evolution in laser micro sintering. Int J Adv Manuf Technol. 2015;83(9–12):1847–1859. doi:10.1007/s00170-015-7609-x
- Parry L, Ashcroft IA, Wildman RD. Understanding the effect of laser scan strategy on residual stress in selective laser melting through thermo-mechanical simulation. Addit Manuf. 2016;12:1–15. doi:10.1016/j.addma.2016.05.014
- Yilbas BS, Arif AFM. Material response to thermal loading due to short pulse laser heating. Int J Heat Mass Transfer. 2001;44(20):3787–3798. doi:10.1016/S0017-9310(01)00026-6
- Li C, Fu CH, Guo YB, et al. A multiscale modeling approach for fast prediction of part distortion in selective laser melting. J Mater Process Technol. 2016;229:703–712. doi:10.1016/j.jmatprotec.2015.10.022
- Chen C, Chang S, Zhu J, et al. Residual stress of typical parts in laser powder bed fusion. J Manuf Process. 2020;59:621–628. doi:10.1016/j.jmapro.2020.10.009
- Changpeng C, Zhu H, Xiao Z, et al. The residual stress distribution of Ti-6Al-4 V thin wall in the selective laser melting. IOP Conf Ser: Mater Sci Eng. 2019;538:012020. doi:10.1088/1757-899X/538/1/012020
- Chang K, Ma L, Li P, et al. Effect of heat treatment on microstructure and mechanical properties of GH4099 superalloy fabricated by selective laser melting. J Alloys Compd. 2023;934. doi:10.1016/j.jallcom.2022.167813
- C.f.t.C.A.M. Handbook. Beijing: CHINA AERONAUTICAL MATERIALS HANDBOOK; 2001.
- Yagi S, Kunii D. Studies on effective thermal conductivities in packed beds. Chem Eng. 1954;18(12):576–585. doi:10.1252/kakoronbunshu1953.18.576
- Chen C, Yin J, Zhu H, et al. Effect of overlap rate and pattern on residual stress in selective laser melting. Int J Mach Tools Manuf. 2019;145. doi:10.1016/j.ijmachtools.2019.103433
- Mills KC. Recommended values of thermophysical properties for selected commercial alloys. Cambridge: Woodhead Publishing; 2002.
- Gu D, He B. Finite element simulation and experimental investigation of residual stresses in selective laser melted Ti–Ni shape memory alloy. Comput Mater Sci. 2016;117:221–232. doi:10.1016/j.commatsci.2016.01.044
- Aboulkhair NT, Simonelli M, Parry L, et al. 3D printing of aluminium alloys: additive manufacturing of aluminium alloys using selective laser melting. Prog Mater Sci. 2019;106. doi:10.1016/j.pmatsci.2019.100578
- Qi Y, Zhang H, Zhu J, et al. Mechanical behavior and microstructure evolution of Al-Cu-Mg alloy produced by laser powder bed fusion: effect of heat treatment. Mater Charact. 2020;165:110364.
- Ahmed N, Barsoum I, Abu Al-Rub RK. Numerical investigation of residual stresses in thin-walled additively manufactured structures from selective laser melting. Heliyon. 2023;9(9):e19385.