
 ?Mathematical formulae have been encoded as MathML and are displayed in this HTML version using MathJax in order to improve their display. Uncheck the box to turn MathJax off. This feature requires Javascript. Click on a formula to zoom.
ABSTRACT
Laser powder bed fusion is considered to be an effective method for forming high-precision NiTi alloys. NiTi alloys formed from Ti-rich or low-Ni content NiTi powders as raw materials exhibit shape memory or trained to be superelastic at room temperature. To fabricate super-elastic NiTi alloys without training, it is often to increase the Ni content of the powder. However, Ni-rich NiTi powders are highly susceptible to cracking during fabrication. Therefore, this study has conducted a systematic investigation and proposed a corresponding process optimisation strategy. The results show that cracking is the result of the combined effect from residual thermal stresses and microstructure during the printing process. The melt pool morphology influenced by the thermal history as well as elemental evaporation determines the direction of crack formation and propagation. We have successfully fabricated room-temperature super-elastic NiTi samples without cracking using high laser power and high scanning speed.
1. Introduction
The high reactivity and toughness of super-elastic NiTi alloys pose challenges in forming complex structures with high precision. In recent years, laser powder bed fusion (LPBF) has become the best choice for moulding NiTi alloys due to its rapid solidification and high accuracy [Citation1, Citation2].
However, there are still some challenges in fabricating NiTi alloys using the LPBF process, especially in fabricating super-elastic NiTi alloys. Dadbakhsh et al. [Citation3] speculated that the laser thermal stress during LPBF processing induces the phase transformation of austenite and promotes the formation of martensite, making it difficult to achieve superelasticity. Lu et al. [Citation4] indicated that the manufacturing problem was caused by the Ni elemental evaporation during LPBF processing. For every 0.5 at.% decrease in the Ni content of the matrix, the austenite transition end temperature increases by 45°C [Citation5, Citation6]. When the Ni content in the matrix is low, NiTi alloys exhibit shape memory rather than superelasticity at room temperature [Citation7, Citation8]. Therefore, when using LPBF to fabricate super-elastic NiTi alloys, it is often to use Ni-rich NiTi powders that contain more than 50% Ni [Citation9].
In recent years, there are successful cases where super-elastic NiTi alloys have been fabricated [Citation1, Citation10, Citation11]. Despite these early successes, problems remain for fabricating super-elastic NiTi using LPBF. The NiTi alloys fabricated in these cases did not have excellent superelasticity when fabricated, but only after several training cycles. One of the motivations of using LPBF is to produce complexly designed super-elastic structures, so any subsequent training cycles are not preferable. Therefore, how to produce NiTi alloys with excellent superelasticity while maintaining high precision is crucial for the development of super-elastic NiTi alloys. In order to fabricate super-elastic NiTi alloys without training, this means minimising Ni element burnout, maintaining high grain orientation and reducing martensite formation. However, we have found a very narrow window of process parameters for fabricating crack-free super-elastic NiTi alloys using Ni-rich NiTi powders [Citation12]. We also found that cracking during fabrication exists even at the same energy density using different laser powers. As well, Zhang et al. [Citation13] found that Ni-rich NiTi powders are more prone to warping and cracking during fabrication. Therefore, Zhang et al. innovatively used a machine learning method to investigate the process window but did not give a reasonable explanation for the mechanism of cracking during NiTi alloy fabrication. Xue et al. [Citation14] also studied the forming process of Ni-rich powders fabricated NiTi alloys and attributed the cracking to the Ni elemental content as well as excessive residual stresses. However, it should be noted that the process parameters are affecting the Ni element, residual stresses and the microstructure [Citation15]. The morphology of the microstructure will also have an effect on the cracking of the alloy [Citation16]. However, there are many studies on cracking due to residual thermal stresses [Citation17, Citation18], while there are not enough studies on Ni elemental burnout in NiTi alloys and microstructure effect on cracking. Therefore, it is crucial to investigate the cracking of NiTi alloys by process parameters considering the three factors in order to fabricate NiTi alloys with excellent superelasticity.
To comprehensively investigate the issue of cracking during the fabrication of Ni-rich super-elastic NiTi alloys, this work adopts an approach that combines experimental investigation and computational modelling. The goal is to unveil the concealed link between process parameters, resulting microstructure and crack propagation. In the simulation section, the thermal effects of the process parameters on the printing process are analysed by using a macroscopic thermal field on factors such as melt pool size and thermal history. In the experimental stages, the phase transition behaviour was investigated by X-ray diffraction (XRD) combined with differential scanning calorimetry (DSC). Finally, the microstructures of Ni-rich NiTi alloys fabricated by LPBF were systematically analysed using optical microscopy (OM), scanning electron microscopy (SEM) coupled with energy dispersive spectrometer (EDS) and electron backscatter diffraction (EBSD). The insights gained from this research are valuable for the optimal fabrication of Ni-rich NiTi through LPBF, thereby aiding in broadening the applications of super-elastic NiTi alloys.
2. Experimental and computational methods
2.1. Characterisation of Ni-rich NiTi alloy powder
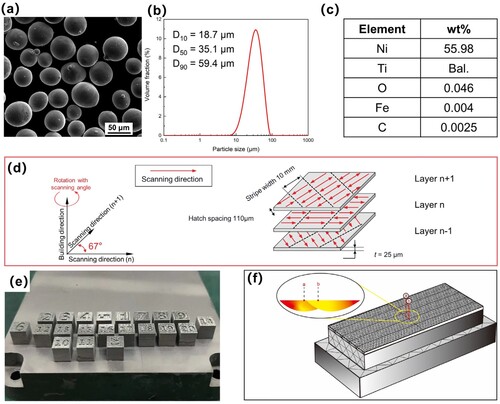
The powder used in this study was pre-alloyed and provided by Advanced Materials Manufacturing Technology Co., Ltd. (a) shows the SEM image of the powder morphology. The powder shows an ideal spherical shape and smooth surface, which fulfill the requirements of particle morphology for LPBF processing. (b) shows the result of particle size analysis using a laser particle size analyzer (BT-9300S). It can be observed that the particle size of the powder ranges from about 18–60 μm, with a D50 value of 35.1 μm. (c) shows the elemental composition of the powder measured using Inductively Coupled Plasma-Optical Emission Spectroscopy (ICP-OES) and elemental analyzer. The weight percentages were converted to atomic percentages of Ni50.91Ti49.09 (at.%).
Figure 1. Fabrication process of LPBF NiTi samples and simulation modelling. (a) SEM image of the powder; (b) particle size distribution of the powder used in this paper; (c) elemental content of the powder used in this paper; (d) laser scanning strategy used in this paper; (e) sample image after forming; and (f) diagram of the model used to study the thermal history of LPBF NiTi alloy.
2.2 Sample fabrication and experimental characterisation
2.2.1. Fabrication of single-track sample
LPBF is a cyclic process with rapid heating and rapid cooling. To understand the influence of process parameters on melt pool morphology, which critically impacts chemical metallurgical reactions, grain growth and phase transitions during the melting and solidification of metal powder – it is essential to quantify the thermal gradient and temperature field during the LPBF process. In order to accurately simulate the characteristics of LPBF process, realistic heat source mode and distributions need to be used. Therefore, in order to establish a clear correlation between process parameters and melt pool morphology, single-track experiments were conducted. In this case, single-track samples (the same as cubic specimens described below) were fabricated using an FS121M printer from Hunan Farsoon High-Technology Co., Ltd. Due to the sensitivity of nickel and titanium to oxygen, the whole fabrication process was conducted under a protective atmosphere of argon gas to keep the oxygen content below 100 ppm. The laser power used for the single-track were 120, 140, 160, 180, 200 W. The scanning speeds were 200, 400, 600, 800, 1000 mm/s. The thickness of the powder layer was 25 µm. After fabrication, single-tracks with some deposition layers were cut using electrical discharge machining (EDM) to obtain a cross-section of the fabricated single-tracks. Each single-track, produced under a different combination of parameters, underwent melt pool morphology examination. The samples were etched using an acidic solution of 82.7%H2O + 14.1%HNO3 + 3.2%HF. Finally, all single-track samples were observed using an optical microscope (OM).
2.2.2. Fabrication of cubic sample
(d) shows the partitioned laser scanning strategy used in this study. The aim is to reduce the thermal stresses and minimise the risk of cracking during the melting process. The black dotted line in the figure represents the 10 mm interval between the two zones. The red arrows represent the laser scanning paths. The hatch spacing (h) adopted was 110 μm. After finishing each layer, the laser scanning direction was rotated 67° to minimise the accumulation of thermal stresses. In this study, laser power (P) and scanning speed (v) were chosen as control variables while maintaining the remaining parameters constant. The powder deposition thickness (t) was set to 25 μm. The process parameters were systematically planned and are detailed in . The volumetric energy density (Ev) can be calculated using Equation:
(1)
(1) As shown in (e), the cubes with dimensions of 8 × 8 × 8 mm3 were fabricated. The cut was made through the middle of the samples and the cross-section (parallel to the direction of building) was characterised. The micro-morphology of the samples was observed using a FEINOVA 400 field emission SEM and elemental analyses were carried out using its X-MaxN EDS module. The samples were electrolytically polished in a solution of 6%HClO4 + 94%CH3OH at 25°C and analysed by XRD and EBSD. The XRD scans were conducted at a scanning speed of 2°/min and a scanning range of 30°−90°. The EBSD analysis was performed using a JEOL JSM-7800F field emission scanning electron microscope with a scanning step size of 0.2 μm. The phase transition behaviour was characterised using differential scanning calorimetry (DSC) in a Mettler-Toledo DSC3 + calorimeter. The cooling/heating rate was set at 10 K min−1, ranging from 193.15 K to 373.15 K.
Table 1. Detailed numerical values of parameters planned from the process window.
2.2.3. Super-elastic behaviour test
This experiment was conducted in compressive loading mode of the mechanical testing machine from MTS systems. The superelasticity test was performed at room temperature (25°C). The samples were initially loaded to 2% strain and then unloaded back to zero stress. Subsequent loadings were done in 1% strain increments per turn. The loading strain rate was 10–3/s and the unloading strain rate was also 10–3/s.
2.3. Computational methods
NiTi alloys are more sensitive to temperature and strain than many other metal materials. Therefore, the complex thermal history of NiTi alloys fabricated by LPBF has more obvious effects on the moulding quality and performance of NiTi alloys [Citation19]. By studying the thermodynamic model of LPBF, it helps to understand the evolutionary behaviour of NiTi alloys under cyclic thermal history. For the finite element model, COMSOL Multiphysics (6.1) software was used for the calculations. The LPBF process is a localised heat melting process. The local temperature is determined by the laser heat source (Q) and the rest of the zone is a typical nonlinear transient heat transfer process. Therefore, the internal heat variation can be expressed as:
(2)
(2) In this study, the Goldak model was used as a volumetric laser heat source. The Goldak heat source Q can be expressed by the double ellipsoid equation [Citation20]. Q is expressed as:
(3)
(3)
(4)
(4) Considering the temperature fluctuation at the beginning of the thermodynamic model and the calculation time, a finite element geometric model was established. The probe was inserted at the centre displacement of the melt pool as well as at the melt pool overlap. The model sketch is shown in (f).
3. Results
3.1. Melt pool morphology of single-track sample
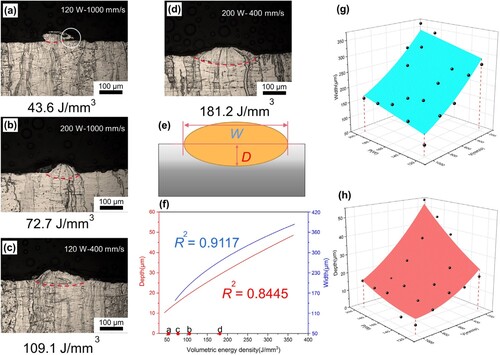
In this experiment, single-track samples were fabricated using a fixed 25 μm powder layer thickness (t) in order to investigate the quality and morphology of the molten pool produced by different combinations of laser power (P) and scanning speed (v). depicts the melt pool morphology and corresponding fitting curves of single-track samples under different Ev. As illustrated in (a), the laser with low Ev cannot completely melt the powder. It shows inhomogeneity and discontinuity on the substrate, showing a lack of fusion phenomenon. As the Ev rises, the powder gradually melts and the single-track morphology becomes more complete and more continuous (as shown in (b,c)). When the Ev is high, the single-track is no longer full due to the recoil pressure of the laser and the vaporisation of the powder (as shown in (d)). A surface analysis has been conducted by measuring the depth of the melt pool (d) and the width of the melt pool (w) (as shown in (e)). As shown in (f), it can be noticed that d and w increase with increasing Ev. In addition, it can be noticed through (g) and (h) that P has a greater effect on the molten pool morphology at the same Ev.
Figure 2. OM images of melt pool morphology of single-track samples with different process parameters and fitting curves of the melt pool. (a–d) the surface morphology of single track samples at 120 W–1000 mm/s, 120 W–400 mm/s, 200 W–1000 mm/s and 200 W–400 mm/s; (e) the fitting curve of the energy density with the depth and width of the melt pool; (f) the relationship between the laser power, scanning speed and the width of the melt pool; (g) the relationship between the laser power, scanning speed and the depth of the melt pool.
3.2. Cracking morphology of cubic sample
Based on the surface morphology of single-track samples, the Ev value close to the point b in (f) was chosen for the fabrication of cubic sample. The effect of process parameters on cracking was analysed by measuring the crack length of cube samples (as shown in (a)). The response surface between P, v and crack length was plotted using the response surface methodology (RSM) (as shown in (b)). (b) shows that the cube sample is highly sensitive to cracking as v increases at a lower P value. As P increases, the samples exhibit a wider range of printable processes.
Figure 3. Crack morphology of samples, and metallographic images of samples corresponding to the process window. (a) 150 W–500 mm/s sample graph; (b) sample process window indexed by crack length; (c) metallographic images of each sample.
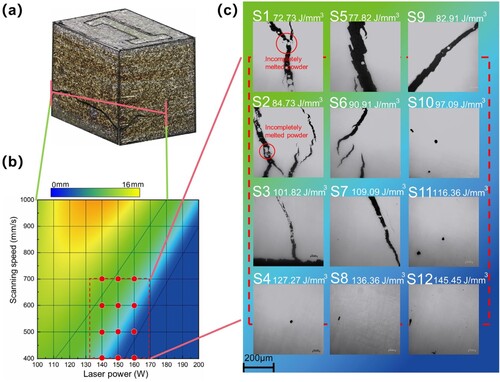
Subsequently, segmentation was carried out along the direction parallel to the building direction by using electrical discharge machining (EDM). The OM images of the segmented cross-section under different process parameters are depicted in (c). It is obvious that incompletely melted powder can be observed in S1 and S2 samples. It can be inferred that the powder is difficult to be melted completely at low P and high v due to the low Ev. As the Ev increases, the presence of incompletely melted powder at the cracks gradually decreases as shown in S6 and S7 samples. However, the further increase of Ev leads to the formation of spherical holes as shown in S10 and S11 samples, which may be caused by trapped vapour due to heat accumulation at relatively high Ev. Consequently, it can be observed that there are more selectable v parameters available for the fabrication of uncracked samples with increasing P, indicating that it is easier to fabricate crack-free NiTi samples with higher P.
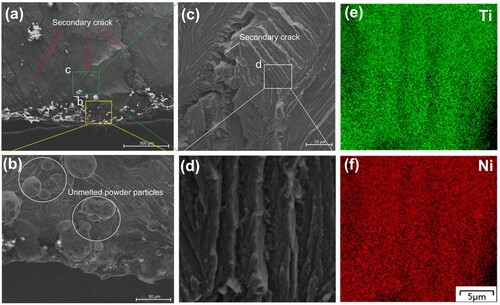
To gain more meaningful insights into cracking, S7 with the least amount of cracking was selected for further investigation. The fracture morphology of S7 was observed by SEM in order to study the fracture characteristics of the LPBFed NiTi alloys. The fracture morphology of S7 ((a)) shows that the crack originates from the side of the sample. Surface defects will cause stress concentrations subsequently leading to crack initiation. gives the SEM images and EDS results of S7 sample at the crack. As shown in (a,b), the micro-morphology of each small fracture surface is similar to the cleavage fracture of crystals, exhibiting similar river patterns. However, distinctive features, such as the presence of tear ridges ((d)), differentiate it from typical cleavage fractures, indicating a quasi-cleavage fracture. According to the EDS analysis of the torn ridge ((e,f)), there is no significant segregation phenomenon as well as precipitation phases, and the darker areas maybe caused by the uneven crack surface. In addition, there is a little spherical powder at the cracks ((b)), which may have flown into the crack after the crack initiation. It is suspected that crack initiation with the high temperature caused the powder to partially melt and adhere to the cracks. Meanwhile, the secondary cracks can be observed as shown in (c). It is speculated here that the cyclic thermal stresses may have led to stress concentration at the crack tip, resulting in secondary cracking.
Figure 4. SEM images and EDS results of S7 sample at the crack. (a) SEM image of S7 sample at the crack; (b) morphology of incompletely melted powder particles; (c) SEM morphology of the river patterns crack; (d) SEM morphology of the tear ridge; (e,f) EDS results at the tear ridge.
3.3. Phase formation and transformation behaviour of LPBFed NiTi alloy
The DSC curves for cooling and heating processes are presented in (a,b). (a) shows a distinct phase transition peak, indicating the reversibility of phase transformation in the sample. By drawing the tangent line from the phase transformation peak to the baseline and determining the point of intersection, the characteristic temperatures of phase transformation can be determined, including martensitic start temperature (Ms), martensitic finish temperature (Mf), austenite start temperature (As) and austenite finish temperature (Af). The characteristic temperatures are extracted and the relationship curves are plotted as shown in (b). Observing the relation curves, it can be clearly found that the temperature of the phase transformation characteristic increases gradually with the increase of Ev. In addition, the Ms of all specimens are below room temperature (25°C), indicating that all samples demonstrated superelasticity at room temperature. The lack of Ms and Mf for S1 in (b) is due to the low temperature that cannot be measured.
Figure 5. Transformation behaviour and phase formation of LPBFed NiTi alloy. (a) DSC curves of different samples; (b) variation curves of transformation temperature for each sample; (c) XRD curves of different samples; (d) peak deviation phenomenon for different scanning speeds at 140 W; (e) peak deviation of S4, S7 and S10; (f) histogram of ICP results.
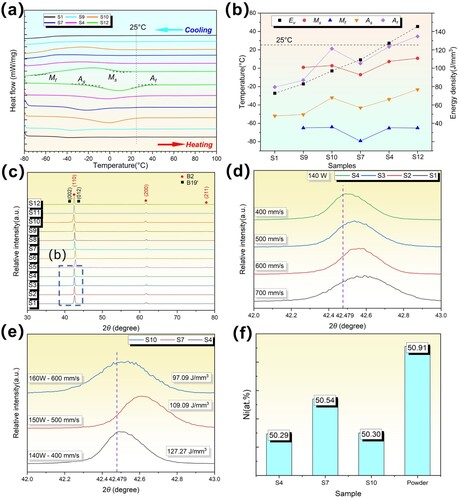
XRD measurements of the samples were conducted at 25°C along the direction parallel to the building direction. The measurement results are shown in (c–f). As shown in (c), no secondary phases such as Ni3Ti, Ti2Ni and Ni4Ti3 were detected compared to previously reported LPBFed NiTi components [Citation21, Citation22]. On the one hand, this is due to the inhibitory effect of the extremely fast cooling rate on the precipitation of the secondary phase during the LPBF process. On the other hand, it is due to the extremely low volume fraction of the second phase, which cannot be distinguished by XRD compared to the volume fractions of the B2 and B19′ phases. In addition, no significant B19’ phase peaks were observed, indicating the predominance of the B2 phase within the sample. The comparison shows that the Ev does not change the crystal plane type, but slightly changes the position and intensity of the corresponding diffraction peaks. (d) is a localised enlargement of the (110) diffraction peak for 2θ at 42–43°. The purple dashed line shows the (110) diffraction peak of the PDF card #65-4572 for equiatomic NiTi. It can be observed that the diffraction peak significantly shifts to the right with increasing v at the same power. According to Bragg’s formula, the shift of the diffraction peak to the right indicates the cell parameters decrease. This may be related to the burnout of Ni element in the LPBFed NiTi alloy as well as thermal stresses. According to [Citation18, Citation23], the highest stress should be in S10 sample with a more pronounced right shift of the peak. However, this is not the case in reality, so it can be hypothesised that the larger difference may be caused by the Ni element. Since the Ni-rich NiTi alloy was used in this paper, the radius of Ni atoms (124 pm) is smaller than the radius of Ti atoms (147 pm), so the diffraction peaks should be shifted to the right. The more obvious the diffraction peaks shifts to the right, the more Ni atoms exist in the alloy. The XRD results of S4, S7 and S10 are individually plotted in (e). The elemental composition of titanium and nickel in the samples was measured using ICP, and the experimental results are shown in (f). Similar conclusions can be drawn. Among the samples, S7 exhibited the least loss of Ni, while S4 showed the highest loss of Ni. However, the variation in peak shift (indicating Ni-loss) did not show a linear relationship with the increase in Ev. Therefore, the use of Ev alone does not clearly explain the extent of peak deviation (Ni-loss).
3.4. Comparison of microstructure between crack and non-crack regions
shows the EBSD images of S4, S7 and S10 taken on the XOZ plane. By observing the overall morphology of the melt pool, it can be noticed that different processes lead to different microstructures. As shown in (a–c), finer columnar crystals are present in the centre region of the melt pool, while coarser columnar crystals are present in the overlapping region. This may be caused by the competing growth of columnar crystals during the growth process [Citation24]. And since the melt pool boundary is affected by remelting, the grains tend to grow towards the centre of the new melt pool after resolidification. Consequently, the growth direction of grains has been changed, thereby resulting in the coarser columnar crystal.
Figure 6. Microscopic observations along the XOZ plane of the samples. (a–c) Inverse pole figure (IPF-BD) plots of S4, S7 and S10, respectively (white dashed lines represent the melt pool boundaries and the white area in the IPF diagram is the B19’ phase); (d–f) phase distribution plots of S4, S7 and S10, respectively (inset in the upper left corner indicates the content of the B2 phase and the B19’ phase); (g) IPF plots of the S7 crack tip; (h) phase distribution of the S7 crack tip; (i) the KAM map of the S7 crack tip.
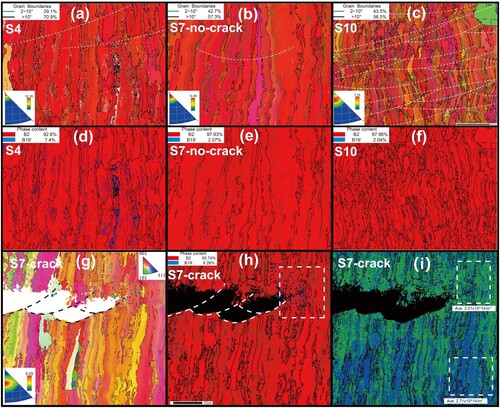
(a–c) shows the IPF-BD plots for the three samples. The IPF-BD plots of all samples show typical LPBFed NiTi alloy features with a strong <001>//BD texture. The texture intensity of S4 is the highest at 32.28, while that of S10 is the lowest at 7.79. This may be due to the higher scanning speed which leads to rapid cooling (vS10 (600/s) > vS4 (400 mm/s)), thus limiting the time for optimal grain orientation. Furthermore, since S10 used the highest P, it would produce a larger molten pool than S4. As a result, the direction of heat exchange between the molten pool surface and the external environment would be more selectively oriented. This may affect the orientation of the grains as they grow towards the reverse temperature gradient, thereby reducing the orientation strength.
(d–f) illustrates the phase distribution of the three samples. It can be noticed that the B19’ phase is present in all samples, but the content is not the same. In S4, the most B19’ phase is present, while the least B19’ phase is present in S10. On the one hand, it can be attributed to the microstructure differences under different processes. On the other hand, it can be attributed to the differences in thermal stresses of the samples under different processes.
(g–i) shows the morphology of the S7 crack tip. (g) shows the IPF map of the S7 crack tip. Differences in orientation can be observed from the uncracked region in (b). The texture strength decreases from 14.86 to 5.05 in the cracked region compared to the uncracked region, potentially attributed to crack tip stress that alters the crystal orientation by inducing crystal kinking. In (h), it can be observed that the crack, as shown by the white dotted line, extends the melt pool cracking. In addition, it can be found that a phase transition had occurred at the crack edge (Supplementary Material S1). It can be noticed that the content of B19’ phase (6.26%) at the crack tip is much larger than that at other locations (2.07%). This suggests that the martensitic phase transformation has occurred at the crack tip. In addition, comparing the KAM map in (i), it can be found that a large number of dislocations exist around the crack compared to other locations. This also suggests that the crack undergone a large amount of deformation before cracking.
3.5. Super-elastic properties
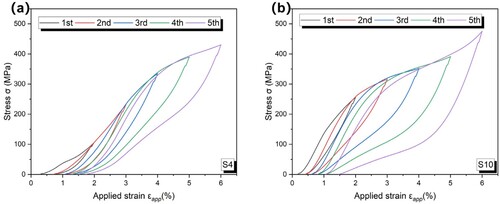
shows the cyclic compressive stress–strain curves for samples S4 and S10 at different strains ranging from 2% to 6%. Although both samples exhibited superelasticity at room temperature, significant differences were observed after cyclic loading. The maximum stresses during cycling of the two samples were notably different. Sample S10 exhibited a higher maximum stress than sample S4 during each cycling process. Furthermore, the irreversible deformation occurred in both cycling processes. As the cycling increased, sample S10 exhibited higher critical phase transition stresses and smaller residual strains. It should be noted that the higher the Ni content, the stronger the orientation (001), and the lower the martensite content of the samples, the better the superelasticity of the samples. The main difference between sample S4 and sample S10 is the martensite content within the sample. More martensite is present within the S4 sample (as shown in (d)). As a result, sample S4 requires less critical stress during compression and may have occurred in the martensite orientation.
Figure 7. The cyclic compressive stress-strain curves for samples S4 and S10 at different strains ranging from 2% to 6%.
4. Discussion
4.1. Evolution of thermal history in different process windows
The melt pool morphology of the single-track sample was characterised to verify the model accuracy. Comparing the results of the model and the actual melt pool morphology characterisation (presented in ), it can be found that the width (w) and the depth of the melt pool (d) are similar to the real monorail conditions, providing a qualitative explanation for the related phenomena. The accuracy of the w is higher, while the accuracy of the melt d is slightly worse. This discrepancy may be attributed to that the powder layer was not treated more accurately during the modelling process. In addition, as shown in (a–c), it can be found that the melt pool size is positively correlated with Ev. However, the peak temperature is not directly related to Ev, but only positively correlated with P.
Figure 8. Simulation of melt pool morphology at different process parameters and thermal history at different locations on multiple tracks at different process parameters. (a–c) Topography of the simulated molten pools; (d) thermal history evolution curves at the melt pool centre; (e) thermal history evolution curves at the lap location of the melt pool; (f) enlarged peak temperatures under different process windows.
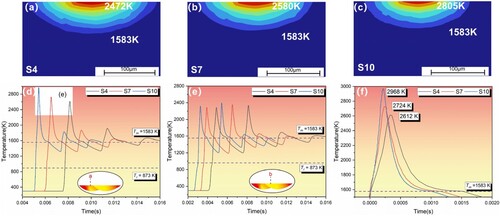
Table 2. Melting pool characterisation of samples.
To obtain the thermal history of the melt pool, the model was extended to a multitrack model, and a probe was placed at the lap of two melt pools and at the centre of the melt pool. (d–f) demonstrate the thermal history curves of S4, S7 and S10. (d) represents the thermal history profile in the centre region of the melt pools and (e) represents the thermal history profile in the lap region. Upon observing the peak temperatures of the different process parameters, it is evident that the temperatures exceed the melting temperature of the NiTi alloy (Tm = 1583 K). It indicates that these parameters are sufficient to enable the molten pools to lap onto each other. By plotting the temperatures above Tm (as shown in (f)), it can be noticed that the peak temperature of S4 (140 W–400 mm/s) is much smaller than that of S10 (160 W–600 mm/s). It also shows the effect of P on the peak temperature. On the other hand, comparing (e, f), it can be seen that the thermal history of centre region of the melt pool is different from that of the overlap region as described in other articles [Citation25, Citation26]. It is not that the powder was melted once in the centre of the laser operation and twice in the overlapping areas. Instead, the powder was melted multiple times in both the centre and overlap regions of the laser operation. This is related to the defocused laser spot used in this paper (136 μm). This induces a more homogeneous grain orientation inside the melt pool, enhancing the superelasticity of the NiTi alloy [Citation27, Citation28]. And it also minimises the heterogeneity of the overlap area.
The rapid cooling rate during the laser scanning process results in substantial temperature gradients within the sample, which can contribute to the development of thermal stresses, potentially leading to the formation of cracks and warping [Citation29]. According to [Citation18, Citation29], the residual thermal stress is closely related to the peak temperature. The S10 samples with the largest peak temperatures exhibit the largest residual thermal stresses. On the contrary, the S4 sample has the smallest residual thermal stress. However, the S10, which was subjected to the greatest thermal stress, did not crack, indicating that thermal stress is not the only factor in forming the cracking of NiTi alloys.
4.2. Effect of microstructure on cracking in different process windows
As shown in (a–c), the samples with low Ev values do not have the finest grains as described in previous articles [Citation30]. Moreover, the samples with high Ev values have the finest grains. This seems to contradict previous conclusions that the heat-affected zone promotes grain growth. This phenomenon can be examined from two perspectives. On the one hand, it is related to the melt pool morphology [Citation31]. Comparing the melt pool width and melt pool depth of the three samples (as shown in ), it can be found that S4 (10.7) has the smallest width-to-depth ratio (W/D) and S7 (11.09) has the largest. A larger W/D value corresponds to a flatter melt pool shape with reduced curvature at the edge, leading to less significant competitive grain growth. As a result, the grains can grow freely and show a vertical growth pattern. After epitaxial growth, it is more likely that elongated columnar crystals will form inside the melt pool. This will form more regular columnar crystals with larger grain aspect ratios (as shown in (b2–c2)). A smaller W/D ratio leads to a greater curvature of the melt pool. After epitaxial growth, the grains will be more likely to form curved irregular columnar crystals with finer grain aspect ratios (as shown in (a2)). This could reduce the anisotropy of the columnar crystals, improve the properties of the columnar crystals and reduce the possibility of cracking in NiTi alloys [Citation32, Citation33]. On the other hand, according to (f), as Ev increases, W increases and W/D decreases. Since the scanning spacing is fixed and smaller than W, neighbouring grains will melt and fuse with each other to form larger-sized columnar crystals as Ev increases. Therefore, it can be inferred that the grain size increases, then decreases and increases again with the increase of Ev. In addition, due to the fusion of neighbouring grains, the length and width of the columnar crystals increase, and the grain aspect ratio decreases (Supplementary Material S2). Despite the increase in grain size, the decrease in grain aspect ratio reduces anisotropy, enhances properties and reduces the probability of cracking.
Figure 9. Grain distribution and dislocation distribution in the XOZ plane of the samples. (a1–c1) grain size distribution of S4, S7 and S10; (a2–c2) grain aspect ratio distribution of S4, S7 and S10; (a3–c3) dislocation density distribution of S4, S7 and S10.
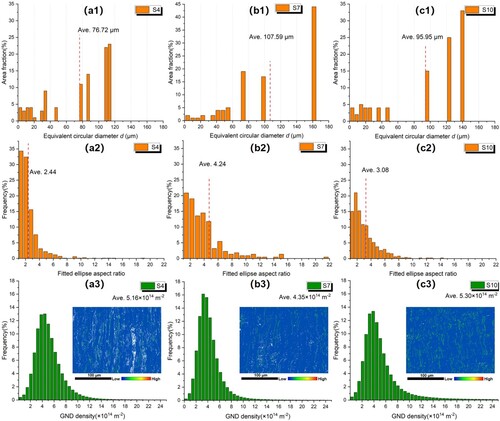
The statistical analysis of dislocation density also reveals differences in melt pool morphology. Specifically, the centre region of the melt pool is characterised by a fine-grained structure with higher dislocation intensity. Meanwhile, the overlapping region has more coarse grain size and fewer dislocations. The statistical results show that S10 and S4 have higher dislocation density, while S7 has lower dislocation density (as shown in (a3–c3)). This also indicates that S4 and S10 possess more fine grains. It is well known that grain size has a significant effect on the properties of metals [Citation34, Citation35]. Based on the analysis of the source of cracks in section 4.1, it is known that the cracks initiate at high temperatures. Comparing the grain statistics in (a–c), it can be found that no cracks appeared in S10 and S4, which have a more uniform distribution of coarse and fine grains, while cracks appeared in S7, which contains more coarse grains. This observation underscores the significance of grain refinement in the LPBFed super-elastic NiTi alloys.
It is widely recognised that the thermal history of the melt pool significantly influences composition during the LPBF process [Citation36]. This is due to the vaporisation of the metal inside the molten pool during the LPBF process [Citation37, Citation38]. The change in the composition ratio of Ni and Ti elements can in turn impact the performances of NiTi alloy. The formation energy of the Ni-rich B2 phase is lower than that of the equiatomic B2 phase, while the formation energy of the Ni-rich B19’ phase is higher than that of the equiatomic B19’ phase [Citation39, Citation40]. Therefore, Ni-rich NiTi alloys would prefer to form the B2 phase. The Ni-rich B2 phase, exhibits a more stable energy state than the B2 phase of equiatomic NiTi. Accordingly, it requires a higher energy (Egap) to induce the austenite to martensite phase transition [Citation41].
(5)
(5) This reduces the ability of NiTi alloys to resist crack propagation.
As a consequence, the Ni element would be lost by evaporation during the LPBF process. Elemental evaporation principally occurs at the surface of the molten pool. The losses can be expressed in terms of elemental evaporation Δmi. Δmi can be obtained from the following equation:
(6)
(6) where As represents the evaporated surface area of the melt pool, tm represents the melt pool action time step and Ji represents the rate of evaporation of the metal under laser light in the LPBF process for alloying element i. According to Langmuir evaporation model [Citation42], Ji can be described as:
(7)
(7) where R (J/mol K) represents the universal gas constant,
(g/mol) represents the molecular weight of element i, T (K) is the temperature at which the laser interacts with the material, β is an error factor to account for condensation and A, B, C and D are elemental coefficients [Citation43].
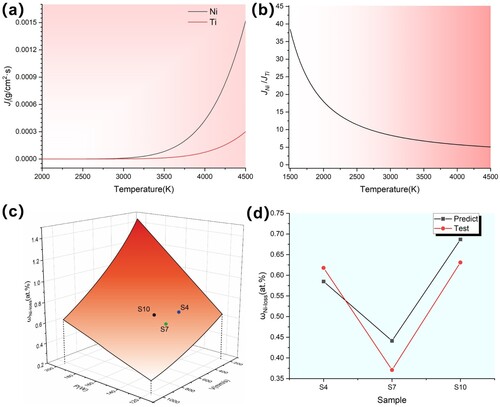
By plotting the evaporation rate curves for the elements Ni and Ti (shown in (a)), it can be found that the JNi is much larger than JTi. As the temperature increases, the JNi/JTi becomes smaller and smaller (as shown in (b)). Therefore, Ni is preferentially evaporated over Ti in the same melt pool, which in turn leads to a change in the Ni/Ti ratio. Moreover, EquationEq. 6(6)
(6) also shows that besides Ji, As and tm also affect the final elemental evaporation. As is positively correlated with the size of the molten pool during the LPBF process. tm is positively correlated with the presence time of the liquid molten pool during the LPBF process and negatively correlated with the v. Therefore, an approximate function for the loss of Ni elements per unit time can be obtained:
(8)
(8) where k is the normalisation factor. Therefore, the relationship surface between P, v and Ni losses can be obtained (as shown in (c)). It can be observed that as the Ev increases, the increasing values of As and tm result in higher Ni losses. However, Ev cannot be used as the only criterion. When the difference in Ev is not significant, the effect of P is much greater. This means that NiTi alloys fabricated with high P and high v lose much more Ni than NiTi alloys fabricated with low P and low v. This is also consistent with the results measured by ICP (as shown in (d)). It can also be noticed from Equation (8) that the effect due to laser power is more significant compared to scanning speed. Higher laser power leads to larger surface area of the formed molten pool, higher peak temperature and higher evaporation rate. It is worth noting that there are discrepancies between the predicted and tested results. These errors can be attributed to the splashing of the melt pool due to recoil pressure as well as due to measurement errors in the melt pool morphology.
Figure 10. Elemental loss temperature curves and Ni-loss for each sample. (a) evaporation rate curves of Ni element and Ti element at different temperatures; (b) loss ratio curves of Ni element and Ti element at different temperatures; (c) loss surfaces of Ni element at different process parameters; (d) plots of actual loss of Ni element at different process parameters.
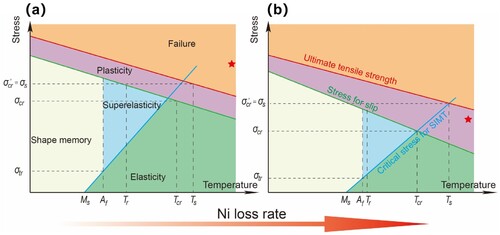
With increasing Ni losses, Ni-rich NiTi alloys gradually transform into equiatomic NiTi alloys. Further Ni losses can lead to the transformation of equiatomic NiTi alloys into Ti-rich NiTi alloys, promoting the formation of the B19’ phase in NiTi alloy. As the temperature increases, the critical stress of the phase transition increases according to the Clausius–Clapeyron type relationship, while the yield strength of the NiTi alloy decreases [Citation44]. Thus, the schematic diagram of can be obtained. On the one hand, as shown in (a,b), the reduction in Ni content improves the toughness of NiTi alloy and reduces its brittleness [Citation41, Citation45]. This leads to the fact that the Ti-rich NiTi alloys are more likely to keep the thermal stresses within the plastic deformation range at the same thermal strain. This allows NiTi to absorb more energy during deformation and exhibits a lower tendency for crack initiation during fracture. On the other hand, the loss of Ni reduces the energy requirement during stress-induced phase transformation. During the transformation of austenite to martensite, a faster phase transformation of austenite is induced. The drop induces a phase transformation of the B2 phase at the crack tip to form the B19’ band. This contributes to a faster reduction in stress concentration and a lower tendency to crack propagation under the critical phase transformation temperature (Tcr).
Figure 11. Schematic curve of the effect of Ni element loss on the properties of NiTi alloys. The star represents the stress condition at the same strain (Supplementary Material S3).
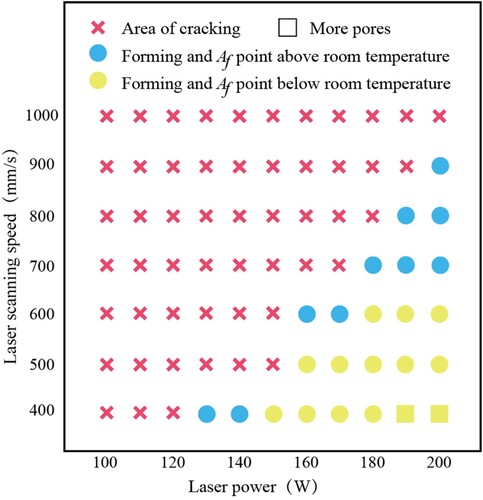
As a result, crack-free NiTi alloys are easier to fabricate as the evaporation of elemental Ni increases (Supplementary Material S4), as shown in the process window map of this paper (as shown in ). This also suggests that the Ev required for producing crack-free super-elastic NiTi alloys decrease as P increases. This is consistent with the conclusions we reached earlier [Citation46]. It is also important to note that excessive loss of Ni can lead to the disappearance of superelasticity. Therefore, it is recommended that NiTi alloy powders with high Ni content be used for processing using process parameters of high laser power and high scanning speed. In this paper, excellent super-elastic NiTi alloy without training was successfully fabricated using 200 W–900 mm/s (Supplementary Material S5).
Figure 12. Printable process window map.
4.3. Direction of crack propagation
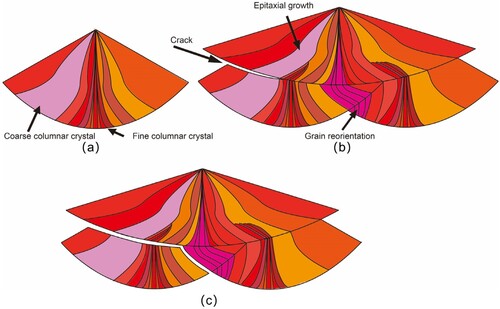
In the LPBF melt pool, it is observed (as shown in ) that grains grow along the direction of the temperature gradient of the melt pool. This means that the boundaries of the melt pool grow towards the centreline (hottest point) of the melt pool. With the subsequent melting and solidification of the powder layer, the grains at the lap of the molten pool will epitaxially grow thicker columnar crystals in the direction of the high-temperature gradient under the effect of remelting [Citation47](as shown in (a,b)). Similarly, the region of competing growth, in the middle of the melt pool, shows finer epitaxially grown columnar crystals. Despite previous work showing that the 67° rotational scanning can disrupt the vertically ordered growth direction of the original columnar crystals or reduce the length of the columnar crystals [Citation48, Citation49]. However, it is still evident that the columnar crystal growth is obvious in (c). The brittle contact surfaces of the columnar crystals, as well as the pronounced anisotropy, result in a significant decrease in strength, plasticity and toughness along the transverse direction of the columnar crystals. This increases the susceptibility to thermal cracking [Citation50]. Consequently, it is evident that the crack propagates along the edge of the melt pool at the tip of the crack (as shown in (g–i)). As illustrated in (b,c), the crack spreads through the interlayer and gradually compromises the coarse columnar crystals. In addition, dislocation densities at fine grain densities can produce dislocation plugging, leading to the formation of sub-granular boundaries. It will change the direction of crack spreading [Citation51]. Therefore, when the crack spreads to the fine columnar crystals developed by epitaxial growth, it transforms to spreading by the fine columnar crystal growth boundary.
Figure 13. Schematic of crack extension evolution after the molten pool undergoes lapping. (a) schematic of grain growth inside the molten pool for a single-track; (b) schematic of crack interlayer expansion after the molten pool undergoes lapping; (c) schematic of downward crack expansion.
In conclusion, the fabrication of NiTi alloys using LPBF is a simple and convenient method. However, the susceptibility of the structural heterogeneity generated by the process to cracking still needs to be investigated. To address this issue, the authors believe that novel process strategies may be required for the fabrication of super-elastic NiTi alloys. Remelting may be a viable option that satisfies the above-proposed set of metrics for fabricating crack-free super-elastic NiTi. This proposal is what we are working on [Citation12].
5. Conclusions
In summary, this work highlights the potential factors that need to be considered when attempting to address the cracking of NiTi alloys during LPBF. On the basis of residual thermal stress-induced cracking, we have analysed the rules of Ni elemental and microstructural effects on cracking. The major discoveries are as follows:
In the LPBFed super-elastic NiTi alloys, the formation of crack originates from incompletely melted powder caused by insufficient energy density and the quasi-cleavage fracture of the NiTi alloy induced by high residual thermal stresses.
Higher laser power leads to more Ni evaporation, which reduces the elastic constants of the crystals and the critical stress of the phase transition, making the material tougher and less prone to cracking. The higher the laser power, the lower the energy density required to fabricate crack-free super-elastic NiTi alloys.
The smaller the grains and the smaller the aspect ratio of the crystal, then the weaker the anisotropy of the grains and the lower the possibility of cracking.
As the energy density increases, more Ni is lost due to the larger surface area for the molten pool evaporation and the prolonged action of the molten pool. In addition, even at the same energy density, using higher power results in a greater loss of Ni due to a larger evaporation area and extended activity of the melt pool.
Thermal history at different locations during manufacturing leads to differences between crystals. Cracks extend through coarse columnar crystals between layers, while the propagation to fine columnar crystals transforms into cross-layer propagation.
CRediT authorship contribution statement
Kun Li: Investigation, Methodology, Supervision, Writing-original draft, Writing-review & editing, Funding acquisition; Ruijin Ma: Investigation, Methodology, Writing-original draft & editing; Jianbin Zhan: Investigation, Writing-review & editing; Jinzhou Wu: Writing-review & editing; Jiahui Fang: Investigation, Writing-review & editing; Shengqian Wang: Investigation, Writing-review & editing; Qiuju Yang: Writing-review & editing; Na Gong: Investigation, Methodology, Writing-review & editing; Lawrence E. Murr: Investigation, Methodology, Writing-review & editing; Huajun Cao: Investigation, Methodology, Supervision, Writing-review & editing.
Declaration of competing interest
The authors declare that they have no known competing financial interests or personal relationships that could have appeared to influence the work reported in this paper.
Supplemental Material
Download MS Word (772.5 KB)Data availability statement
The data that support the findings of this study are available from the corresponding author, [KL], upon reasonable request.
Acknowledgements
The authors gratefully acknowledge all the researchers and labs to provide the experimental facilities.
Disclosure statement
No potential conflict of interest was reported by the author(s).
Additional information
Funding
References
- Wang X, Yu J, Liu J, et al. Effect of process parameters on the phase transformation behavior and tensile properties of NiTi shape memory alloys fabricated by selective laser melting. Addit Manuf. 2020;36:101545. doi:10.1016/j.addma.2020.101545
- Saedi S, Shayesteh Moghaddam N, Amerinatanzi A, et al. On the effects of selective laser melting process parameters on microstructure and thermomechanical response of Ni-rich NiTi. Acta Mater. 2018;144:552–560. doi:10.1016/j.actamat.2017.10.072
- Dadbakhsh S, Speirs M, Van Humbeeck J, et al. Laser additive manufacturing of bulk and porous shape-memory NiTi alloys: from processes to potential biomedical applications. MRS Bull. 2016;41(10):765–774. doi:10.1557/mrs.2016.209
- Lu HZ, Ma HW, Cai WS, et al. Altered phase transformation behaviors and enhanced bending shape memory property of NiTi shape memory alloy via selective laser melting. J Mater Process Technol. 2022;303:117546. doi:10.1016/j.jmatprotec.2022.117546
- Frenzel J, Wieczorek A, Opahle I, et al. On the effect of alloy composition on martensite start temperatures and latent heats in Ni–Ti-based shape memory alloys. Acta Mater. 2015;90:213–231. doi:10.1016/j.actamat.2015.02.029
- Pelton AR, Russell SM, DiCello J. The physical metallurgy of nitinol for medical applications. JOM. 2003;55(5):33–37. doi:10.1007/s11837-003-0243-3
- Bormann T, Müller B, Schinhammer M, et al. Microstructure of selective laser melted nickel–titanium. Mater Charact. 2014;94:189–202. doi:10.1016/j.matchar.2014.05.017
- Wang X, Speirs M, Kustov S, et al. Selective laser melting produced layer-structured NiTi shape memory alloys with high damping properties and Elinvar effect. Scr Mater. 2018;146:246–250. doi:10.1016/j.scriptamat.2017.11.047
- Zeng Z, Cong BQ, Oliveira JP, et al. Wire and arc additive manufacturing of a Ni-rich NiTi shape memory alloy: Microstructure and Mechanical Properties. Addit Manuf. 2020;32:101051. doi:10.1016/j.addma.2020.101051
- Lu HZ, Ma HW, Yang Y, et al. Tailoring phase transformation behavior, microstructure, and superelasticity of NiTi shape memory alloys by specific change of laser power in selective laser melting. Mater Sci Eng A. 2023;864:144576. doi:10.1016/j.msea.2022.144576
- Qu S, Wang L, Ding J, et al. Superelastic NiTi functional components by high-precision laser powder bed fusion process: the critical roles of energy density and minimal feature size. Micromach-Basel. 2023;14(7). doi:10.3390/mi14071436
- Zhan J, Wu J, Ma R, et al. Tuning the functional properties by laser powder bed fusion with partitioned repetitive laser scanning: toward editable 4D printing of NiTi alloys. J Manuf Process. 2023;101:1468–1481. doi:10.1016/j.jmapro.2023.07.009
- Zhang C, Xue L, Atli KC, et al. On the fabrication of defect-free nickel-rich nickel–titanium parts using laser powder bed fusion. J Manuf Sci Eng. 2022;144(9). doi:10.1115/1.4054935
- Xue L, Atli KC, Zhang C, et al. Laser powder bed fusion of defect-free NiTi shape memory alloy parts with superior tensile superelasticity. Acta Mater. 2022;229:117781. doi:10.1016/j.actamat.2022.117781
- Mirkoohi E, Dobbs JR, Liang SY. Analytical mechanics modeling of in-process thermal stress distribution in metal additive manufacturing. J Manuf Process. 2020;58:41–54. doi:10.1016/j.jmapro.2020.08.009
- Zhou Z, Huang L, Shang Y, et al. Causes analysis on cracks in nickel-based single crystal superalloy fabricated by laser powder deposition additive manufacturing. Mater Des. 2018;160:1238–1249. doi:10.1016/j.matdes.2018.10.042
- Hu J, Hu Y, Lan C, et al. Cracking mechanism and control of Hastelloy X prepared by laser powder bed fusion. J Mater Res Technol. 2022;21:3526–3547. doi:10.1016/j.jmrt.2022.10.164
- Lu X, Zhang W, Chiumenti M, et al. Crack-free laser powder bed fusion by substrate design. Addit Manuf. 2022;59:103149. doi:10.1016/j.addma.2022.103149
- Leuders S, Thöne M, Riemer A, et al. On the mechanical behaviour of titanium alloy TiAl6V4 manufactured by selective laser melting: fatigue resistance and crack growth performance. Int J Fatigue. 2013;48:300–307. doi:10.1016/j.ijfatigue.2012.11.011
- Goldak J, Chakravarti A, Bibby M. A new finite element model for welding heat sources. Metall Trans B. 1984;15(2):299–305. doi:10.1007/BF02667333
- Fu J, Hu Z, Song X, et al. Micro selective laser melting of NiTi shape memory alloy: defects, microstructures and thermal/mechanical properties. Opt Laser Technol. 2020;131:106374. doi:10.1016/j.optlastec.2020.106374
- Oliveira JP, Cavaleiro AJ, Schell N, et al. Effects of laser processing on the transformation characteristics of NiTi: a contribute to additive manufacturing. Scr Mater 2018;152:122–126. doi:10.1016/j.scriptamat.2018.04.024
- Saxena S, Sharma R, Kumar A. A microscale study of thermal field and stresses during processing of Ti6Al4V powder layer by selective laser melting. Lasers Manuf Mater Process. 2018;5(4):335–365. doi:10.1007/s40516-018-0070-6
- Trempa M, Reimann C, Friedrich J, et al. Mono-crystalline growth in directional solidification of silicon with different orientation and splitting of seed crystals. J Cryst Growth. 2012;351(1):131–140. doi:10.1016/j.jcrysgro.2012.04.035
- Dong A, Du D, Toursangsaraki M, et al. Overlap ratio and scanning strategy effects on laser powder bed fusion Ti6Al4V: numerical thermal modeling and experiments. Int J Adv Manuf Technol. 2023;125(7-8):3053–3067. doi:10.1007/s00170-023-10900-9
- Trejos-Taborda J, Reyes-Osorio L, Garza C, et al. Finite element modeling of melt pool dynamics in laser powder bed fusion of 316L stainless steel. Int J Adv Manuf Technol. 2022;120(5-6):3947–3961. doi:10.1007/s00170-022-09029-y
- Zhu J-N, Liu K, Riemslag T, et al. Achieving superelasticity in additively manufactured Ni-lean NiTi by crystallographic design. Mater Des. 2023;230:111949. doi:10.1016/j.matdes.2023.111949
- Shi G, Li L, Yu Z, et al. Effect of crystallographic anisotropy on phase transformation and tribological properties of Ni-rich NiTi shape memory alloy fabricated by LPBF. Opt Laser Technol. 2023;157:108731. doi:10.1016/j.optlastec.2022.108731
- Gu D, He B. Finite element simulation and experimental investigation of residual stresses in selective laser melted Ti–Ni shape memory alloy. Comput Mater Sci. 2016;117:221–232. doi:10.1016/j.commatsci.2016.01.044
- Gokcekaya O, Hayashi N, Ishimoto T, et al. Crystallographic orientation control of pure chromium via laser powder bed fusion and improved high temperature oxidation resistance. Addit Manuf. 2020;36:101624. doi:10.1016/j.addma.2020.101624
- Kruth JP, Levy G, Klocke F, et al. Consolidation phenomena in laser and powder-bed based layered manufacturing. CIRP Ann. 2007;56(2):730–759. doi:10.1016/j.cirp.2007.10.004
- Becker TH, Kumar P, Ramamurty U. Fracture and fatigue in additively manufactured metals. Acta Mater. 2021;219:117240. doi:10.1016/j.actamat.2021.117240
- Yuan D, Shao S, Guo C, et al. Grain refining of Ti-6Al-4 V alloy fabricated by laser and wire additive manufacturing assisted with ultrasonic vibration. Ultrason Sonochem. 2021;73:105472. doi:10.1016/j.ultsonch.2021.105472
- Song X, Liaw PK, Wei Z, et al. Evolution of the microstructures, magnetic and mechanical behaviors of Co47.5Fe28.5Ni19Si3.4Al1.6 high-entropy alloy fabricated by laser powder bed fusion. Addit Manuf. 2023;71:103593. doi:10.1016/j.addma.2023.103593
- Xiong Z, Li Z, Sun Z, et al. Selective laser melting of NiTi alloy with superior tensile property and shape memory effect. J Mater Sci Technol. 2019;35(10):2238–2242. doi:10.1016/j.jmst.2019.05.015
- Bormann T, Schumacher R, Müller B, et al. Tailoring selective laser melting process parameters for NiTi implants. J Mater Eng Perform. 2012;21(12):2519–2524. doi:10.1007/s11665-012-0318-9
- Speirs M, Wang X, Van Baelen S, et al. On the transformation behavior of NiTi shape-memory alloy produced by SLM. Superelasticity. 2016;2(4):310–316. doi:10.1007/s40830-016-0083-y
- Sam J, Franco B, Ma J, et al. Tensile actuation response of additively manufactured nickel-titanium shape memory alloys. Scr Mater. 2018;146:164–168. doi:10.1016/j.scriptamat.2017.11.013
- Frenzel J, George EP, Dlouhy A, et al. Influence of Ni on martensitic phase transformations in NiTi shape memory alloys. Acta Mater. 2010;58(9):3444–3458. doi:10.1016/j.actamat.2010.02.019
- Tang W, Sundman B, Sandström R, et al. New modelling of the B2 phase and its associated martensitic transformation in the Ti–Ni system. Acta Mater. 1999;47(12):3457–3468. doi:10.1016/S1359-6454(99)00193-7
- Otsuka K, Ren X. Physical metallurgy of Ti–Ni-based shape memory alloys. Prog Mater Sci. 2005;50(5):511–678. doi:10.1016/j.pmatsci.2004.10.001
- Klassen A, Forster VE, Körner C. A multi-component evaporation model for beam melting processes. Simul Mater Sci Eng. 2017;25(2). doi:10.1088/1361-651X/aa5289
- Alcock CB, Itkin VP, Horrigan MK. Vapour pressure equations for the metallic elements: 298–2500K. Metall Q. 1984;23(3):309–313. doi:10.1179/cmq.1984.23.3.309
- Wang X, Yao X, Schryvers D, et al. Anomalous stress-strain behavior of NiTi shape memory alloy close to the border of superelastic window. Scr Mater. 2021;204:114135. doi:10.1016/j.scriptamat.2021.114135
- Qin G. Effect of Ni content on the properties of NiTi shape memory alloys. Shanghai Steel Res. 1984;05:23–27+22.
- Zhan J, Wu J, Ma R, et al. Effect of microstructure on the superelasticity of high-relative-density Ni-rich NiTi alloys fabricated by laser powder bed fusion. J Mater Process Technol. 2023;317:117988. doi:10.1016/j.jmatprotec.2023.117988
- Zhang J, Song B, Wei Q, et al. A review of selective laser melting of aluminum alloys: processing, microstructure, property and developing trends. J Mater Sci Technol. 2019;35(2):270–284. doi:10.1016/j.jmst.2018.09.004
- Nadammal N, Mishurova T, Fritsch T, et al. Critical role of scan strategies on the development of microstructure, texture, and residual stresses during laser powder bed fusion additive manufacturing. Addit Manuf. 2021;38:101792. doi:10.1016/j.addma.2020.101792
- Attard B, Cruchley S, Beetz C, et al. Microstructural control during laser powder fusion to create graded microstructure Ni-superalloy components. Addit Manuf. 2020;36:101432. doi:10.1016/j.addma.2020.101432
- Kotadia HR, Gibbons G, Das A, et al. A review of Laser Powder Bed Fusion Additive Manufacturing of aluminium alloys: microstructure and properties. Addit Manuf. 2021;46:102155. doi:10.1016/j.addma.2021.102155
- Lu D, Lin B, Liu T, et al. Effect of grain structure on fatigue crack propagation behavior of Al-Cu-Li alloys. J Mater Sci Technol. 2023;148:75–89. doi:10.1016/j.jmst.2022.10.085