
 ?Mathematical formulae have been encoded as MathML and are displayed in this HTML version using MathJax in order to improve their display. Uncheck the box to turn MathJax off. This feature requires Javascript. Click on a formula to zoom.
ABSTRACT
The inherent manufacturing defects in laser powder bed fusion (LPBF)-processed samples leads to deviations from results of finite element analysis (FEA) using the designed model. To systematically evaluate process-induced defects and elucidate their effect, a novel methodology, combining statistical analysis, precision computed tomography (CT) characterisation techniques, mechanical properties assessments and FEA, has been developed. Compared to designed models, CT reconstructed models consider defects, which may affect mechanical properties evaluation, especially along the building direction. FEA based on the CT reconstructed model can more accurately display the stress distribution and the anisotropy of samples. Results indicate that mechanical properties correlate with geometric structure and building direction. Anisotropy becomes more pronounced at a strut diameter of 1.0 mm, the universal anisotropic index AU can reach to 6.31. Overall, this method improves predictive ability by elucidating structure–property relationships in LPBF-processed lattice structures, offering insights into the efficient design for LPBF-processed lattice structures with desirable mechanical properties.
1. Introduction
The lightweight design of components has been an eternal topic in the aerospace field, which holds the potential to significantly enhance the manoeuvrability of both aircraft and spacecraft, while concurrently yielding substantial reductions in material consumption and fuel expenditures during navigation. However, the evolving imperative for components that combine lightweight characteristics with functionality has presented an increasingly challenge for conventional lightweight structures. Metallic lattice structures have emerged as a compelling solution. Because metal lattice structures are renowned for their excellent specific strength and stiffness, they offer commendable energy absorption capabilities [Citation1–4]. Metal lattice structures also possess superior thermal, acoustic and electromagnetic properties, rendering them a highly effective platform for the integration of structural and functional elements [Citation5–7]. Notwithstanding their immense potential, the industrial utilisation of metallic lattice structures remained circumscribed by many challenges associated with extended process durations, diminished forming precision and difficulty in integrated forming that exist in traditional manufacturing processes [Citation8–11].
Laser powder bed fusion (LPBF) technology, characterised by layer-by-layer material deposition, has become a transformative methodology to these prevailing constraints. It is intrinsic high-forming flexibility facilitates the precise and integrated fabrication of intricate metallic lattice structures [Citation12,Citation13]. Nevertheless, inherent manufacturing defects in LPBF-processed lattice structures result in deviations from the ideal designed parameters, consequently exerting a discernible impact on the deformation characteristics and mechanical properties of these structures [Citation14]. In addition, the effective elastic properties of LPBF-fabricated lattice structures have become an important indicator for evaluating their mechanical properties. Currently, most studies on the evaluation of the effective elastic modulus of lattice structures are based on the designed models with geometric symmetry [Citation15–17], but due to the geometric defects introduced during the LPBF process, the as-fabricated samples exhibit significant geometric deviations from the designed models. As a result, the calculation of elastic modulus based on this symmetric geometric model may lead to significant deviations between simulation results and experimental results. While previous studies have explored the mechanical properties of LPBF-processed lattices, the combined effect of process-induced defects on the overall performance remains underexplored.
LPBF-processed lattice structures contain two categories of defects: material defects and geometric defects [Citation18,Citation19]. Material defects include undesirable inhomogeneities, anisotropy, voids and cracks within the samples, while geometric defects encompass variations in strut thickness, irregular strut cross-sections, strut waviness, missing struts and nodes, node slag hanging and surface roughness [Citation20]. Extensive researches have focused on exploring the formation mechanisms and elimination methods of defects in printed materials through process optimisation and post-processing [Citation21–25], while defects in processed lattices are relatively understudied. The superposition principle of molten pools inherent to LPBF and the intricate geometry of lattice structures mean imperfections cannot be fully eliminated. Research is therefore vital to understand how they influence the mechanical properties of LPBF-processed lattice structures under different conditions. Most researches usually study either structural or process parameters on the forming quality of lattices in isolation based on electron microscopy and mechanical testing [Citation26–30]. However, the complex interplay between the two is often overlooked, which may be the key to improving prediction accuracy of lattice mechanics. Orthogonal experimental design (OED) with analysis of variance (ANOVA) provides a quantitative and interpretable approach to identify the sensitivity of each parameter to lattice mechanics and determine optimal preparation parameters.
The complex shape of lattice structures has posed challenges for capturing and analysing their surface feature, which makes it difficult for conventional methods to accurately and comprehensively characterise geometric defects. Computed tomography (CT) technology serves as an effective non-destructive tool for detecting them. The application of CT data to finite element analysis (FEA) models enables more accurate predictions of the macroscopic and microscopic mechanical behaviour of lattice structures. For example, Liu et al. [Citation31] used CT scanning images to extract and statistically quantify the positions, shapes and distributions of different geometric defects on individual struts, and generated numerical models of statistically representative lattices with imperfect geometry. Gorguluarslan et al. [Citation32] reconstructed high-resolution FEA models of individual struts from the micro-CT scan images of lattice structures. The uncertainties were quantified with parametric distributions and propagated from the strut level to the lattice structure level. Such studies have utilised optimised FEA models, enhancing the prediction accuracy of mechanical properties of lattice structures. However, current approaches typically focus on single cells or struts, with the shapes and dimensions of a few struts representing the whole lattice structure [Citation31–35], compromising data integrity and prediction accuracy. Characterising and analysing defects across the entire lattice structure, and directly simulating mechanical properties using FEA, can provide more valuable insights.
This study presents a novel methodology integrating statistical analysis, precision characterisation, mechanical properties assessments and FEA to accurately predict lattice mechanics and elucidate the impacts of defect (). An OED with ANOVA systematically explored the relationship between process parameters, geometry and mechanical properties. Then, the formability of LPBF-processed lattice structures with different strut diameters was assessed using CT characterisation technology. Uniaxial compression experiment was employed to test the elastic modulus, compressive yield strength and deformation behaviours. The compressive elastic response and failure mechanism of lattice structures were further predicted and analysed by FEA. Based on this, the anisotropic elastic properties were further calculated and analysed, revealing the influence of geometric defects on the mechanical properties of lattice structures. Additionally, the spatial elastic tensor of the lattice structure was derived from a single sample, obviating the need to fabricate multiple samples for mechanical performance testing across varied orientations.
Figure 1. An overview of the proposed workflow.
2. Materials and methods
2.1. Design strategy of lattice structures
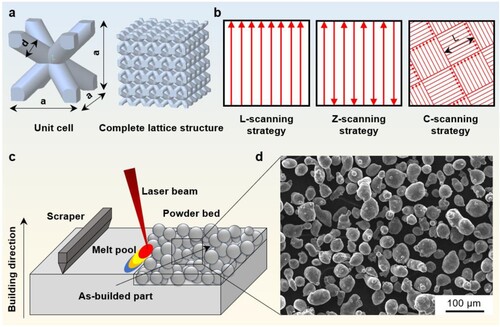
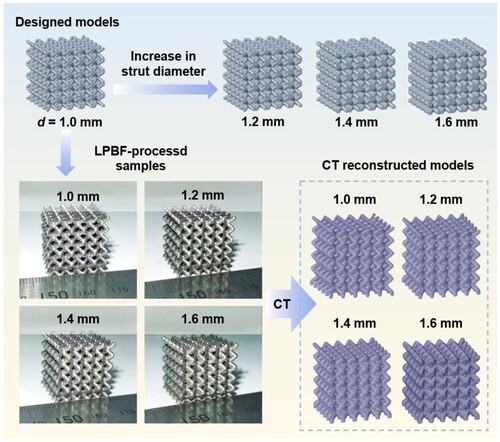
The lattice structures analysed in this study consisted of the body-centred cubic (BCC) lattice cells ((a)). The design length a was 4 mm, and the strut diameters d were 0.8, 1.0, 1.2, 1.4, 1.6, 1.8 and 2.0 mm, respectively. Each LPBF-processed lattice structure used for CT scanning and compression testing consists of 5 × 5 × 5 BCC cells. The volume fraction of the sample was calculated as the percentage of the volume of the lattice cell to its enclosing volume (a3).
Figure 2. (a) Geometrical parameters of the unit cell and complete lattice structure model of the test sample, (b) scanning strategies, (c) diagram of laser powder bed fusion (LPBF) process and (d) morphologies of the AlSi10Mg powder.
2.2. Laser powder bed fusion process and materials
All lattice structures were manufactured from AlSi10Mg metal powder using a self-developed LPBF system. This system comprised a YLR-500-WC ytterbium fibre laser (IPG Laser GmbH, Germany), an automatic powder spreading device, an inert argon gas protection system and a computer control system. The maximum power of the laser can reach 500 W, and the spot diameter is 70 µm. The LPBF process was outlined in (c). The LPBF process was conducted in an argon atmosphere to keep the oxygen level below 200 ppm. Gas atomised AlSi10Mg powder was employed here, with the chemical composition detailed in . The morphology was shown in (d). Most of the powders were spherical and some satellite particles could be observed. Based on our previous work [Citation36], the major process parameters applied were: laser scanning speed = 1150 mm/s, hatch spacing = 60 µm and powder layer thickness = 50 µm.
Table 1. Chemical composition of AlSi10Mg powder.
2.3. Orthogonal experiment design
To elucidate the influence of process and geometric parameters on the mechanical properties of the lattice structure, three key parameters were identified for OED: laser power, scanning strategy and strut diameter. The selected parameters with given levels were listed in . Scanning strategies can affect the accumulated stress and heat distribution of samples [Citation37], but was often overlooked. Three scanning strategies were employed in this work, as depicted in (b), including line (L-scanning strategy), zigzag (Z-scanning strategy) and chessboard (C-scanning strategy). The chessboard scanning strategy divided the building area into several small regions. The residual stress may change with the size of the checkerboard blocks. The chessboard scanning strategy was further subdivided into five categories contingent on the edge length (L) of the chessboard. The current OED contained 49 compression test groups, with the maximum first peak stress (MFPS) of the lattice structure serving as the test indicator. ANOVA was used in the analysis and optimisation of laser power, scanning strategy and strut diameter. The parameters used in ANOVA were calculated by the following equations [Citation38]:
(1)
(1)
(2)
(2)
(3)
(3)
(4)
(4) where T is the sum of MFPS data,
is the sum of squares correlated to the test factor A,
is the sum of squares of the variance.
is the sum of squared differences between the indicator values of all experimental results at different levels and the mean at that level, caused by random errors.
is the tth measured MFPS data of the ith group and
is the sum of the experimental data corresponding to the mth level.
Table 2. Factors and levels of present OED.
2.4. Experiment and performance metrics
Relative densities of samples were measured by the Archimedes method, employing anhydrous ethanol (0.79 g/ml) as the measuring medium to reduce the influence of bubbles attached on structure surfaces. Before measurement, LPBF-processed samples underwent detergent cleaning and 15 min ultrasonic cleaning in an alcohol bath, then dried in the air.
Dimensional analyses and defect characterisations of the as-built BCC lattice structures were conducted with CT, using a multiscale Voxel-2000 was used, with a voxel size of 45 µm. The CT scan settings were as follows: a source acceleration voltage of 380 kV and a source current of 1.0 µA. The 3D models of the LPBF-processed samples were subsequently reconstructed from the acquired 2D images in this work.
Uniaxial compression experiments were performed on a 100 kN electromechanical universal testing machine (MTS Systems, CMT-5205) with 2 mm/min compression rate. During the compression test, the deformation process of samples was recorded by a digital video (Sony, HDR-CX170). The stress was calculated by dividing the compressive force by the initial nominal area perpendicular to the loading direction, and the strain was the compressive displacement divided by the initial height of the sample [Citation39]. From the stress–strain curve of LPBF-processed lattice samples, the notable mechanical properties were derived, including the maximum first peak stress (MFPS) and elastic modulus (E), reflecting the sample's resistance capabilities against deformation and failure. Energy absorption capacity, one of the key indicators characterising the impact resistance and energy absorption application of lattice structures, was calculated from the area under the stress–strain curve. The energy absorbed per unit volume (EA) was calculated by the following equation [Citation40]:
(5)
(5) where σ is the instantaneous stress and ϵ is the instantaneous strain. As mass (m) is crucial for energy absorbers in practical applications, specific energy absorption (SEA), which is the energy absorbed per unit mass, was also important and was calculated as [Citation31]:
(6)
(6) where
is the relative density of structures and
is the density of the constitutive material. The limit of strain for SEA was set to 22.5%.
2.5. Finite element analysis
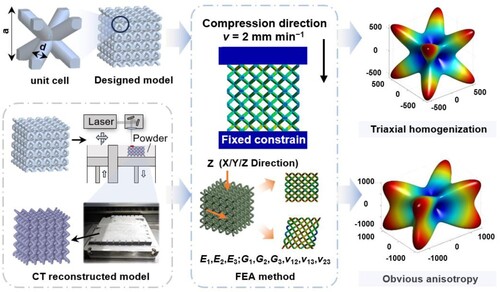
Numerical simulations of samples were performed to analyse the deformation mechanism and stress distribution of BCC lattice structures. Rigid upper and lower compression plates were oriented parallel to the XY plane of the lattice structure, overlapping the top and bottom plate of the lattice. A surface contact model with 0.2 friction coefficient was set between the compression plates and structure. To mimic the experimental setup, the bottom plate was fixed in all degree of freedoms, while the top plate moved downward at a constant rate of 2 mm/min with the displacement was set as 5 mm. The mesh type of lattice structure model was set as tetrahedron with the size of 0.3 × 0.3 mm2. To investigate the impact of geometric defects in the preparation of lattice structures on their compressive mechanical properties, two models were compared: an idealised model as designed and a reconstructed model based on CT scan images. The ANSYS LS-DYNA was used as simulation software and the elastic linear strain-hardening material was set as AlSi10Mg. The mechanical properties of AlSi10Mg were detailed in our previous work [Citation41].
In this work, the constitutive behaviours of lattice structures were assumed to be linear elastic and orthotropic, which reduced the number of independent elastic constants to nine, determined by the Young's modulus ,
,
, Poisson's ratio
,
,
and shear modulus
,
,
along three elastic principal directions. There exists a relationship between the effective elastic matrix DH and the effective compliance matrix SH:
(7)
(7)
(8)
(8)
(9)
(9)
(10)
(10) where KV, GV and KR, GR denote the bulk and shear moduli calculated according to Voigt and Reuss scheme, stated in terms of components in the stiffness and compliance matrices as:
(11)
(11)
(12)
(12)
(13)
(13)
(14)
(14)
The universal anisotropy index AU is a generalisation of the Zenner index and a general measure of materials with all symmetries because it accounts for all the elastic constants into computation. AU is a non-negative, monotonic increasing function with an increase in elastic anisotropy, and it takes zero for all isotropic materials [Citation42–45].
3. Results and discussion
3.1. Orthogonal experimental analysis
The compression test results for 49 groups of lattice structures were listed in the Appendix table, gave the results of the ANOVA by Equations (1)–(4). QS is the sum of squares in relation to a factor, which was calculated by Equation (2). DF is the degree of freedom, which is the number of the assigned levels minus 1 for a factor. MS is the mean square of a factor, which is the sum of square divided by the related degree of freedom. The value of F is the ratio of a given mean square to its error. Here, F is the f-distribution in mathematic statistics. F was adopted to evaluate the significance of each factor versus MFPS, computed and compared with a critical value. The critical value of F for 95% confidence level, that is, significance level of α = 0.05, can be obtained as F0.05,6,30 = 2.42. Here, subscript 6 corresponded to the degree of freedom for each factor and subscript 30 corresponded to the total degrees of freedom for the errors. Generally, when F exceeds the critical value, that is, F > 2.42, the related factor has a significant effect on the target. Otherwise, the factor is insignificant. Thus, strut diameter changes had significant effects on MFPS as the related F value was greater than 2.42, whereas laser power and scanning strategy did not. The significance value in was calculated based on the given F-values and degrees of freedom. According to the stipulated criteria, a significance value below 0.05 indicates statistical significance, while a value below 0.01 indicates high significance [Citation38]. The strut diameter with a significance value of 0 was evident had highly significant in the effect on the MFPS, while the other factors showed even less significant effect (). Therefore, the following work should focus on the strut diameter of the lattice structures and select appropriate process parameters: laser power of 350 W and Chessboard scanning strategy with L of 4.8 mm.
Table 3. Results of ANOVA due to obtained MFPS.
3.2. Formability
showed the designed and LPBF-processed models with various strut diameters. Qualitative analysis revealed good agreement between the designed and as-built geometries, with no observable defects such as collapse, warpage or deformation in the as-built samples. Furthermore, all lattice nodes were free of fracture, demonstrating the capability of LPBF to successfully prepare intricate lattice structures.
Figure 3. The designed models, LPBF-processed samples and CT reconstructed models of four lattice structures with different strut diameters.
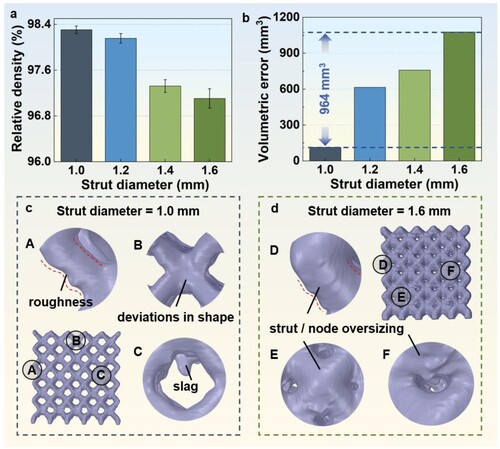
Relative densities of LPBF-processed lattice structures with different strut diameters were shown in (a). The lattice structure with the finest strut diameter of d = 1.0 mm had the highest relative density of 98.3%, followed by d = 1.2 mm (98.1%), d = 1.4 mm (97.3%) and d = 1.6 mm (97.1%). Quantitative analysis of the volume errors between the as-built and designed models ((b)) revealed a monotonic increase from 113.9 to 1077.9 mm3 as strut size increased. Detailed microstructural characterisation ((c and d)) revealed residual partially melted powders forming on struts, resulting in a larger strut diameter and a higher nominal density. As the strut diameter increased, a greater quantity of powder adhered, resulting in an elevation in volume deviation. In addition, the staircase-effect associated with overhanging not only led to strut roughness, but also caused the inclined struts becoming larger than the target design [Citation31]. Significant strut waviness occurred for the thinnest lattices, decreasing with larger diameters. These defects introduced roughness and decreased relative density, driving deviations between as-built and designed geometries.
Figure 4. Manufacturing accuracy of lattice structures with different strut diameters: (a) material relative density, (b) volumetric error and (c, d) the morphology of the struts and the characteristics of slag hanging on the suspension surface with d = 1.0 and 1.6 mm.
3.3. Compressive properties
The compression stress–strain curves of four LPBF-processed lattice structures are shown in (a). All curves exhibited three stages: an elastic stage, a yield stage and a plastic stage. In the elastic stage, the structures did not undergo plastic deformation and stress changed linearly with strain. In the yield stage, plastic deformation began and stress increased slowly. This stage became less pronounced as strut diameter increased. In the plastic stage, different degrees of plastic deformation and failure occurred. With small diameters, the curve was relatively flat with bending-dominated deformation. However, as the strut diameter increased, the deformation mode gradually changed from overall deformation to layer-by-layer deformation (tensile conduction), forming multiple peaks on the curve. The compressive properties for the experimental data were summarised in . Compared with the other AlSi10Mg lattices [Citation46–50], the processed samples exhibited relatively better mechanical properties. The lattice structure with d = 1.6 mm showed the maximum elastic modulus (1975.8 MPa), which was 123.5%, 59.7% and 20.3% higher than d = 1.0 mm (884.1 MPa), d = 1.2 mm (1237.5 MPa) and d = 1.4 mm (1642.5 MPa), respectively ((b)). As strut diameter increased from 1.0 to 1.6 mm, the MFPS rose from 30.2 to 97.1 MPa (). Notably, the curve plateau of sample with d = 1.6 mm was nearly straight with the largest slope, suggesting optimal energy absorption per volume ((c)). The specific energy absorption (SEA) of lattice structures with different strut diameters is shown in (d). The SEA values for different structures were 4.9 J/g (d = 1.0 mm), 7.4 J/g (d = 1.2 mm), 9.4 J/g (d = 1.4 mm) and 11.7 J/g (d = 1.6 mm), confirming improved mass-normalised energy absorption with increasing diameter due to the transition from bending to stretching deformation.
Figure 5. Compression mechanical properties of LPBF-processed lattice structures with different strut diameters: (a) stress–strain curves, (b) elastic modulus, (c) energy absorption and (d) specific energy absorption.
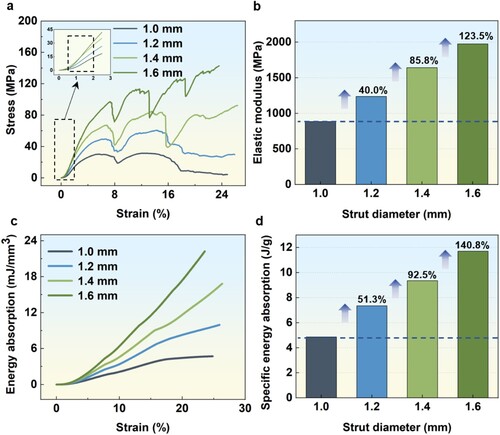
Table 4. The mechanical properties of LPBF-processed lattice structures with different strut diameters.
3.4. Numerical simulation
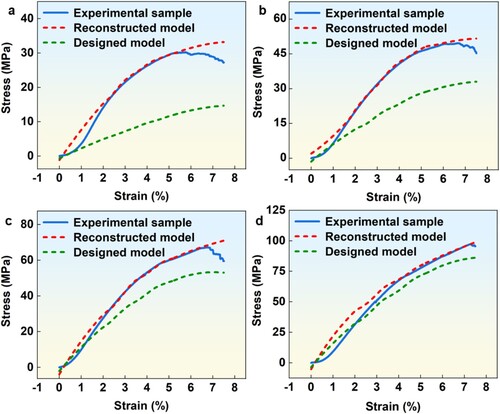
To elucidate geometric defect influences on compression behaviour, FEA was performed using designed and CT reconstructed models across varied strut diameters. The comparison of the compressive response curve between experimental and FEA result is presented in . Due to the high cost of calculation based on the CT reconstructed models, calculations limited to 8% strain where maximum failure stress occurred. Due to a positive volume deviation between the LPBF-processed samples and designed models, the mechanical properties obtained by the designed model were lower than the experimental results. CT reconstructed model predictions closely matched experimental results, with well-aligned curve trends, while design models diverged significantly, especially for smaller diameters. This further indicated the significant impact of geometric defects on the mechanical properties of the lattice structures [Citation34], with CT reconstructed model analysis better captured experimental outcomes.
Figure 6. Comparison of compressive response curve between experimental and FEA result with different strut diameters: (a) d = 1.0 mm, (b) d = 1.2 mm, (c) d = 1.4 mm and (d) d = 1.6 mm.
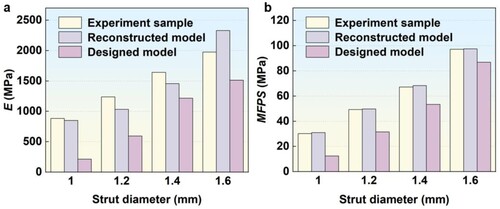
Based on the FEA results, the comparison of E and MFPS under different strut diameters was shown in . The overall trend of the calculated results was consistent with the experimental results, with both E and MFPS increasing with the increase in strut diameter. CT reconstructed models provided closer predictions versus experiments. Enlarged strut diameters and node volumes compared to designed models, along with irregular strut shapes, drove these discrepancies and mechanical property impacts.
Figure 7. Comparison of mechanical properties: (a) elastic modulus (E) and (b) maximum first peak stress (MFPS).
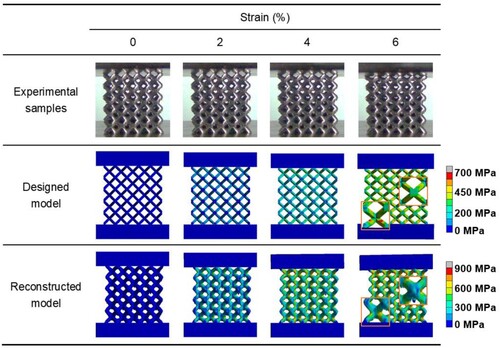
The Von-Mises stress distribution was obtained using the FEA to reveal the elastic response and failure mechanism of lattice structures. compared experiments and predictions of lattice structure with d = 1.0 mm. The highest stresses localised at strut-platen contact regions near the applied load, where bending-dominant deformation occurred first, as FEA based on reconstructed models showed. Despite higher modulus and strengths, CT reconstructed models exhibited reduced stress concentrations, indicating oversized struts/nodes enhance bending stiffness. In addition, the introduction of additional parts provided robust support to the node, effectively redistributing the stress borne by the new node back onto the struts [Citation51]. As a result, with the increased node volume, the stress concentration area became farther away from the node and gradually moves towards the middle of the strut [Citation52]. In contrast, idealised designed models showed more uniform, symmetrical stress patterns inconsistent with experiments. By neglecting defects, design models failed to capture true stress localisations and deformations.
Figure 8. Comparison between the stress distribution and the deformation behaviour of experiment samples.
3.5. Effective elastic properties and anisotropy of lattice structures
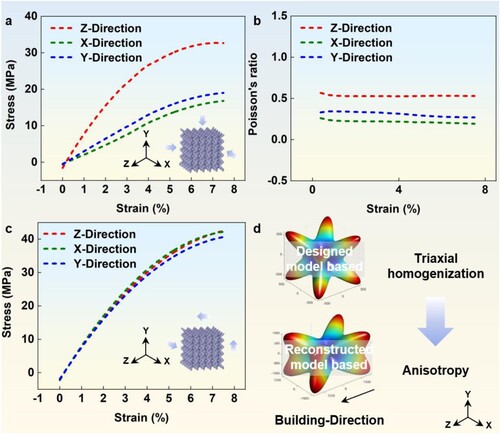
FEA of uniaxial and shear strain provided reaction forces to calculate corresponding stresses [Citation53]. Different from obtaining mechanical properties through experiments in a single compression direction, the CT reconstructed model can obtain mechanical properties of the structure in all directions. For a d = 1.0 mm lattice, (a–c) showed obtained properties, including Young's modulus, Poisson's ration and shear modulus along three directions [Citation54]. The effective elastic performance was then calculated via these data. Interpolation operations were performed to obtain Young's modulus in various directions, giving a visualisation in three-dimensional space. The effective elastic properties obtained ware shown in (d). The structural anisotropy made the mechanical properties obtained based on the CT reconstructed model exhibited anisotropy different from the designed model. The result obtained based on the designed model showed balanced mechanical properties in the X, Y and Z (building direction) directions, while the CT reconstructed model showed larger elastic modulus in the Z direction versus the X and Y direction. The main reason for this situation was the anisotropy of the struts and nodes in the processed samples. On one hand, the struts exhibited thickening along the building direction due to the staircase-effect, improving the mechanical performance of the Z direction. On the other hand, the hanging slag at the node along the Z direction not only increased the volume of the node and the bending stiffness of the lattice structure, but also reduced the sharp angles in the designed model, which was also beneficial for reducing the stress concentration in the node during compression along the Z direction [Citation55].
Figure 9. Equivalent elastic matrix of lattice structures based on homogenisation theory: (a) triaxial compression FEA result, (b) Poisson's ratio in three directions, (c) triaxial shear FEA result and (d) equivalent elastic matrix of lattice structures (d = 1.0 mm).
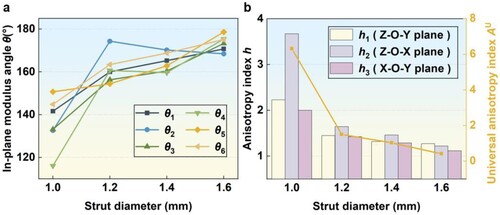
The diagram of three-dimensional modulus of lattice structures with various strut diameters was shown in . The BCC lattice structure exhibited the highest elastic modulus in the diagonal direction, and the lowest in the X, Y and Z axes directions. Increasing diameter significantly enhanced overall Young's modulus. To make the analysis more quantitative, we determined the in-plane modulus angle θ, producing six different angles across three planes. In addition, anisotropy was evaluated via an index h defined as the ratio of the in-plane major axis (lmax) to the minor axis (lmin). There were also three different h across three planes. Higher h indicated greater anisotropy. The calculation results were shown in . The anisotropy of Young's modulus was related to the strut diameter of the lattice structure. Anisotropy was more pronounced at lower strut diameters, especially along the building direction. However, increasing strut diameter reduced anisotropy (the θ approached 180°, h and AU neared to 0 [Citation56]), weakening the enhancement effect of build direction in the LPBF process to the anisotropy of samples. This revealed the manufacturing deviations at low strut diameters like strut surface roughness and slag hanging at nodes, absent in designed models, enhanced the compressive mechanical performance of the lattice structure along the build axis. At higher strut diameters, the roughness of the suspension surfaces of different struts and the hanging slag at node positions were interconnected, leading to a decrease in the manufacturing accuracy of the lattice structures (as described in Section 3.2), but narrowed the gap between different directions. This is because the structures with high volume fractions were like solid material with holes in them, reducing topological influence on anisotropy [Citation57]. With the increase in the strut diameter, the mechanical properties of BCC lattices in all directions were enhanced, but the improvement of mechanical properties in the axial direction was always larger than that in the diagonal direction. The struts in BCC lattice structures were mainly deformed by bending under axial direction load. And the mechanical properties of the structure with a bending deformation mechanism were more sensitive to the change in volume fraction [Citation53]. Overall, the use of CT reconstructed models can effectively analyse the anisotropic mechanics of LPBF-processed lattice structures.
Figure 10. Effective elastic modulus of lattices under different strut diameters: (a) d = 1.0 mm, (b) d = 1.2 mm, (c) d = 1.4 mm and (d) d = 1.6 mm.
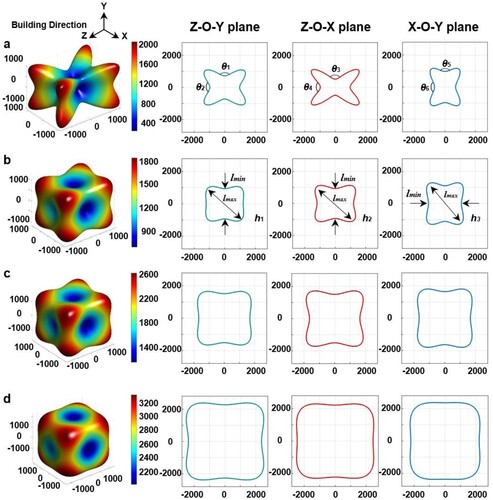
Figure 11. Anisotropy analysis of lattices under different strut diameters: (a) the angles between the in-plane Young's modulus and (b) the anisotropy level of the lattice.
4. Conclusions
In this study, an integrated methodology combining statistical analysis, precision characterisation, mechanical assessments and FEA was presented to accurately predict lattice mechanics while elucidating defect impacts. OED and variance analysis systematically explored process–structure–property relationships in LPBF-processed lattice structures. The manufacturability and the compressive mechanical properties of lattice structures with varied strut diameters under fixed process parameters were further analysed through CT characterisation technology and compression testing. The compressive elastic response and failure mechanism of lattices were predicted and analysed via designed and reconstructed model-based FEA, with reconstructed models better capturing experiments by incorporating imperfections. FEA of reconstructed models enabled calculation of effective elastic properties via homogenisation theory and systematic analysis of anisotropic behaviour in LPBF-processed lattice structures. Based on the results and discussions, several key conclusions are as followed:
CT revealed lattice fabrication across diameters without obvious forming defects. However, increasing roughness and residual dross with larger diameters caused 5–27% dimensional deviations from designs, while the density also decreased due to an increase in the fraction of non-dense slag on the strut surface.
Both elastic modulus (E) and maximum first peak stress (MFPS) of the lattice structure samples were proportional to strut diameter. Samples with larger strut diameter of 1.6 mm had more advantages in terms of specific energy absorption (11.7 J/g) as well.
Compared with designed models, reconstructed models better captured experimental stress distributions and failure modes, highlighting the critical role of imperfections. The spatial elastic tensor obtained from reconstructed model-based FEA exhibited significant anisotropy. Compared to Young's modulus along the X and Y axes, larger Young's modulus in diagonal and building direction were exhibited in BCC lattices.
The anisotropy of lattices was intricately linked to the strut diameters. When the strut diameter diminished to 1.0 mm, the anisotropy of lattice structures became more pronounced, the Zener ratio AU can reach to 6.31. When the strut diameter increased to 1.6 mm, the enhancement effect of construction direction on sample anisotropy during the LPBF process was weakened, and AU of 0.42 was obtained.
Disclosure statement
No potential conflict of interest was reported by the author(s).
Data availability statement
The data that support the findings of this study are available from the corresponding author upon reasonable request.
Additional information
Funding
References
- Liu Y, Wang Y, Ren H, et al. Ultrastiff metamaterials generated through a multilayer strategy and topology optimization. Nat Commun. 2024;15(1):2984. doi:10.1038/s41467-024-47089-8
- Zhang J, Huang H, Liu G, et al. Stiffness and energy absorption of additive manufactured hybrid lattice structures. Virtual Phys Prototyp. 2021;16(4):428–443. doi:10.1080/17452759.2021.1954405
- Rashed MG, Ashraf M, Mines RAW, et al. Metallic microlattice materials: a current state of the art on manufacturing, mechanical properties and applications. Mater Des. 2016;95:518–533. doi:10.1016/j.matdes.2016.01.146
- Gao Q, Liao W-H. Energy absorption of thin walled tube filled with gradient auxetic structures-theory and simulation. Int J Mech Sci. 2021;201:106475. doi:10.1016/j.ijmecsci.20.106475
- Pan C, Han Y, Lu J. Design and optimization of lattice structures: a review. Appl Sci. 2020;10(18):6374. doi:10.3390/app10186374
- Maconachie T, Leary M, Lozanovski B, et al. Slm lattice structures: properties, performance, applications and challenges. Mater Des. 2019;183:108137. doi:10.1016/j.matdes.2019.108137
- Zhang L, Feihb S, Daynes S, et al. Energy absorption characteristics of metallic triply periodic minimal surface sheet structures under compressive loading. Addit Manuf. 2018;23:505–515. doi:10.1016/j.addma.2018.08.007
- Deshpande VS, Fleck NA, Ashby MF. Effective properties of the octet-truss lattice material. J Mech Phys Solids. 2001;49(8):1747–1769. doi:10.1016/S0022-5096(01)00010-2
- Kooistra GW, Wadley HNG. Lattice truss structures from expanded metal sheet. Mater Des. 2007;28(2):507–551. doi:10.1016/j.matdes.2005.08.013
- Lee Y-H, Lee B-K, Jeon I, et al. Wire-woven bulk Kagome truss cores. Acta Mater. 2007;55(18):6084–6094. doi:10.1016/j.actamat.2007.07.023
- Queheillalt DT, Murty Y, Wadley HNG. Mechanical properties of an extruded pyramidal lattice truss sandwich structure. Scr Mater. 2008;58(1):76–79. doi:10.1016/j.scriptamat.2007.08.041
- Gu D, Shi X, Poprawe R, et al. Material-structure-performance integrated laser-metal additive manufacturing. Science. 2021;372(6545):1487. doi:10.1126/science.abg1487
- Xiao Z, Yu W, Fu H, et al. Recent progress on microstructure manipulation of aluminium alloys manufactured via laser powder bed fusion. Virtual Phys Prototyp. 2023;18(1):e2125880. doi:10.1080/17452759.2022.2125880
- Echeta I, Feng X, Dutton B, et al. Review of defects in lattice structures manufactured by powder bed fusion. Int J Adv Manuf Technol. 2020;106(5–6):2649–2668. doi:10.1007/s00170-019-04753-4
- Alkhatib SE, Karrech A, Sercombe TB. Isotropic energy absorption of topology optimized lattice structure. Thin Wall Struct. 2023;182:110220. doi:10.1016/j.tws.2022.110220
- Alkhatib SE, Xu S, Lu G, et al. Rate-dependent behaviour of additively manufactured topology optimised lattice structures. Thin Wall Struct. 2024;198:111710. doi:10.1016/j.tws.2024.111710
- Gao Q, Ding Z, Liao W-H. Effective elastic properties of irregular auxetic structures. Compos Struct. 2022;287:115269. doi:10.1016/j.compstruct.2022.115269
- Zhang L, Lifton J, Hu ZH, et al. Influence of geometric defects on the compression behaviour of thin shell lattices fabricated by micro laser powder bed fusion. Addit Manuf. 2022;58:103038. doi:10.1016/j.addma.2022.103038
- Liu H, Gu D, Qi J, et al. Dimensional effect and mechanical performance of node-strengthened hybrid lattice structure fabricated by laser powder bed fusion. Virtual Phys Prototyp. 2023;18(1):e2240306. doi:10.1080/17452759.2023.2240306
- Bevans B, Barrett C, Spears T, et al. Heterogeneous sensor data fusion for multiscale, shape agnostic flaw detection in laser powder bed fusion additive manufacturing. Virtual Phys Prototyp. 2023;18(1):e2196266. doi:10.1080/17452759.2023.2196266
- Sanaei N, Fatemi A, Phan N. Defect characteristics and analysis of their variability in metal L-PBF additive manufacturing. Mater Des. 2019;182:108091. doi:10.1016/j.matdes.2019.108091
- Chen Y, Peng X, Kong L, et al. Defect inspection technologies for additive manufacturing. Int J Extreme Manuf. 2021;3(2):022002. doi:10.1088/2631-7990/abe0d0
- Smith BA, Laursen CM, Bartanus J, et al. The interplay of geometric defects and porosity on the mechanical behavior of additively manufactured components. Exp Mech. 2021;61(4):685–698. doi:10.1007/s11340-021-00696-8
- Fu J, Li H, Song X, et al. Multi-scale defects in powder-based additively manufactured metals and alloys. J Mater Sci Technol. 2022;122:165–199. doi:10.1016/j.jmst.2022.02.015
- Sanaei N, Fatemi A. Defects in additive manufactured metals and their effect on fatigue performance: a state-of-the-art review. Prog Mater Sci. 2021;117:100724. doi:10.1016/j.pmatsci.2020.100724
- Tan C, Li S, Essa K, et al. Laser powder bed fusion of Ti-rich TiNi lattice structures: process optimisation, geometrical integrity, and phase transformations. Int J Mach Tools Manuf. 2019;141:19–29. doi:10.1016/j.ijmachtools.2019.04.002
- Noronha J, Leary M, Qian M, et al. Geometrical parameters and mechanical properties of Ti6Al4V hollow-walled lattices. Mater Sci Eng A. 2022;840:142667. doi:10.1016/j.msea.2022.142667
- Chen X, Liao W, Wei H, et al. Formation mechanisms and control strategies of metallurgical defects and microstructures during laser powder bed fusion of AlSi10Mg lattice structures. J Mater Res Technol. 2024;28:139–153. doi:10.1016/j.jmrt.2023.12.006
- Jiang P, De Meter E, Basu S. The influence of defects on the elastic response of lattice structures resulting from additive manufacturing. Comput Mater Sci. 2021;199:110716. doi:10.1016/j.commatsci.2021.110716
- Li D, Zhang X, Qin R, et al. Influence of processing parameters on AlSi10Mg lattice structure during selective laser melting: manufacturing defects, thermal behavior and compression properties. Opt Laser Technol. 2023;161:109182. doi:10.1016/j.optlastec.2023.109182
- Liu L, Kamm P, García-Moreno F, et al. Elastic and failure response of imperfect three-dimensional metallic lattices: the role of geometric defects induced by selective laser melting. J Mech Phys Solids. 2017;107:160–184. doi:10.1016/j.jmps.2017.07.003
- Gorguluarslan RM, Choi S-K, Saldana CJ. Uncertainty quantification and validation of 3D lattice scaffolds for computer-aided biomedical applications. J Mech Behav Biomed Mater. 2017;71:428–440. doi:10.1016/j.jmbbm.2017.04.011
- Melancon D, Bagheri ZS, Johnston RB, et al. Mechanical characterization of structurally porous biomaterials built via additive manufacturing: experiments, predictive models, and design maps for load-bearing bone replacement implants. Acta Biomater. 2017;63:350–368. doi:10.1016/j.actbio.2017.09.013
- Vrána R, Koutecký T, Červinek O, et al. Deviations of the SLM produced lattice structures and their influence on mechanical properties. Materials (Basel). 2022;15(9):3144. doi:10.3390/ma15093144
- Lozanovski B, Downing D, Tino R, et al. Non-destructive simulation of node defects in additively manufactured lattice structures. Addit Manuf. 2020;36:101593. doi:10.1016/j.addma.2020.101593
- Shi K, Gu D, Liu H, et al. Process-structure multi-objective inverse optimisation for additive manufacturing of lattice structures using a physics-enhanced data-driven method. Virtual Phys Prototyp. 2023;18(1):e2266641. doi:10.1080/17452759.2023.2266641
- Liu X, Gu D, Yuan L, et al. Effect of laser printing mode on surface topography, microstructure, and corrosion property of additive manufactured NiTi alloy. Adv Eng Mater. 2023;25:2300184. doi:10.1002/adem.202300184
- Du L, Qian G, Zheng L, et al. Influence of processing parameters of selective laser melting on high-cycle and very-high-cycle fatigue behaviour of Ti-6Al-4 V. Fatigue Fract Eng Mater Struct. 2021;44(1):240–256. doi:10.1111/ffe.13361
- Yang J, Gu D, Lin K, et al. Laser powder bed fusion of mechanically efficient helicoidal structure inspired by mantis shrimp. Int J Mech Sci. 2022;231:107573. doi:10.1016/j.ijmecsci.2022.107573
- Gibson LJ, Ashby MF. Cellular solids: structure and properties. Cambridge: Cambridge University Press; 1997.
- Yang J, Gu D, Lin K, et al. Laser 3D printed bio-inspired impact resistant structure: failure mechanism under compressive loading. Virtual Phys Prototyp. 2020;15(1):75–86. doi:10.1080/17452759.2019.1677124
- Zener C. Anelasticity of metals. Nuovo Cim. 1958;7(Suppl 2):544–568. doi:10.1007/BF02751494
- Hu JZ, Molavi-Zarandi M, Pasini D. Topology optimization of lattice support structure for cantilever beams fabricated via laser powder bed fusion. Adv Eng Mater. 2023:2300976. doi:10.1002/adem.202300976
- Wang C, Gu X, Zhu J, et al. Concurrent design of hierarchical structures with three-dimensional parameterized lattice microstructures for additive manufacturing. Struct Multidiscip Optim. 2020;61(3):869–894. doi:10.1007/s00158-019-02408-2
- Zhang L, Ma QP, Ding JH, et al. Design of elastically isotropic shell lattices from anisotropic constitutive materials for additive manufacturing. Addit Manuf. 2022;59:103185. doi:10.1016/j.addma.2022.103185
- Guo H, Wang H, Li X, et al. Investigation of mechanical properties of laser powder bed fused AlSi10Mg lattice structures using GTN damage model. J Mater Res Technol. 2024;29:1937–1948. doi:10.1016/j.jmrt.2024.01.187
- Li Z, Nie Y, Liu B, et al. Mechanical properties of AlSi10Mg lattice structures fabricated by selective laser melting. Mater Des. 2020;192:108709. doi:10.1016/j.matdes.2020.108709
- Khanna P, Sood S, Mishra P, et al. Analysis of compression and energy absorption behaviour of SLM printed AlSi10Mg triply periodic minimal surface lattice structures. Structures. 2024;64:106580. doi:10.1016/j.istruc.2024.106580
- Arjunan A, Singh M, Baroutaji A, et al. Additively manufactured AlSi10Mg inherently stable thin and thick-walled a lattice with negative Poisson’s ratio. Compos Struct. 2020;247:112469. doi:10.1016/j.compstruct.2020.112469
- Lei H, Li C, Meng J, et al. Evaluation of compressive properties of SLM-fabricated multi-layer lattice structures by experimental test and μ-CT-based finite element analysis. Mater Des. 2019;169:107685. doi:10.1016/j.matdes.2019.107685
- Wang X, Li X, Li Z, et al. A ribbed strategy disrupts conventional metamaterial deformation mechanisms for superior energy absorption. Virtual Phys Prototyp. 2024;19(1):e2337310. doi:10.1080/17452759.2024.2337310
- Bai L, Yi C, Chen X, et al. Effective design of the graded strut of BCC lattice structure for improving mechanical properties. Materials (Basel). 2019;12(13):2192. doi:10.3390/ma12132192
- Zhao M, Li X, Zhang D, et al. Design, mechanical properties and optimization of lattice structures with hollow prismatic struts. Int J Mech Sci. 2023;238:107842. doi:10.1016/j.ijmecsci.2022.107842
- Lan X, Yang S, Dong Y, et al. Phenomenological methods for defining elasticity and failure of double-arrowhead metamaterials. Int J Mech Sci. 2023;252:108361. doi:10.1016/j.ijmecsci.2023.108361
- Zhao M, Zhang DZ, Li Z, et al. Design, mechanical properties, and optimization of BCC lattice structures with taper struts. Compos Struct. 2022;295:115830. doi:10.1016/j.compstruct.2022.115830
- Li Z, Zhai W, Li X, et al. Additively manufactured dual-functional metamaterials with customisable mechanical and sound-absorbing properties. Virtual Phys Prototyp. 2022;17(4):864–880. doi:10.1080/17452759.2022.2085119
- Zhao M, Li XW, Zhang DZ, et al. Geometry effect on mechanical properties and elastic isotropy optimization of bamboo-inspired lattice structures. Addit Manuf. 2023;64:103438. doi:10.1016/j.addma.2023.103438