Abstract
Background The Norwegian Arthroplasty Register reported that CMW3 cement performed poorly for femoral stem fixation.
Methods We implanted collared, satin-finished stems (Ra = 0.35 µm) into cadaver femora using CMW3 and with Simplex as control. Cement mantle function was quantified by stem migration after 300,000 cycles of “stair climbing”. Cement cracks and interface gaps were quantified in transverse sections.
Results The variances of the CMW3 migrations were substantially higher than for the control (p < 0.001): subsidence for CMW3: –32 (SD 42) µm, and for Simplex: –7 (SD 9) µm (p = 0.2); retroversion for CMW3: 0.60° (SD 0.25), and for Simplex: 0.37° (SD 0.04) (p = 0.08). Crack length-densities were similar. CMW3 had significantly more non-apposed stem/cement interface: 52% (SD 17) versus 33% (SD 8) (p = 0.04).
Migrations could be predicted by the fraction of non-apposed stem/cement interface (retroversion: R2=0.80, p < 0.001; subsidence: R2 = 0.46, p = 0.02) but not by cement cracks or non-apposed cement-bone interface.
Interpretation We found that increased stem/cement non-apposition resulted in increased stem migration. Early migration is known to correlate with risk of revision. Thus, the higher stem-revision risk for CMW3 cement reported by the Norwegian Arthroplasty Register may have been due to inferior and variable stem/cement apposition.
Publications of the Norwegian Arthroplasty Register have shown that, relative to Palacos and Simplex, CMW3 performed poorly for the fixation of femoral stems. The 10-year survival rates were 83% for CMW3 and 93% for the other types of cement (Havelin et al. Citation1995, Citation2000 Espehaug et al. Citation2002). These analyses classified CMW3 as “low-viscosity” cement, as it was described originally by the manufacturer. Since Sulfix, another “low-viscosity” cement, also displayed inferior results (Malchau et al. Citation2000), the general conclusion has been that the poor results with CMW3 are due to its low viscosity, which is assumed to result in an inferior cement-bone interface (Havelin et al. Citation1995). However, this conclusion may have been inappropriate because CMW3 is not a true low-viscosity cement. In fact, its viscosity characteristics are rather similar to those of Simplex during the application phase (Watkins Citation2003). CMW3 is currently marketed as “medium-viscosity”, which is appropriate.
The underlying causes of the differences in clinical performance of CMW3 and Simplex/Palacos remain unknown. The aim of this study was to determine whether mechanical factors might be responsible. We investigated two possible mechanisms, one based on differences in material properties and one based on differences in curing characteristics. Firstly, CMW3 has been shown to have lower fatigue strength (Harper and Bonfield Citation2000, Kuhn Citation2000), which may lead to more cement mantle damage. Secondly, polymerizing CMW3 has been shown to have a more rapid rise in viscosity due to its faster curing rate (Farrar and Rose Citation2001), which may affect mantle morphology.
Using a cadaver model subject to fatigue loading, we hypothesized that: a) femoral stems would exhibit greater migration with CMW3 mantles, b) cement-fatigue damage would be higher in CMW3 mantles, c) more interface gaps would be found around CMW3 mantles, and d) degree of cement damage and extent of interface gaps would be predictive of migration.
Materials and methods
Specimen preparation
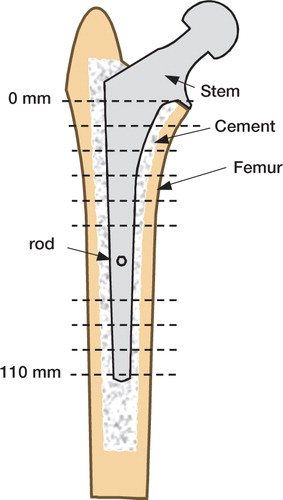
We prepared 6 pairs of stem/cement/femur constructs () from fresh-frozen cadaver femora, which had a median donor age of 62 (51–80) years. We compared CMW3 cement (DePuy Orthopedics, Warsaw, IN) with Simplex-P cement (Stryker Orthopedics, Mahwah, NJ) as a control. The two cements were randomly assigned to left and right femora. The femora were stripped of soft tissue and the distal third was removed. Plain radiographs were then taken to screen for pathological abnormalities and to template for stem size. Because the soft tissues were absent, reduced magnification stem templates (generated by a photocopier) were used. This process ensured that the cement mantles were of conventional thickness. All femora were implanted with an appropriate size of collared, satin-finished (Ra = 0.35 µm), macro-textured, cobalt-chrome stem with centralizer (Eon, Stryker Orthopedics)—4 pairs of size 6, 2 of size 8). This stem has the same proportions for all sizes, so the size 6 stems were 11 mm shorter than the size 8 stems.
Figure 1. Schematic cross section of a stem/cement/femur construct.Dashed lines indicate transverse sectioning levels at 10-mm intervals.Two central sections, which were affected by the portal for the micromotion measurement rod, were not analyzed.
We prepared the femora according to the surgical procedures defined by the stem manufacturer. After the final broach was seated and the calcar planed, the distal femora were potted in acrylic cement. The position of each femur in its pot was controlled by a jig attached to the broach. The jig ensured that the center of the femoral head would be consistently positioned relative to the pot. Prior to cementing, the femoral canal was vigorously cleaned by bottlebrush lavage and a distal plug fitted.
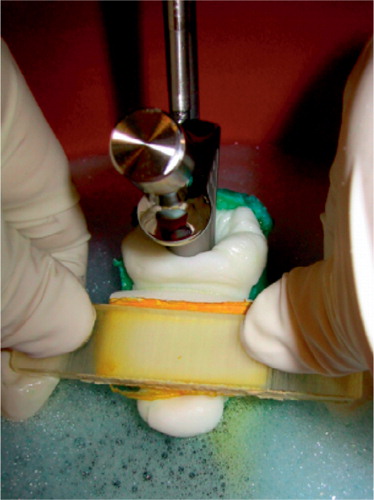
During implantation, a realistic thermal environment was created by surrounding the femur with blood-analogue at 37°C (). The shear-thinning viscosity characteristics of blood were simulated by incorporating a water-soluble long-chain polymer (polyacrylamide) into calcium-buffered saline (9 mg/mL NaCl, 0.8 mg/mL polyacrylamide, 0.057 mg/mL CaCl2, 1 mg/mL Rocal bacteriostatic agent, 1 mg/mL methylene blue).
Figure 2. Stem implantation.The broached femur, connected by a five-degrees-of-freedom clamp to the base of a materials testing machine, was surrounded by 37°C blood analogue.The femoral stem was clamped to the crosshead.After the canal had been filled and pressurized, the stem was inserted at a constant displacement rate.The normal clinical practice of occluding the medial side of the canal was simulated safely by using a foam rubber-backed rod in place of a thumb.
Variations in cement technique were minimized by using a viscometer to define cement application and stem insertion times. In a preliminary study, we recorded the viscosity of cement (shear rate = 1/sec) at the application and stem insertion points defined by an experienced orthopedic surgeon. Based on those preliminary data, we chose to apply cement at η= 1000 Pa and to insert the stem at η= 2000 Pa. Following this protocol led to cement and stem insertion times that were around the middle of the manufacturer’s recommended working phases. We were thus confident that our cement technique was fairly representative of average clinical practice, and that is was reproducible.
The cements were vacuum-mixed and introduced using a cement gun with retrograde fill. During cementation, the femoral canal was drained via a thin suction hose. Once the femur had been filled, the suction hose was removed and the canal pressurized using the cement gun and a proximal seal.
We ensured consistent and reproducible stem insertion by attaching the stem to the actuator of a materials-testing machine. The stems were clamped to the crosshead and the femur was secured to the base via a 5-degrees-of-freedom clamp. The stem insertion rate was 400 mm/min. A foam rubber-backed fiat rod was used to simulate medial thumb pressure blocking cement backflow (). Force and displacement were recorded at the cross-head and used to calculate the total energy required for stem insertion, which gave an indirect measure of the viscosity of the cement inside the canal.
The stem/cement/femur constructs were then allowed to cure and hydrate for four days in calcium-buffered saline at room temperature. This contained a bacteriostatic agent to prevent tissue degradation. On removal from the saline bath, hydration was maintained by wrapping the constructs in wax film.
Mechanical testing
Fatigue testing was performed using a servo-hydraulic loading frame (Mini Bionics 858 with FlexTest IIm control and data-acquisition unit; MTS Systems Corporation, Eden Prairie, MN) with a custom “stair climbing” fixture, which has been described previously (Race et al. Citation2003). The fixture applied cyclic loads to stem/cement/femur constructs via the prosthetic femoral head and the greater trochanter. Bone size varied between donors, so peak loads for each pair of constructs were normalized such that initial valley-peak crosshead displacements were the same (to within ± 10%) for all donors. With this approach, stiffer (stronger) constructs were subjected to larger loads. We defined the baseline normal displacement with a synthetic composite femur (Third Generation Large Composite Femur; Pacific Research Laboratories Inc., Vashon, WA) with an assumed body weight of 75 kg, and a head-load of 3 body-weights (2.2 kN). For each donor, an initial conservative estimate of required head-load was made using endosteal and periosteal diameters measured from plain radiographs. The stem/cement/femur construct was then loaded for 100 cycles and the crosshead displacement noted. The load applied was then increased in the proportion required to reach the normal crosshead displacement. When the contralateral femur had already been tested, the previously determined load was used for the second femur. Load was applied sinusoidally at 3 Hz for 300,000 cycles.
We monitored micromotions using a 6-degrees-of-freedom system described previously (Berzins et al. Citation1993, Race et al. Citation2003). A triad of steel reference spheres was rigidly attached to the stem by a 6-mm diameter rod, 93 mm from the head center of the implant. The rod passed through a 10-mm diameter hole drilled into the posterior side of the femur. The position of the triad was monitored by an orthogonal array of 6 linear variable displacement transducers that were rigidly attached to the cortex. Data acquisition, which was via the loading frame control system, was triggered by peaks and valleys in the applied load. Micromotion data were described in an anatomical coordinate system based on the femoral stem.
Sectioning and imaging
After mechanical testing, specimens were sectioned transversely in order to determine cement mantle morphology and micro-crack density. Cuts were made with a water-irrigated abrasive saw (Buehler Isomet 2000, Buehler, Inc., Lake Bluff, IL) at 10-mm intervals encompassing the full length of the stem, starting approximately 10 mm distal to the collar. The two sections adjacent to the defect caused by the micromotion measurement system were not analyzed ().
The transverse sections were stained with a fluorescent dye-penetrant (Aquacheck WB200, Sherwin Inc., South Gate, CA), which revealed microcracks under epifluorescence microscopy (Race et al. Citation2003). Two images of each section were captured, one under epifluorescence illumination at a resolution of 12 µm/pixel and one under white light at a resolution of 6 µm/pixel. These large digital images were composites—automatically captured and tiled using a digital camera (Spot RT Monochrome, Diagnostic Instruments Inc., Sterling Heights, MI) and an epifluorescence microscope (Nikon SMZ800, Nikon Instruments Inc., Melville, NY) with ring illuminator, which were mounted to a computer-controlled milling machine (Benchman 2000, Light Machines, Manchester, NH).
Data analysis
Estimates of stem migration were given by the valley micromotion data, from which we derived two outcome measures: subsidence and retroversion. Because of inter-donor variations in scale, damage and morphological measures were normalized by area or perimeter. Micro-cracks were visually identified in the epifluorescence images and automatically traced and measured using a macro for ImagePro (Media Cybernetics, Silver Spring, MD). The cement damage outcome measure was crack length-density, calculated for each stem/cement/femur construct by the total length of micro-cracks divided by the total cement area for all transverse sections.
We estimated interface gaps and voids using standard stereological methods. A randomly-positioned, regular point-grid was digitally overlaid on each section using ImagePro. Points were classified as cement-bone gap, cement, mid-mantle void or stem-cement gap, and were tallied. Gaps and voids were expressed as fractions of the cement mantle area in each transverse section and were averaged to give whole-mantle measures for fractional area of gaps in each specimen.
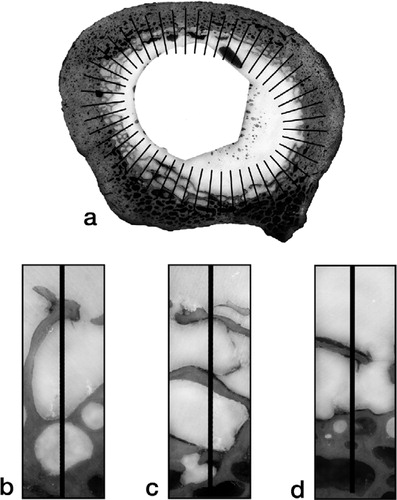
Because a more circular gap would compromise less of the interface than an extended gap of the same area, we devised an outcome measure that was more closely related to interface compromise—fraction of non-apposed interface. This measure was estimated from the transverse sections by the linear fraction of the stem-cement or cement-bone interface that was not in apposition (non-apposition was defined as a separation of 30 µm or more). For the stem-cement interface, this parameter was easy to measure, as the perimeter of the stem was well-defined. For each section, the lengths of gaps along the perimeter of the stem were totaled and the sum was divided by the perimeter of the stem. The values for the sections were then averaged to give the fraction of non-apposed stem-cement interface for each stem-cement-femur construct. Estimation of the fraction of non-apposed cement-bone interface was complicated by the interdigitation of cement with cancellous bone; in such regions, there was often a mixture of gapped and apposed cement-bone interfaces through the interdigitated zone (). We devised the following scheme to estimate the effective degree of apposition. For each section image, an ellipse was fitted to the cement-bone interface and 50 lines, normal to the perimeter, were distributed evenly around the ellipse. A count was made of lines that passed through fully non-apposed regions. For each line that passed through mixed regions, a value of one-half was added to the count. The total count for each section was divided by 50 and averaged to give an estimate of the fraction of non-apposed cement-bone interface for each stem-cement-femur construct ().
Figure 3. Illustration of the scheme devised to estimate the fraction of non-apposed cement-bone interface:(a) Transverse section of a stem-cement-femur construct overlaid with a set of 50 lines normal to an ellipse fitted to the cement-bone interface.Examples are shown of:(b) full apposition, count + 0;(c) mixed apposition, count + 1/2; (d) non-apposition, count + 1.The non-apposed interface for each section was estimated from count divided by 50.The fraction of non-apposed cement-bone interface for each stem-cement-femur construct was estimated from the mean of its sections.
Statistics
The hypotheses that migrations, cement damage and interface gaps would be greater for the CMW3 group were tested by paired t-tests. We used Hochberg’s Bonferroni procedure for multiple comparisons (Hochberg Citation1988) to correct p-values for each set of tests. The hypothesis that cement damage and interface gaps would be predictive of migrations was tested by linear regression models of crack length-density and fraction of non-apposed interface (both cement-bone and stem-cement) versus subsidence and retroversion.
Results
CMW3 reached application, stem-insertion and setting phases significantly faster than Simplex (). It should be noted that these times were well within the working phases recommended by the manufacturers. Energy of stem insertion was higher for CMW3: 22 J (SD 7) than for Simplex: 17 J (SD 6) (p = 0.005; paired t-test). This indicated that, during stem insertion, the viscosity of CMW3 within the femur was actually higher than that of Simplex.
Table 1. Timing of implantation events: cement application and stem insertion were triggered by intraoperative viscosity measurements
The load normalization process, which accounted for variations in donor bone size, resulted in a range of femoral head loads between 1.4 kN and 2.6 kN (median = 1.9 kN).
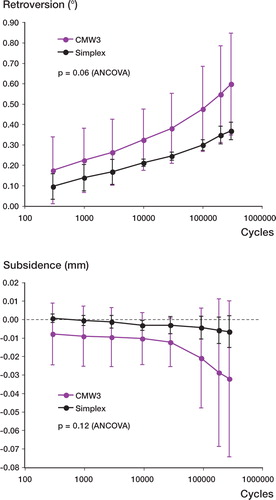
During fatigue loading, all stems rotated into retroversion and all but two subsided after 300,000 loading cycles (). An unexpected and notable finding was that the variances of both sub-sidence and retroversion were significantly higher for the CMW3 group (p < 0.001; F-test for ratio of variances). Measured at the end of cyclic loading, mean subsidence was –32 µm (SD 42) for CMW3 and –7 m (SD 9) for Simplex (p = 0.2; paired t-test). Mean retroversion was 0.60° (SD 0.25) for CMW3 and 0.37° (SD 0.04) for Simplex (p = 0.08; paired t-test).
Figure 4. Stem migration versus cycle number for retroversion (top) and subsidence (bottom).Note that that stem migrations were much more variable with CMW3 cement mantles.
Crack length-densities for the two cements were not significantly different: 50 (SD 14) µm/mm2 for CMW3 and 45 (SD 12) µm/mm2 for Simplex (p = 0.3).
Although there were no significant differences in the fractional areas of gaps, the morphology of these gaps led to a significantly higher fraction of non-apposed stem-cement interface in the CMW3 group (, ). The fractions of non-apposed cement-bone interfaces were not significantly different (). Linear regression analyses revealed that fraction of non-apposed stem-cement interface was the only significant predictor of migration for both subsidence and retroversion ( and ).
Figure 5. Reflected light images of a typical pair of sections showing the difference in stem-cement interface non-apposition between Simplex (left) and CMW3 (right).Although stem-cement gaps were of similar cross-sectional area, a larger fraction of the stem perimeter was compromised in the case of CMW3.Note that the morphologies of these gaps suggested that they were produced by polymerization shrinkage rather than by mechanical loading.If stem-cement gaps had been caused by loading, one would expect a gradual divergence of stem and cement rather than the abrupt changes between apposed and non-apposed regions that were found.
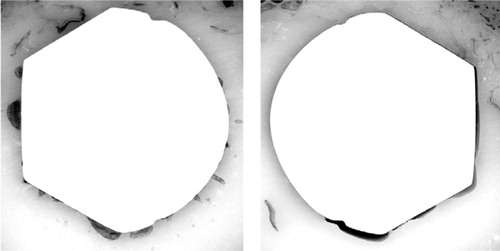
Figure 6. Effect of fraction of non-apposed stem-cement interface (S/C) on retroversion.The graph includes a linear regression line with 95% confidence intervals.
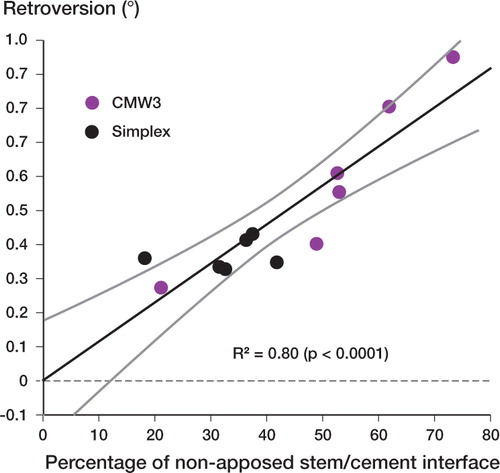
Table 2. Gap and void data (mean and SD) measured in transverse sections. Void area was expressed as a fraction of cement area, and interface non-apposition as a fraction of interface perimeter
Table 3. Linear regression results for prediction of retroversion and subsidence by crack length-density, fraction of non-apposed cement-bone interface and fraction of non-apposed stem-cement interface
Discussion
Experimental limitations
We took great care during specimen preparation and testing to ensure that variations due to technique would be minimized. The consistency of the micromotion results for Simplex demonstrated that our techniques were reproducible and that the load normalization process worked well in compensating for inter-donor variations.
It is possible that the outcomes for CMW3 might have been improved by earlier insertion of the femoral stem. However, the aim of our study was to determine whether mechanical factors could explain the clinical data. Thus, in defining the cement timings for this study, we attempted to establish a reasonable estimate of actual clinical use. The clinical data that inspired this study were collected from many different surgeons and hospitals, and details of cement timing were not reported (Havelin et al. Citation1995, Citation2000, Espehaug et al. Citation2002). We believe that our technique, which resulted in cement application and stem insertion around the middle of the working phase defined by the manufacturer, was the best estimate of actual clinical practice.
The most important experimental limitation of our study was the lack of biological response to loading. It is reasonable to assume that the increased migrations found with some CMW3 constructs are more likely to have generated debris due to motion between the stem and cement. This debris may have had greater mobility in CMW3 mantles because the flatter, more extensive gaps along the stem () would have served as better conduits for debris transport. In addition to wear debris, the combination of gaps and increased micromotions may have generated cyclic fluid pressures. In our cadaver model, we did not account for biological changes at the cement-bone interface, including fibrous tissue formation or osteolysis because of wear debris and fluid pressure cycling. These effects would have exacerbated the loosening process and may have resulted in increased micromotion of the stem. Thus, the migrations determined in this study represented the lower bounds on the actual in vivo response.
Since gap measurements were made after mechanical testing, it is possible that fatigue damage altered the interface morphology. Loading is likely to have led to debonding of the stem-cement interface. However, our protocol measured non-apposition (defined as gaps more than 30 µm thick) rather than debonding. We are confident that loading had a minimal effect on our gap measures, as the morphologies of the gaps were consistent with polymerization shrinkage and air/fluid inclusions but not with mechanical failure or deformation (). This conclusion is reinforced by the fact that the total gap areas for both groups were similar.
Another experimental limitation of our study was that we considered only one stem type with one surface finish. We have previously reported that stem surface roughness can strongly affect the manifestation of stem-cement gaps (Race et al. Citation2002). In addition to surface roughness, changes in surface chemistry may affect cement adhesion and flow during stem insertion. It is also likely that gap morphology is influenced by changes in stem shape.
Statistical limitations
Based on previous studies using Simplex with the same femoral stem, we calculated that 6 pairs of femora would be adequate to detect a statistically significant difference in retroversion of 0.1° (based on: SD = 0.055°; α = 0.05; ß = 0.2). However, since the variance in micromotion for CMW3 was much higher than anticipated, the present study was underpowered. Our data suggest that mean micromotions were probably different for the two cements, but to determine whether these differences were of a clinically significant magnitude would require more samples.
The small number of samples increased the risk that our data would violate the distributional assumptions of the t-test. We confirmed the validity of the t-tests by repeating the analyses using the non-parametric Wilcoxon signed rank test, which is less powerful for normal data but is not subject to distributional restrictions. These tests led to exactly the same conclusions for α = 0.05, although with higher p-values.
The effect of interface gap fraction was analyzed using linear regression analyses. A thought experiment considering the case of 100% non-apposition reveals that the true effect of interface gaps must be non-linear. It should also be noted that our non-apposition measures did not distinguish between a large number of “short” gaps and a smaller number of “long” gaps, the effects of which are likely to be different. Exploration of these factors will be done in future studies using computational simulations.
The linear regression analyses did not account for pairedness. However, we consider that this did not invalidate the conclusions regarding the relationship between interface non-apposition and micromotion—a hypothetical hidden variable, which was correlated across pairs, could have caused a type-II error but could not have caused a type-I error.
Interpretation
We found that differences in mantle morphology had an effect on stem migrations in the short term. Cement mantles with inferior stem-cement apposition resulted in more retroversion and subsidence after short-term cyclic loading. In previous clinical RSA studies, early migrations have been shown to correlate with revision risk (Kärrholm et al. Citation1994), so it is reasonable to infer that, in the context of the present in vitro study, greater migrations represented increased revision risk.
Despite the fact that CMW3 has been shown to have a lower fatigue life than Simplex (Harper and Bonfield, Citation2000), we found no significant difference in cement damage between the two cements. Differences in fatigue resistance may be important in the longer term, but do not appear to influence early migration.
The significantly greater fractions of non-apposed stem-cement interface for CMW3 can be explained by its higher viscosity during stem insertion, which could be inferred from significantly greater stem insertion energies. The increased viscosity during the implantation process made the cement wet the stem less, allowing the polymerization shrinkage process to pull the mantle away from the stem over a wide area (). Using a simple laboratory model, Spiegelberg et al. (Citation1999) reported that as cement viscosity increased, there was a corresponding increase in interfacial porosity at the stem-cement interface. Entrapment of air along the stem may have increased the number of nucleation sites for the polymerization shrinkage process, thus causing thinner but more extensive stem-cement gaps within CMW3 cement mantles.
Clinical relevance
We believe that the large variances in the migrations for CMW3 are of clinical importance. A higher revision rate can be explained by a higher variance in migration because the outliers (with markedly increased migration) would be the most likely candidates to become clinically loose. Thus, the present in vitro study is consistent with the clinical findings of the Norwegian Arthroplasty Register with regard to CMW3 (Havelin et al. Citation1995, Citation2000, Espehaug et al. Citation2002). The greater variances of CMW3 migrations were explained by variations in the fraction of non-apposed stem-cement interface generated by that particular cement. We believe that these were caused by the more rapid curing of CMW3, which amplified small errors in timing. Because the rate of increase in viscosity was higher for CMW3 than for Simplex, the same difference in the timing of stem insertion would lead to a larger change in viscosity for CMW3 than for Simplex.
No competing interests declared.
This study was funded by grants from NIH-NIAMS (AR42017 & AR 47927). Prostheses were supplied by Stryker Orthopedics. The authors wish to thank Mike Lee for assisting with the image analysis.
- Berzins A, Sumner D R, Andriacchi T P, Galante J O. Stem curvature and load angle influence the initial relative boneimplant motion of cementless femoral stems. J Orthop Res 1993; 11(5)758–69, [erratum appears in J Orthop Res 1995;13 (1):1 51]
- Espehaug B, Fumes O, Havelin L I, Engesaeter L B, Vollset S E. The type of cement and failure of total hip replacements. J Bone Joint Surg (Br) 2002; 84(6)832–8
- Farrar D F, Rose J. Rheological properties of PMMA bone cements during curing. Biomaterials 2001; 22(22)3005–13
- Harper E J, Bonfield W. Tensile characteristics of ten commercial acrylic bone cements. J Biomed Mater Res 2000; 53(5)605–16, (Erratum appears in J Biomed Mater Res 2001; 58 (2): 216)
- Havelin L I, Espehaug B, Vollset S E, Engesaeter L B. The effect of the type of cement on early revision of Charnley total hip prostheses. A review of eight thousand five hundred and seventy-nine primary arthroplasties from the Norwegian Arthroplasty Register. J Bone Joint Surg (Am) 1995; 77(10)1543–50
- Havelin L I, Engesaeter L B, Espehaug B, Furnes O, Lie S A, Vollset S E. The Norwegian Arthroplasty Register: 11 years and 73,000 arthroplasties. Acta Orthop Scand 2000; 71(4)337–53
- Hochberg Y. A sharper Bonferroni procedure for multiple tests of significance. Biometrika 1988; 75: 800–3
- Kärrholm J, Borssen B, Lowenhielm G, Snorrason F. Does early micromotion of femoral stem prostheses matter? 4–7-year stereoradiographic follow-up of 84 cemented prostheses. J Bone Joint Surg (Br) 1994; 76(6)912–7
- Kuhn K-D. Bone cements: Up-to-date comparison of physical and chemical properties of commercial materials. Springer, Berlin 2000
- Malchau H, Herberts P, Soderman P, Oden A. Prognosis of Total Hip Replacement: Update and validation of results from the Swedish National Hip Arthroplasty Register 1979–2000. 2000, www.jru.orthop.gu.se
- Race A, Miller M A, Ayers D C, Cleary R J, Mann K A. The influence of surface roughness on stem-cement gaps. J Bone Joint Surg (Br) 2002; 84(8)1199–204
- Race A, Miller M A, Ayers D C, Mann K A. Early cement damage around a femoral stem is concentrated at the cement/bone interface. J Biomech 2003; 36(4)489–96
- Spiegelberg S H, McKinley G H. A source of interfacial pore formation in cemented femoral components. Trans ORS 1999; 24: 253
- Watkins N D. The type of cement and failure of total hip replacements. J Bone Joint Surg (Br) 2003; 85(5)775–6, author reply 6