Abstract
Background We studied the ability of DEXA to detect bony defects around cementless acetabular components in total hip arthroplasty. The aim of our study was to provide a tool for detection and quantification of osteolytic lesions for the planning of revision cases.
Methods We measured BMC in 10 human pelvis specimens retrieved from post mortem. We created standardized defects behind inserted acetabular components and compared the ash weights of the removed bone to the corresponding BMC measurements.
Results We found a good correlation between the BMC differences measured and the corresponding ash weights.
Interpretation We conclude that DEXA can detect even small defects in the bone adjacent to the cup.
Fixation of cementless acetabular components is dependent on the strength of the surrounding bone. Decreased bone mineral content (BMC) of periprosthetic bone might be a reason for socket migration (Onsten et al. Citation1993).
Revision rates for porous-coated cups vary between 2% and 32% (Engh et al. Citation1994, Jazrawi et al. Citation1999, Thanner et al. Citation1999, Soto et al. Citation2000, Spicer et al. Citation2001, Iwase et al. Citation2002, Reikeras and Gunderson Citation2002, Jacobsen et al. Citation2003) and osteolysis poses the greatest threat to long-term survival of cementless arthroplasties (Engh et al. Citation1994). Defects adjacent to the acetabular component are difficult to detect and quantify from plain radiographs (Zimlich and Fehring Citation2000), and consequently the amount of bone loss is often underestimated. By different oblique projections, radiographic detection of defects has become possible (Southwell et al. Citation1999), but a quantitative measure is still lacking.
DEXA scanning has evolved into an established method for detection of bone mass changes around prosthetic implants. This development is based on numerous methodological publications (Kilgus et al. Citation1993, Cohen and Rushton Citation1995, Mortimer et al. Citation1996, Smart et al. Citation1996, Gehrchen Citation1999, Engh Jr. et al. Citation2000, Rahmy et al. Citation2000, Schmidt et al. Citation2002). Several clinical trials based on these articles have been published, with reports of prosthesis performance after 3-, 5- or 10-year follow-up, or differences in BMD with different coatings or prosthetic designs (Engh et al. Citation1994, Kiratli et al. Citation1996, Munting et al. Citation1997, Sabo et al. Citation1998, Kärrholm et al. Citation1999, Yamaguchi et al. Citation2000, Wright et al. Citation2001). The femoral stem in total hip arthroplasty (THA) or the tibial plateau in total knee arthroplasty have been the preferred subjects of these investigations; whereas the acetabulum has more or less been left aside.
Changes in pelvic periprosthetic BMC are best detected using a 4-ROI model (Wilkinson et al. Citation2001, Laursen et al. Citation2005). The few scattered longitudinal studies that have been published have shown a universal decrease in periacetabular BMC, but no localized demineralization (Korovessis et al. Citation1994, Sabo et al. Citation1998).
We investigated whether DEXA can detect and quantify experimental defects around cementless metalbacked acetabular components.
Material and methods
Laboratory techniques
10 female pelvis specimens were obtained from the Institute of Anatomy at Aarhus University, after 6 months of preservation in a solution of alcohol and formaldehyde. All soft tissues were removed mechanically, the hips were exarticulated and the spine was excised through discus L5-S1. The specimens were kept at 4°C between laboratory procedures. To facilitate handling, each specimen was fixed to a wooden plank using 3 screws through os sacrum (). The left acetabulum was chosen for experiments because one of the subjects had had a right hip replacement due to fracture sequelae. There was no macroscopic evidence of pathology. Preparation of the acetabulum included removal of remnants of the joint capsule and the labrum, and reaming with a standard hemispherical reamer (Zimmer, Warsaw, IN) to remove cartilage, but the subchondral cortical bone was preserved. A cementless cup of the same size as the last used reamer was chosen to avoid fractures during repeated cup insertions.
Figure 1a. Photo of specimen showing cup placement.
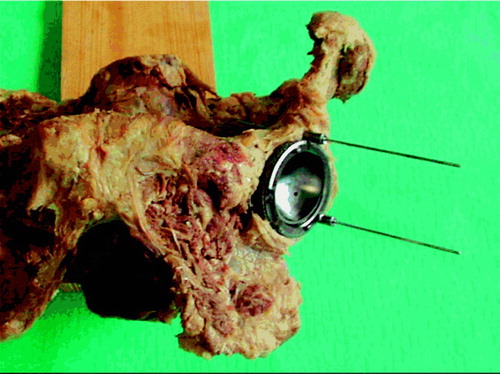
Figure 1b. Photo of specimen showing drill-guide Kirschner wire placement.
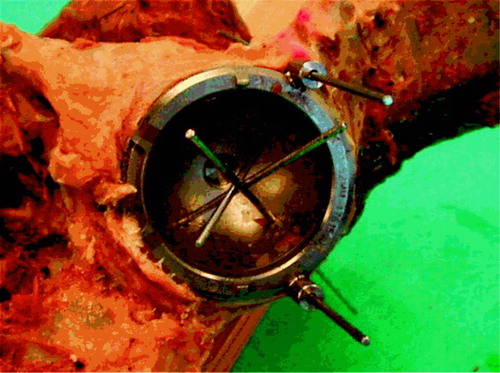
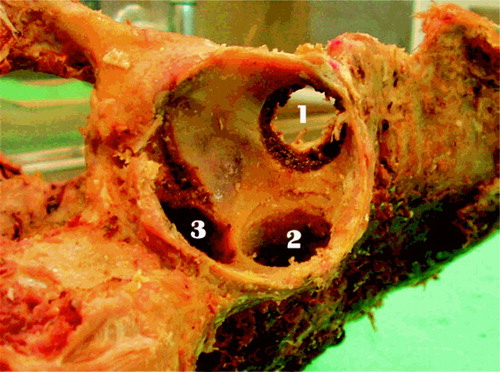
Figure 1c. Photo of specimen showing 20×20mm defects.
Implants
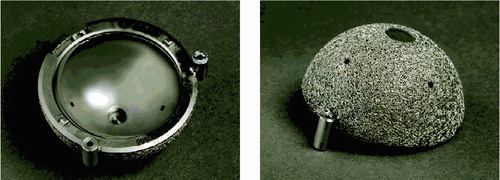
We used the Trilogy cup (Zimmer), shaped like a true hemisphere with a core of titanium alloy (Ti-6Al-4V) and covered with a fiber mesh of technically pure titanium. The cups were modified as follows. To secure the exact repositioning between procedures where the cup was removed, two barrels were attached to its outer rim. The barrels were cannulated for 2-mm Kirschner wires, perpendicular to the opening plane of the cup () placed at its outer rim, at a 120-degree internal angle. To secure uniformity in the procedure of creating defects, each cup had three 2-mm holes. These holes were placed half a radius away from the center at 90-degree internal angles, and perpendicular to the outer plane of the cup. To adjust these placements to the different cup sizes, the angles were transformed to coordinates that could be entered into the equipment in our mechanical laboratory. After the first insertion of the cups, 2 Kirschner wires were drilled through the barrels and the underlying bone. The entry and exit holes were marked, and the placement-guide Kirschner wires were removed. Before creating the defects, we measured the baseline BMC in each specimen twice with the cup in situ.
Figure 2. Cup with placement-guide barrels and drill-guide holes.
Scanning technique
Measurements were performed with the Norland XR-36 Bone Densitometer (dual-energy X-ray absorptiometer) with pencil beam, using a stationary anode X-ray tube, 100kV constant potential, 1mA constant anode current, and samarium filter (K-edge = 46,8 keV; minimum filtration is 3 mm aluminum equivalent). The detectors were two NaI scintillation detectors in pulse counting mode. Software was version 3.9.4/2.1.0. Scans were performed in the “research” mode with a resolution of 0.5 × 0.5 mm and a speed of 60 mm/s. Calibration was performed daily with two different phantoms according to the manufacturer’s prescriptions. The DEXA scans were measured according to the 4-ROI model of Wilkinson et al. (Wilkinson et al. Citation2001, Laursen et al. Citation2005) ().
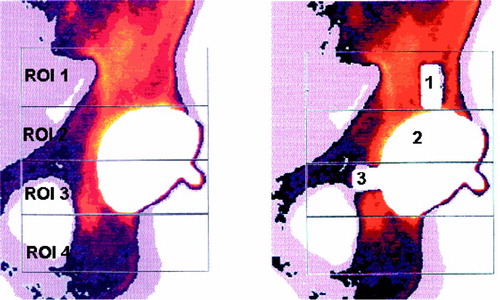
Figure 3. DEXA scan marked with the modified Wilkinson regions of interest (ROIs) with 10×20 mm defects (left) and with metal spacers in the defects (right).
Creating defects
A flow chart for the laboratory procedures is shown in . After the baseline scans, the drillguide Kirschner wires were inserted through the drill holes in the cups. The cups were removed. A hole was drilled at each of the 3 K-wire marked positions with a cannulated 10-mm drill bit with depth stop at 10 mm (). All drilling debris was collected into a test tube. When all 3 holes had been drilled, drill bits and drillguide Kirschner wires were removed. The placementguide Kirschner wires were then reinserted into their marked places, and the cup was slid into position with the placementguide Kirschner wires in their corresponding barrels. DEXA scan was repeated. The procedure of drilling and scanning was repeated twice, with drill bits of 10 × 20 mm and 20 × 20 mm. The last scan was done as a double measurement in the same way as the first (endlinescans). In one specimen, a set of supplementary scans were performed with metal spacers inserted into the defects (), and for visualization purposes the specimen was radiographed with these metal spacers (). The supplementary scans with inserted metal spacers revealed that the defect from position 1 was located in ROI 1, position 2 in ROI 2 and position 3 in ROI 3.
Figure 4. Flow diagram of laboratory procedures.
Figure 5. Photo of 20×20 mm drill bit with Kirschner wire.
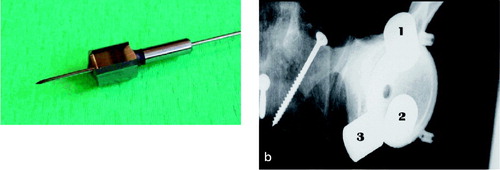
Figure 6. Radiographic depiction of the cup with metallic spacers in 20×20 mm defects. AP. a. Anteroposterior. b. 45° obturator oblique. c. Lateral view.
Ash weight
The test tubes were kept at –80°C until the ashing procedure. We used a standard ashing protocol, consisting of drying at 110°C for 24 h and ashing at 600°C for 24 h (Griffin et al. Citation1993, Fink et al. Citation2002). The test tubes were weighed before use and after ashing.
Data acquisition
The first and the last DEXA scans were performed twice in each specimen, for calculation of measurement repeatability. For other calculations, the ther analyses. Differences in BMC were calculated first of the two results was employed. In 1 specifrom the DEXA scans performed after the drilling men (no. 251) there was a considerable difference procedures with respect to the baseline scan. Ash between the two baseline scans. After re-evaluaweights were calculated as difference between the tion, one of these was judged as a technical failure weight of the test tubes before use and after the and the corresponding data were omitted from furashing procedure, corrected for the average weight loss of 10 empty test tubes that were exposed to the same ashing procedure (0.0001 ± 0.0002). To match the fact that we calculated the BMC differences with respect to the baseline scans, the ash weights of each defect were accumulated. This gave 3 sets of data where each of the 10 specimens had a baseline scan, and 3 “after drilling” BMC differences with corresponding ash weights: set one containing data for ROI 1 and ash weights from drilling in position 1, set two concerning ROI 2 and position 2 and set three for ROI 3 and position 3 ().
Table 1. All data.
Statistics
The clinical problem was as follows. Can a measured decrease in BMC be correlated to a quantitative measure of missing bone? Thus, in this in-vitro study the hypothesis to be tested was: can a measured difference in BMC be correlated to the amount of bone removed? Consequently, we adhered to the model that a straight line describes the correlation.
Sample size was dictated by practical circumstances. At the time of our experiments, the maximum obtainable number of specimens of the same sex, without acetabular pathology, was 10. The statistical analysis was performed using SPSS version 12.0.2 for Windows, as a linear mixed model, taking within-subject variation into account by adding individual intercepts (thereby assuming intra-class correlation). We performed the statistical analysis on the complete dataset, and after splitting up into groups according to ROI. Plotting the values raised the suspicion of greater variation in the higher values than in the lower ones (). For that reason, we transformed the dataset (ln (1+x), due to a few negative values) and performed the analysis again, with same result.
Figure 7. Diagram showing relationship between ash weights and BMC – one line per specimen in each ROI.
The model diagnostics included a plot of residuals against the fitted values and a q-q plot of the residuals. These plots confirmed normally distributed errors and variance homogenicity; hence, the adequacy of the analysis was approved.
Ethics
The procedures were in accordance with the ethical standards of the committee of scientific ethics for Viborg and Northern Jutland County (approval no. VN 98/24) and with the Helsinki Declaration of 1975, as revised in 1983. Informed consent was obtained while the subjects were still alive and had decided to donate their bodies to science and education.
Results
Statistical analysis performed on the total dataset showed no useful association between the values, but after splitting up according to the different ROIs the association between BMC and ash weight showed high significance in each of the three regions (p < 0.001; adjusted R2 = 0.93, 0.80 and 0.82 for regions 1, 2 and 3, respectively). The difference between the regions is seen in the slopes in (see also ). All data are presented in , and summarized as output from the linear regression analysis in . The results of the statistical analysis should be understood as follows: If a BMC difference of 0.82 g is detected in ROI 1, it corresponds to a defect where 1 g of minerals has disappeared. No defects were created in ROI 4 in this study; hence, the BMC measurements from this region serve as controls for the other measurements.
Table 2. Linear mixed model analysis of correlation between Δ BMC and Δ ash weight
Repeatability
In the calibration process, the DEXA scanner provides its internal precision CV%. During the days of the experiments, it varied between 0.54 and 0.67, according to the routine daily calibrations. In the experimental set-up, we performed double measurements in the DEXA scanner, and when weighing out the test tubes. Assuming that the instruments had only random errors, and adhering to ISO1998 International Standard and definitions of repeatability conditions (Ranstam et al. Citation2000), the repeatability limit for BMC measurements was 0.23 g (SD 0.12, n = 86); corresponding values for ash weights were 0.00097 g (SD 0.0005, n = 10). (Repeatability = 1.96 × √Σd2/n, where d = paired difference between repeated measurements of the same object and n = number of pairs of measurements).
Discussion
The purpose of this study was to investigate whether DEXA can detect and quantify bony defects around cementless metal-backed acetabular components. Using a cadaver model, we created standardized defects of increasing sizes in different locations. The precision of the measurements, and the correlation between the measured decrease in BMC and the actual amount of bone removed was very high in our experiments. Our main conclusion is that in DEXA scanning of the periacetabular bone around cementless hemispherical metal-backed cups, the 4-ROI model (Wilkinson et al. Citation2001, 2003) provides a sensitive measure of changes in bone mineral content. Clinically, this provides assistance in detection of osteolytic lesions, which contrasts with the ability of standard radiographs (Engh et al. Citation2000). In the future, we hope to provide a useful guide when planning revision cases where osteolysis is suspected (are special implants or tools needed? How much allograft should be prepared?) (Schmalzried et al. Citation1998). In a clinical study, we have previously shown that BMC measurement has high reproducibility (Laursen et al. Citation2005). The present study takes account of the fact that the measured BMC values are actually derived from the bone.
Relying on radiographic examinations, a possible detection rate of 94% of all periacetabular defects can be obtained by adding 3 different oblique projections to the standard AP and lateral radiographs (Southwell et al. Citation1999). In contrast, the use of DEXA scanning provides an estimate of 1 g defect per 0.8 g measured BMC loss (95% CI: 0.72–0.93) by DEXA scan only in the AP-plane. Investigations that are already in progress will show whether this is acceptable for clinical use. Positioning of the patient in the scanner is perhaps even more important than originally anticipated, since the complex 3D structure of the pelvis exerts as great influence on the measurements as reported in this study. This problem will be examined in a future study. If necessary, improvement of our method could combine the AP-scan with scans in other positions.
Some weaknesses of our study are the procedure of sampling the drilling debris from the acetabulum (by picking it up with forceps) and also the risk of compacting some of the bone debris into the surrounding tissue when drilling.
We found that even small osteolytic lesions can be detected by DEXA. If all patients were DEXA scanned routinely once or twice within the first postoperative year, later decision making and planning of a revision procedure would be easier and more precise.
We wish to thank Associate Professor Peter Holm-Nielsen, Institute of Anatomy, Aarhus University, who kindly provided the specimens. We also thank Associate Professors Malene Højbjerre and Søren Lundbye-Christensen, Statistics Laboratory, Institute of Mathematical Sciences, Aalborg University, for invaluable guidance on statistics.
The study was supported by grants from Zimmer Scandinavia.
Author contributions
MBL was involved in study conception and design, “surgery” data acquisition and analysis, and writing of the manuscript. PTN was involved in study conception and design, data analysis and critical review of the manuscript. KS was involved in study conception and design, data analysis and critical review of the manucript.
- Cohen B, Rushton N. Accuracy of DEXA measurement of bone mineral density after total hip arthroplasty. J Bone Joint Surg (Br) 1995; 77: 479–83
- Engh C A, Hooten J P, Jr, Zettl-Schaffer K F, Ghaffarpour M, McGovern T F, Macalino G E, Zicat B A. Porous-coated total hip replacement. Clin Orthop 1994, 298: 89–96
- Engh C A, Jr, McAuley J P, Sychterz C J, Sacco M E, Engh C A, Sr. The accuracy and reproducibility of radiographic assessment of stress-shielding. A postmortem analysis. J Bone Joint Surg (Am) 2000; 82: 1414–20
- Fink C, Cooper H J, Huebner J L, Guilak F, Kraus V B. Precision and accuracy of a transportable dual-energy X-ray absorptiometry unit for bone mineral measurements in guinea pigs. Calcif Tissue Int 2002; 70: 164–9
- Gehrchen P M. Quantitative measurements of adaptive bone remodeling in the proximal femur following uncemented total hip arthroplasty using dual energy X-ray absorptiometry. Danish National Hospital, University of Copenhagen. 1999, Thesis
- Griffin M G, Kimble R, Hopfer W, Pacifici R. Dual-energy x-ray absorptiometry of the rat: accuracy, precision, and measurement of bone loss. J Bone Miner Res 1993; 8: 795–800
- Iwase T, Wingstrand I, Persson B M, Kesteris U, Hasegawa Y, Wingstrand H. The ScanHip total hip arthroplasty: radiographic assessment of 72 hips after 10 years. Acta Orthop Scand 2002; 73: 54–9
- Jacobsen S, Jensen F K, Poulsen K, Sturup J, Retpen J B. Good performance of a titanium femoral component in cementless hip arthroplasty in younger patients: 97 arthroplasties followed for 5–11 years. Acta Orthop Scand 2003; 74: 375–9
- Jazrawi L M, Bogner E, Della Valle C J, Chen F S, Pak K I, Stuchin S A, Frankel V H, Di Cesare P E. Wear rates of ceramic-on-ceramic bearing surfaces in total hip implants: a 12-year follow-up study. J Arthroplasty 1999; 14: 781–7
- Kärrholm J, Hultmark P, Carlsson L, Malchau H. Subsidence of a non-polished stem in revisions of the hip using impaction allograft. Evaluation with radiostereometry and dual-energy X-ray absorptiometry. J Bone Joint Surg (Br) 1999; 81: 135–42
- Kilgus D J, Shimaoka E E, Tipton J S, Eberle R W. Dual-energy X-ray absorptiometry measurement of bone mineral density around porous-coated cementless femoral implants. Methods and preliminary results. J Bone Joint Surg (Br) 1993; 75: 279–87
- Kiratli B J, Checovich M M, McBeath A A, Wilson M A, Heiner J P. Measurement of bone mineral density by dual-energy x-ray absorptiometry in patients with the Wisconsin hip, an uncemented femoral stem. J Arthroplasty 1996; 11: 184–93
- Korovessis P, Piperos G, Michael A. Periprosthetic bone mineral density after Mueller and Zweymueller total hip arthroplasties. Clin Orthop 1994, 309: 214–21
- Laursen M B, Nielsen P T, Soballe K. DXA scanning of acetabulum in patients with cementless total hip arthroplasty. J Clin Densitom 2005; 8(4)476–83
- Mortimer E S, Rosenthall L, Paterson I, Bobyn J D. Effect of rotation on periprosthetic bone mineral measurements in a hip phantom. Clin Orthop 1996, 324: 269–74
- Munting E, Smitz P, Van Sante N, Nagant d D, Vincent A, Devogelaer J P. Effect of a stemless femoral implant for total hip arthroplasty on the bone mineral density of the proximal femur. A prospective longitudinal study. J Arthroplasty 1997; 12: 373–9
- Onsten I, Akesson K, Obrant K J. Periarticular bone mineral content in rheumatoid arthritis and arthrosis of the hip. Dual photon X-ray absorptiometry in 53 cases. Acta Orthop Scand 1993; 64: 530–2
- Rahmy A I A, Tonino A J, Tan W, Ter Riet G. Precision of dual energy X-ray absorptiometry in determining periprosthetic bone mineral density of the hydroxyapatite coated hip prosthesis. Hip Int 2000; 10: 83–90
- Ranstam J, Ryd L, Onsten I. Accurate accuracy assessment: review of basic principles. Acta Orthop Scand 2000; 71: 106–8
- Reikeras O, Gunderson R B. Failure of HA coating on a gritblasted acetabular cup: 155 patients followed for 7–10 years. Acta Orthop Scand 2002; 73: 104–8
- Sabo D, Reiter A, Simank H G, Thomsen M, Lukoschek M, Ewerbeck V. Periprosthetic mineralization around cementless total hip endoprosthesis: longitudinal study and cross-sectional study on titanium threaded acetabular cup and cementless Spotorno stem with DEXA. Calcif Tissue Int 1998; 62: 177–82
- Schmalzried T P, Fowble V A, Amstutz H C. The fate of pelvic osteolysis after reoperation. No recurrence with lesional treatment. Clin Orthop 1998, 350: 128–37
- Schmidt R, Muller L, Kress A, Hirschfelder H, Aplas A, Pitto R P. A computed tomography assessment of femoral and acetabular bone changes after total hip arthroplasty. Int Orthop 2002; 26: 299–302
- Smart R C, Barbagallo S, Slater G L, Kuo R S, Butler S P, Drummond R P, Sekel R. Measurement of periprosthetic bone density in hip arthroplasty using dual-energy x-ray absorptiometry. Reproducibility of measurements. J Arthroplasty 1996; 11: 445–52
- Soto M O, Rodriguez J A, Ranawat C S. Clinical and radiographic evaluation of the Harris-Galante cup: incidence of wear and osteolysis at 7 to 9 years follow-up. J Arthroplasty 2000; 15: 139–45
- Southwell D G, Bechtold J E, Lew W D, Schmidt A H. Improving the detection of acetabular osteolysis using oblique radiographs. J Bone Joint Surg (Br) 1999; 81: 289–95
- Spicer D D, Schaper L A, Pomeroy D L, Badenhausen W E, Jr, Curry J I, Suthers K E, Smith M W. Cementless cup fixation in total hip arthroplasty after 5–8 years. Int Orthop 2001; 25: 286–9
- Thanner J, Karrholm J, Malchau H, Herberts P. Poor outcome of the PCA and Harris-Galante hip prostheses. Randomized study of 171 arthroplasties with 9-year follow-up. Acta Orthop Scand 1999; 70: 155–62
- Wilkinson J M, Peel N F, Elson R A, Stockley I, Eastell R. Measuring bone mineral density of the pelvis and proximal femur after total hip arthroplasty. J Bone Joint Surg (Br) 2001; 83: 283–8
- Wilkinson J M, Hamer A J, Rogers A, Stockley I, Eastell R. Bone mineral density and biochemical markers of bone turnover in aseptic loosening after total hip arthroplasty. J Orthop Res 2003; 21: 691–6
- Wright J M, Pellicci P M, Salvati E A, Ghelman B, Roberts M M, Koh J L. Bone density adjacent to pressfit acetabular components. A prospective analysis with quantitative computed tomography. J Bone Joint Surg (Am) 2001; 83: 529–36
- Yamaguchi K, Masuhara K, Ohzono K, Sugano N, Nishii T, Ochi T. Evaluation of periprosthetic bone-remodeling after cementless total hip arthroplasty. The influence of the extent of porous coating. J Bone Joint Surg (Am) 2000; 82: 1426–31
- Zimlich R H, Fehring T K. Underestimation of pelvic osteolysis: the value of the iliac oblique radiograph. J Arthroplasty 2000; 15: 796–801