Abstract
Background and purpose Considerable migration of the acetabular cup is required for diagnosis of loosening by conventional radiography. We have developed a new clinically applicable method for assessment of cup loosening using computed tomography (CT).
Patients and methods 10 patients scheduled for revision hip replacement due to suspected wear or loosening were scanned twice with CT under torsion loading of the prosthesis. Two independent examiners assessed each patient with respect to motion of the acetabular cup relative to the pelvis using CT volume registration. The CT measurements were compared to findings at revision surgery.
Results The method was applicable in 8 of the 10 patients. 1 patient had a severe tremor. In 1 patient, surgery revealed that the hip was ankylotic due to massive ectopic bone formation. This left 8 patients that could be evaluated. 4 cups were loose at surgery, and 3 of these cups could be seen to be mobile by CT. 4 cups that were stable on revision were accurately diagnosed as not being mobile by CT. Movements of less than 1 millimeter between bone and prosthesis could not be distinguished from errors in CT acquisition and volume registration. There was good agreement between the two observers.
Interpretation Movement of loose acetabular cups during torsion loading could be detected using CT volume registration. It was sensitive to cup movement in 3 out of 4 cases of loose cups. The method was specific and yielded no false positive results.
Current multislice CT offers highly accurate spatial volume resolution without significant distortion. Metal artefacts, historically contraindicating CT examinations in the presence of implants, are now reasonably well suppressed by software algorithms provided by the manufacturers of CT equipment. Modern scanners are fast; a hip scan can be performed in seconds.
Previous studies by our research group have shown that CT can be used for evaluation of acetabular cup wear, position, and migration (Olivecrona et al. Citation2002, Citation2004, Citation2005). In this study we assessed a clinically feasible CT method for determination of loosening of the cup using two different CT volumes (examinations) with torsion loading of the affected hip in internal and external rotation, acquired in direct sequence. 10 patients who were scheduled for revision hip surgery because of wear or loosening were investigated using specialized software to merge the two CT volumes, and the scans were analyzed for definite signs of acetabular loosening, i.e. movement of the acetabular component relative to the surrounding bone. We evalu‐ated the method for sensitivity and specificity by comparison of the results to findings at revision surgery.
Patients and methods
10 patients (6 men) who had undergone primary total hip replacements and later presented with complaints of hip/leg pain, and who were scheduled for revision hip surgery were included in this study (). The patients were selected in consecutive order from the waiting list for revision hip surgery, the only inclusion criteria being a minimum age of 50 years (to avoid exposure of fertile women to radiation) and willingness to participate in the study. Median patient age at revision was 62 (53-79) years. 3 patients had bilateral implants. 4 of the implants studied were uncemented, and 6 were cemented. The Karolinska Institute Ethics Committee North approved the study (ref. 03-370), and informed written consent was obtained from all patients. 2 CT examinations of each hip were done, using a four‐detector-row CT scanner (LightSpeed QX/I, General Electric Medical Systems, Milwaukee, WI). One scan was obtained with the hip internally rotated; the second scan was obtained with the hip externally rotated. The patients were asked to lie still in the scanner, and the leg was held in position manually by an examiner. An effort was made to load a torsion force to the hip by bringing the leg to the maximum possible internal and external rotation without causing the patient pain. Scans from crista iliaca to the tip of the femoral prosthesis were aquired in 3 segments. The radiation dose was calculated to be 3.5 milliSievert (mSv) per scan. Only the slices around the cup were used for this study. The approximate radiation dose for this segment of the scans was calculated to be 2.5 mSv. The segment involved 50 slices, acquired with 1.25 mm collimation and a pitch of 3, at 200 mA, and 120kV. Slices were reconstructed at 1.25 mm increments. The x‐y pixel size varied from 1.30 to 1.66 mm. The original CTs were reconstructed into a matrix size of 512x512 with the number of slices varying between 214 and 309. The matrix size was reduced to 256 x 256 for this experiment.
Indications for and findings at revision surgery, and on registered CT volumes
Image analysis
The image analysis was performed using a 3D volume fusion tool, which has been described previously and validated extensively (Noz et al. Citation2001, Olivecrona et al. Citation2002, Gorniak et al. Citation2003). This semi‐automated tool has a graphical interface and is used to perform landmark‐based fusion of two volumes, registering the “target” volume with the “reference” volume. A technical description can be found in our previous publications (Olivecrona et al. Citation2002, Citation2003a, b).
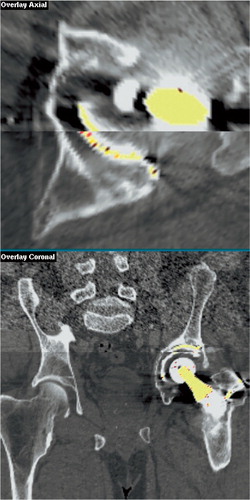
Two independent examiners, one fourth‐year medical student (examiner 1) and one orthopedic surgeon (examiner 2) analyzed the images independently of each other. The first step of the image analysis was to register the pelvis, i.e. one volume (the target) was moved so that the pelvis in both of the patient's scans was brought into spatial alignment. This generated a new volume, the “transformed volume”, which was viewed together with the unmoved “reference volume”. To register the pelvis, the examiners placed a series of landmarks on corresponding points in the bone surrounding the acetabular cup in the pair of CT volumes. This was done by viewing the two volumes simultaneously as slices side‐by-side on the computer screen, and using the pointing device of the computer to designate co‐homologous points in the two volumes. Landmarks were spread throughout the volumes in all planes, to maximize the overall match; however, special attention was paid to the areas immediately surrounding the acetabulum and ipsilateral to the affected side. These landmarks were then used to register the pelvis using a rigid body transformation. shows two CT scans after registration.
Figure 1. Superimposed axial (close‐up) and coronal (overview) slices through bone and an unstable cemented prosthesis after registration of two CT volumes. The top half of each image is the reference volume; the bottom half is the volume that has been moved so that the pelvis is in the same position using image registration (the “transformed volume”). Note that there is no mismatch in the bone morphology between the volumes, indicating that the pelvis is in almost the same position in both scans. The implant is not matched, however, indicating movement.
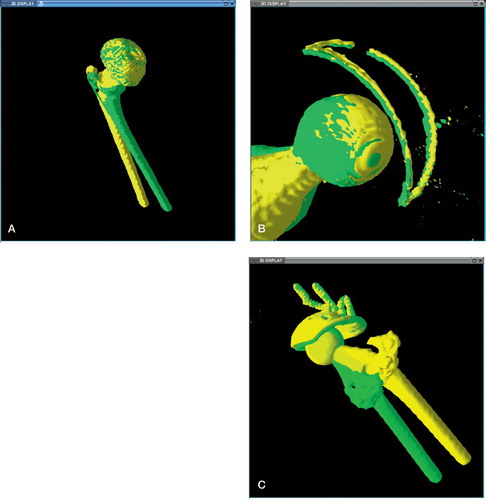
Secondly, the two examiners studied the registered volumes separately and were asked to identify in which patient movement of the acetabular prosthesis relative to the surrounding bone could be established visually. A combination of matched bone and mismatched prosthesis in 2D- or 3D images was interpreted as movement of the prosthesis ( and ). The examiners had no knowledge of patient history or findings at revision surgery.
Figure 2. 3D shaded superimposed displays of implant after volume registration of the pelvis. A. Stable uncemented implant after registration. Note how the two colors mix, indicating no detectable movement of the cup. The femoral stem has not been matched, due to movement of the leg from internal to external rotation. The striations are an artifact of the limited resolution of the CT data. B. Loose cemented implant; note the subtle tilting of the metal wire marker in the cup. C. A loose cemented implant and acetabular cage. Note better matching of broken screws incorporated in the registered pelvis, than in the rest of the implant, which has moved between the scans.
Finally, the findings from the image analysis were compared to findings at revision surgery.
Evaluation of errors
To establish how well the pelvis could be registered, two observers with experience of volume registration over several years (examiner 2 and a radiologist) reviewed all registered volumes and visually graded the registration of the bone and the cup matching in 3D after registration of the pelvis using a three‐grade scale (< 1 mm registration error, 1 mm error, or > 1 mm error), and made a visual estimation of the magnitude of cup movement. This analysis was also done without knowledge of patient history or findings at revision surgery.
The method was evaluated numerically by using the point pairs (landmarks) chosen for the volume transformation. The polynomial equations used to generate the transformed volume were applied to the original landmarks associated with the untrans‐formed “target” volume. The resulting locations were compared to those associated with the landmarks originally chosen in the reference volume. The standard deviation of the sample (N-1), standard error of the mean, mean value, maximum value, and minimum value of the distance differences were calculated for each voxel (x, y, z), for each pixel (x, y), and for each direction separately. Ideally, these differences should be zero. Analysis of variance on unequal sample sizes was per formed to determine whether the landmarks were consistently chosen within a particular volume set and across all the volume sets. A histogram, box plot, density plot, and a quantile‐quantile plot of the landmark distance difference values were drawn to find the median error and to check that the landmark distance difference data were close to normal. A two‐tailed Student's t‐test was also applied to these data to determine the maximum voxel error.
The volume data were then limited by drawing a region of interest (ROI), which included only the hip (right or left) with the problematic prosthesis, on a representative axial slice in each volume. All the pixel values outside this small region throughout the volumes (this ROI was placed on each slice throughout the volume) were set to zero, so that now each volume contained only the pelvis adjacent to the prosthesis and the prosthesis itself. From this new volume, 3 slices that contained bone only (cranial to the prosthesis) and 3 slices that contained bone and prosthetic cup (cranial to the prosthetic femoral head) were selected. A cross‐correlation was run on the slices with bone only and the slices with bone plus prosthesis, both before and after the transformation. When calculating the cross‐correlation for the slices containing the prosthesis, the lowest intensity value to be used was set to be above the bone intensity threshold value. This was done for each observer separately. For bone, the cross‐correlation should be much higher after registration than before registration, if the registration was successful. However, for the prosthesis, it was expected that a loose prosthesis would be less aligned than the surrounding bone, resulting in a noticeable difference in cross‐correlation value.
Results
Of the 10 patients, 8 were eligible for evaluation. One patient (no. 8) was excluded due to tremor, which resulted in deformation of the CT volumes. For this patient most of the bone was well matched, but there were movement artifacts that deformed the image of the bone. Thus, this case could not be safely analyzed for movement of the prosthesis.
The second patient to be excluded was no. 3, due to the fact that this patient had clinical ankylosis of the affected hip, confirmed at surgery. In clinical practice, an ankylotic hip would not be scheduled for examination since a provocation method would not be applicable, and consequently this case was excluded from the analysis of cup movement.
This left 8 patients for assessment. In 4 patients with loose cups, movement of the cup was detected in 3 cases. In 4 patients in whom the cup was not loose, no cup movements were detected. Both observers had the same results. Indications for revision surgery and the operative findings are compared to findings on registered CT volumes in . When all cases were reviewed together with the radiologist, the result was the same. All volumes were matched within 1 mm. Movement in the loose cups was estimated to be between 1 and 3 mm. illustrates the cup with the largest movement. Since the registration error of the pelvis was up to 1 mm, possible acetabular cup movements of less than 1 mm could not be distinguished from slight mismatch of the bone. In the false negative patient (no. 10), slight rotation of the cup was seen but this could not be distinguished from a slight registration error. Consequently, the provocation method was applicable in 8 out of the 10 patients. Movement of loose acetabular cups during torsion loading could be demonstrated using CT volume registration. The latter was sensitive to cup movement in 3 out of 4 loose cups. The method was specific, and yielded no false positive results. and show registered CT scans in 2 and 3 dimensions.
Analysis of variance on unequal samples showed that the landmark choice was not significantly different between observers and across patients (p > 0.05). The differences in landmark distance were close to normal for both observers and for all patients. The box plot shows that the median difference in landmark distance was within one CT voxel, confirming that the visual results of the registrations were better than 1 mm (). This was also confirmed by Student's t‐test, which showed that all the differences in landmark distance were not significantly different from 1 mm (p < 0.05).
Figure 3. Histogram, box plot, density plot, and normal quantile‐quantile plot for differences in landmark distance after registration in millimeters. Both the histogram and the box plot show that the median of the landmark errors is within 1 mm. Also, the density and normal quantile‐quantile plots show that the data are close to being normally distributed, with a tail extending to the right.
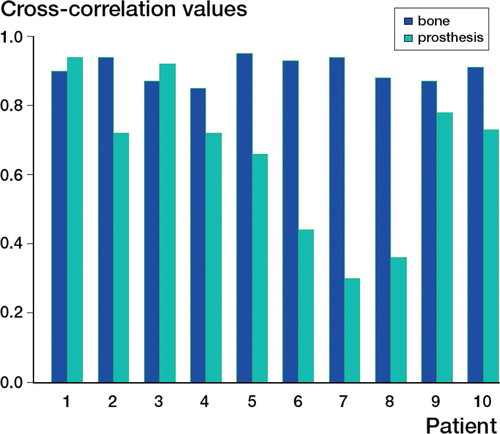
The cross‐correlation calculation between the registered and unregistered volume for the bone showed that the bone was well registered in every case after the registration, but not before. The average cross correlation of bone before registration was 0.42 (0.12-0.75) and the average cross correlation of bone after registration (for both examiners) was 0.90 (0.85-0.95). By contrast, a plot of the cross‐correlation values obtained for bone after the registration together with the cross correlation for the prosthesis after registration, showed that some prostheses were not well aligned and should correlate to movement of the prosthesis between scans (). However, in this small material, the difference in cross correlation of a stable and loose cup was small; therefore, no clear cut‐off value can be established.
Figure 4. A plot of the cross‐correlation values obtained for bone after the registration is contrasted to the cross correlation for the prosthesis after registration. Surgery showed that cups 3, 5-8, and 10 were loose. Hip ankylosis excluded cup 3, and tremor excluded cup 8 from analysis.
Discussion
Routine radiographic evaluation of THA makes use of serial radiographs. If no special measures are taken, the accuracy of migration measurements of acetabular cups on conventional radiographs is seldom better than 5 mm at the 95% confidence level (Malchau et al. Citation1995). Thus, diagnosis of acetabular cup loosening on routine planar radiographs normally relies on detection of linear osteolysis. Since osteolysis is grossly under‐diagnosed using radiographs, a safe diagnosis of implant loosening is late using radiographs. Detecting implant loosening at an earlier stage would help the surgeon intervene before widespread osteolysis necessitates more extensive revision surgery. Also, excluding loosening as the cause of unexplained hip pain could save the patient an unnecessary operation.
Definite proof of loosening is given by a shift in position (migration) of the implant greater than an accepted limit on successive examinations. A clear cut‐off value for clinically relevant migration has not been established. Some implants have been shown to migrate in the postoperative period without going on to clinical loosening, and acceptable movement probably varies depending on implant design (Kärrholm et al. Citation1997). Radio stereometry (RSA) studies demonstrating subsidence of the femoral stem or proximal migration of the acetabular cup of 1-2 mm during the first 1-2 years after surgery has proven to be of value in predicting risk for short- or intermediate‐term revision (Kärrholm et al. Citation1997). Krismer et al. (Citation1996) used Ein‐Bild-Roentgen‐Analyse (EBRA) to demonstrate that proximal migration of more than 1 mm of 2 different cementless acetabular designs predicted late loosening.
CT is the modality of choice for assessment of periprosthetic osteolysis, and serial scans have been proposed as a method for monitoring osteolysis, thereby facilitating the planning and timing of revision surgery (Stulberg et al. Citation2002). The evolving techniques for volume fusion allow integrated display of multiple data sets. Our research group has devised a method for study of the migration of orthopedic implants using CT and a semi‐automated volume fusion tool. Previous patient- and phantom‐based studies from our group reported on the use of CT for position, wear, and migration measurements (Olivecrona et al. Citation2002, [7]Citation2003a, b, Citation2004, Citation2005).
In this study, 10 patients were scanned twice on the same day with the affected prosthetic hip “provoked” in internal and external rotation. The radiation exposure in our examination was at the same level as exposure for a CT of the abdomen. In a previous study (Olivecrona et al. Citation2002) clinical scans using a single‐slice CT unit with a radiation dose of 0.8 mSv were used for registering the pelvis. Although the imaging of the periprosthetic bone was not as good as with modern multidetector‐row CT units, the same accuracy as in the present study was obtained. By focusing the scanned area to include only the segment around the cup, the dose could probably be limited to 1 mSv with the currently available scanners while preserving adequate imaging of the bone. A simple protocol was used: the patient's leg was held manually, and no devices were used to secure the patient to the CT‐scanner bed. 8 of 10 patients could be analyzed in this pilot study. Image post‐processing included volume registration, and the implant was studied for movement relative to the pelvis. In 3 of the 4 patients who had a loose cup, confirmed at surgery, we could demonstrate that the prosthesis was indeed loose. The actual movement of the cups was small, estimated to be 1-3 mm. Althought conspicuous on registered CT images, these small movements could easily go undetected on routine radiographs. The method yielded no false positive results; however, the study indicated that implant movement less than 1 mm could not safely be distinguished from registration errors— but if the movement between bone and prosthesis was more than 1 mm, it could be detected. In a previous patient study, we found the same degree of accuracy, i.e. better than or at the 1-mm level (Olivecrona et al. Citation2002). In previous phantom studies, this accuracy was nearly doubled, showing that the registration algorithm used is valid (Olivecrona et al. Citation2003a, b). Note that the accuracy of the registration is generally better than the smallest image element (the “voxel”) in the volumes. This is achieved by the same strategy that is employed in the RSA method: using an over‐determined number (more than the minimum of 4) of co‐homologous landmark points for registration.
This study has some limitations. The patients were already scheduled for revision surgery. Ideally, the cohort should be patients with unexplained complications after hip replacement that routine clinical and radiographic workup fail to diagnose. The preoperative radiographic findings should have been included in the study. However, this study was planned to explore whether CT provocation of a prosthetic hip was at all possible. For this, we chose the findings at revision surgery as the gold standard with which to compare the findings of the CT method. We did not seek to compare the results to radiographs, because this would require a protocol for preoperative interpretation of radiographs. Thus, this study does not establish whether the method improves the diagnosis compared to routine radiographs, and we have not proven that the method gives any information that is not obvious on the preoperative radiographs. Secondly, we do not know whether the femoral component can be monitored using the same protocol. This question will require further studies. Finally, the study was performed using a fourth‐generation CT scanner with four detectors. The currently available scanners are faster and have a better volume resolution, using up to 64 detectors. Using currently available high‐speed-acquisition CT and placing the patient rigidly on the CT bed while holding the foot securely in a device might improve the sensitivity further.
We believe that CT and volume registration of pairs of volumes, acquired as serial scans over time or under torsion loading of the prosthesis, has a place in the diagnostic arsenal for patients with unexplained pain after THA.
In summary, movement of loose acetabular cups during torsion loading could be demonstrated using CT volume registration. It was sensitive to cup movement in 3 out of 4 cases of loose cups. The method was specific, with no false positive results.
Contributions of authors
GQM and MEN wrote and validated the fusion software. MPZ incorporated the extension to 3D visualization techniques and the 2 color scale option. MEN did all the statistics. JK and HO did the image analysis. LW, PA and LO devised the study and participated in writing. LO and LW did patient collection for the study. HO was the principal author of the manuscript.
No competing interests declared.
- Gorniak RJT, Kramer E L, Maguire G Q, Jr, Noz M E, Schettino C J, Zeleznik M P. Evaluation of a semi-automatic 3D fusion technique applied to molecular imaging and MRI brain/frame volume data sets. J Med Syst 2003; 27(2)141–56
- Kärrholm J, Herberts P, Hultmark P, Malchau H, Nivbrant B, Thanner J. Radiostereometry of hip protheses. Review of methodology and clinical results. Clin Orthop 1997; 344: 94–110
- Krismer M, Stockl B, Fisher M, Bauer R, Mayrhofer P, Ogon M. Early migration predicts late aseptic failure of hip sockets. J Bone Joint Surg (Br) 1996; 78(3)422–6
- Malchau H, Kärrholm J, Wang Y X, Herberts P. Accuracy of migration analysis i hip arthroplasty. Digitized and conventional radiography, compared to radiostereometry in 51 patients. Acta Orthop Scand 1995; 66: 418–24
- Noz M E, Maguire G Q, Jr, Zeleznik M P, Kramer E L, Mahmoud F, Crafoord J. A versatile functional-anatomic image fusion method for volume data sets. J Med Syst 2001; 25: 297–307
- Olivecrona L, Crafoord J, Olivecrona H, Noz M E, Maguire G Q, Jr, Zeleznik M P, Svensson L, Weidenhielm L. Acetabular component migration in total hip arthroplasty using CT and a semi-automated program for volume merging. Acta Radiol 2002; 43: 517–27
- Olivecrona H, Olivecrona L, Weidenhielm L, Stark A, Noz M E, Maguire G Q, Jr, Zeleznik M P, Svensson L, Jonson T. Stability of Acetabular axis after Total Hip Arthroplasty. Repeatability using CT and a semiautomated program for volume fusion. Acta Radiol 2003a; 44: 653–61
- Olivecrona L, Olivecrona H, Weidenhielm L, Noz ME, Maguire GQ, Jr, Maguire GQ, Jr, Zeleznik MP. Model studies on acetabular component migration in total hip arthroplasty using CT and a semi-automated program for volume merging. Acta Radiol 2003b; 44: 419–29
- Olivecrona H, Weidenhielm L, Olivecrona L, Beckman M O, Stark A, Noz M E, Maguire G Q, Jr, Zeleznik M P, Svensson L, Jonson T. A new CT method to measure cup orientation after Total Hip Arthroplasty. A study on 10 patients. Acta Orthop Scand 2004; 75(3)253–60
- Olivecrona L, Jedenmalm A, Aspelin P, Weidenhielm L, Noz M E, Maguire G Q, Jr, Zeleznik M P, Olivecrona H. Assessing wear of the acetabular cup using computed tomography: an ex vivo study. Acta Radiol 2005; 46(8)852–7
- Stulberg S D, Wixson R L, Adams A D, Hendrix R W, Ber-nfield J B. Monitoring pelvic osteolysis following total hip replacement surgery: an algorithm for surveillance. J Bone Joint Surg (Am) (Suppl 2) 2002; 84: 116–22