
Abstract
Background and purpose — Bone fragility is determined by bone mass, bone architecture, and the material properties of bone. Microindentation has been introduced as a measurement method that reflects bone material properties. The pathogenesis of underlying stress fractures, in particular the role of impaired bone material properties, is still poorly understood. Based on the hypothesis that impaired bone material strength might play a role in the development of stress fractures, we used microindentation in patients with stress fractures and in controls.
Patients and methods — We measured bone material strength index (BMSi) by microindentation in 30 women with previous stress fractures and in 30 normal controls. Bone mineral density by DXA and levels of the bone markers C-terminal cross-linking telopeptide of type-1 collagen (CTX) and N-terminal propeptide of type-1 procollagen (P1NP) were also determined.
Results — Mean BMSi in stress fracture patients was significantly lower than in the controls (SD 72 (8.7) vs. 77 (7.2); p = 0.02). The fracture subjects also had a significantly lower mean bone mineral density (BMD) than the controls (0.9 (0.02) vs. 1.0 (0.06); p = 0.03). Bone turnover—as reflected in serum levels of the bone marker CTX—was similar in both groups, while P1NP levels were significantly higher in the women with stress fractures (55 μg/L vs. 42 μg/L; p = 0.03). There was no correlation between BMSi and BMD or bone turnover.
Interpretation — BMSi was inferior in patients with previous stress fracture, but was unrelated to BMD and bone turnover. The lower values of BMSi in patients with previous stress fracture combined with a lower BMD may contribute to the increased propensity to develop stress fractures in these patients.
The cause of stress fractures is multifactorial, and several risk factors have been proposed: female sex, menstrual irregularities, high bone turnover, vitamin D insufficiency, low bone mineral density (BMD), and poor biomechanics. There is considerable information on the epidemiology and incidence of stress fractures (Warden et al. Citation2006, Barrack et al. Citation2014). However, the role of bone material properties in the etiology of stress fractures has not yet been defined.
Bone fragility is determined by 3 factors: bone mass, bone architecture, and bone material properties. Moreover, all 3 determinants are modulated by bone turnover (Felsenberg Citation2005). Until recently, the assessment of bone material properties was elusive and restricted to nanoindentation at the ultrastructural level (Hengsberger et at. Citation2002) and assessment of matrix components by Fourier transform infrared (FTIR) and Raman spectroscopy (Gourion-Arsiquaud et al. Citation2008)). Recently, however, microindentation was introduced to assess bone material strength (BMS) in vivo (Hansma et al. 2009, Diez-Perez et al. Citation2010). This technique has been shown to reflect the growth of microcracks, based on the hypothesis that variation in the separation of collagen fibrils contributes to initiation of cracks (Fantner et al. 2006). Such microcracks may propagate under further stress and possibly lead to overt fracture (Burr et al. Citation1997). Microindentation permits assessment of bone material strength of the thick cortex of the tibia by measuring the indentation distance increase (IDI) of a thin probe into cortical bone. Previous studies have used microindentation to study bone material properties of female patients with fragility hip fracture (Diez-Perez et al. Citation2010), atypical femoral fracture (Güerri-Fernandez et al. Citation2013), type-2 diabetes (Farr et al. Citation2014), and controls, revealing that the 3 groups of patients all showed compromised bone material properties. These clinical results are consistent with the results of previous animal and ex vivo human research studies in which more fragile bone was found to have greater IDI. Based on biomechanical testing studies, BMS appears to be mainly related to bone toughness (Gallant et al. Citation2013).
Based on the hypothesis that impaired bone material strength might play a role in the development of stress fractures, we used microindentation to test the material strength of bone in patients with stress fractures and in age- and sex-matched controls.
Patients and methods
Between November 2012 and May 2014, 30 women with previous stress fracture were recruited from the orthopedic emergency department, Oslo University Hospital by advertisement, self-referral, or physician referral. Subjects who were referred to our clinic for assessment of suspected bone disease—but where workup showed no such signs—were invited to be part of the control group. Invitation letters were sent to women aged 19–85 living in greater Oslo. Employees of the University Hospital of Oslo were also invited. 168 subjects (50%) responded to our invitation and were examined at the Department of Endocrinology, Oslo University Hospital.
The main inclusion criteria for the case group were: (1) a history of repeated activity or recent increase in training intensity; (2) localized pain that progressively got worse after activity; (3) focal tenderness and swelling over the affected area on examination; (4) bone marrow edema (lesions) in the affected area on MRI.
Women with a documented history of low-energy fracture sustained at the age 45 years or more or a BMD T-score of ≤ −2.5 at at least 1 skeletal site were excluded. 2 of these patients were found to have pathological fractures and were excluded.
Low-energy trauma was defined as being equivalent to a fall from standing height or less, excluding fractures of the skull, digits, and toes. Pathological fractures were defined as fractures due to local tumors, or focal demineralization as visualized on radiographs.
All fractures were sustained in the period 2012–2014
To qualify as normal controls, subjects who were recruited had to have normal BMD values (T-score > −1 and <2.0) and no fracture. 30 healthy subjects with a range of physical fitness were selected for the control group.
Exclusion criteria in both groups were: (1) the presence of any metabolic bone diseases: hyperthyroidism, parathyroid disorder, malabsorption, advanced renal or liver disease, Paget’s disease of bone; (2) immobilization or inability to provide consent; (3) neoplasia; (4) current use of drugs with known adverse effects on bone and calcium metabolism (glucocorticoids, aromatase inhibitors etc.); and (5) any current or past use of parathyroid hormone, bisphosphonates, or denosumab.
Participants were asked to record their age at menarche, menstrual function, history of oral contraceptive use, eating habits and any pathological weight control behavior, and training habits. Women were classified as having current menstrual irregularity if they had oligomenorrhea (defined as 4–9 cycles in the last year) or amenorrhea (defined as fewer than 4 cycles in the last year) (Speroff and Fritz Citation2005).
Measurement of bone mineral density
BMD at the hip and lumbar spine (L1–L4), bone mineral content, and body composition were measured using dual X-ray absorptiometry (DXA) with the GE Lunar Prodigy (Lunar Corporation, Madison, WI). The scanner was calibrated on a daily basis against the standard calibration block supplied by the manufacturer. These measurements showed no drift throughout the study. The in vivo short-term precision error for BMD at the lumbar spine and at the femoral neck in our clinic was <1.0%. Height and weight were measured at the time of DXA, and BMI was calculated.
Biochemical markers
Serum was analyzed for biochemical markers of bone turnover at the Hormone Laboratory of Oslo University Hospital. The bone formation marker N-terminal propeptide of type-1 procollagen (P1NP) and bone resorption marker C-terminal telopeptide of type-1 collagen (CTX) were measured by ECLIA, with the E 170 module for Modular Analytics (Roche Diagnostics, Switzerland). The intra-assay coefficient of variation (CV) of P1NP was 2.8% and total CVs were in the 4–5% range. The intra-assay (CV) of CTX was 2.5% and total CVs were in the 2–3% range. Bone-specific alkaline phosphatase (bone ALP) and osteocalcin (OC) were measured in serum by CLIA (DiaSorin, Saluggia, Italy). The total CV was <7% for bone ALP and <10% for OC. Routine laboratory tests, including those for 25 (OH) vitamin D, PTH, phosphate, and ionized calcium were performed.
Bone microindentation testing
Bone material strength was assessed by microindentation using a commercial hand-held device (OsteoProbe; Active Life Scientific, Santa Barbara, CA). This technique measures the tissue material properties of bone “in vivo” and consists of a thin probe assembly that can penetrate skin and soft tissue to reach the bone. The main components of the OsteoProbe include an impact mechanism, a displacement transducer, and a needle. The needle was held perpendicular to the thick cortex on the anterior surface of the mid-shaft of the tibia, following infiltration of the area with anesthetic (3 mL of 1% lidocaine). The measurement was performed by slowly pressing the needle at a smooth, constant rate to increase the pre-load force until it reached 10 N, at which point the instrument automatically triggered and performed the indentation. The duration of the compression was 1–2 seconds. The system measured the indentation depth after an additional impact force of 30 N. The average value of 8 measurements, each separated by at least 2 mm, was obtained. Indentation depth was recorded as the change between the pre-load depth and the final depth after the impact force had actuated. 5 indentations were performed for calibration of the patient measurements against a phantom of poly-methyl methacrylate (PMMA). The output of the OsteoProbe is bone material strength index (BMSi), which is a normalized measure of indentation depth. BMSi is defined as 100 times the ratio of the IDI in a calibration material (PMMA) divided by the IDI in the bone material. Obvious operator errors for a particular indentation could be selected (flagged) and removed. The instrument software saved the flagged indentation data, but they were not used to calculate the BMSi. The first measurement of indentation was systematically rejected because of its high susceptibility to errors and interference due to initial periosteal penetration.
BMSi is a direct measure of fracture resistance, i.e. the weaker the bone the easier the bone is microfractured (lower BMSi). The indentations are small, with a diameter of approximately 375 μm. The procedure is associated with minimal discomfort due to local injection of anesthesia, but the measurement itself is painless. None of the more than 200 patients who have undergone the procedure in the authors’ outpatient clinic have experienced hematoma or infection.
The intra-observer CV for the method was 9.1%, which was calculated by measuring 20 subjects (mean age 52 (SD 21), range: 20–82 years) twice: using the right leg the first time and the left leg for the second assessment. All measurements were performed by the same operator at a median time of 4 (2–6) months after fracture. To avoid possible adverse effects of immobilization on the affected side, the microindentation was performed on the side contralateral to the fracture in all patients except 2 who had pelvic fractures, where the measurements were performed on the non-dominant leg.
Statistics
Statistical analyses were performed with SPSS version 20.0. Where applicable, the results were expressed as mean and standard deviation (SD). Normal distribution of variables was assessed with the Kolmogorov-Smirnov test. Biochemical and bone parameters were compared between women using Student’s t-test, chi-square test, or Mann-Whitney U-test, depending on whether or not the parameter being tested showed a normal distribution. BMD at the femoral neck was not normally distributed. Analysis of covariance was used to compare age-adjusted means. BMSi values were plotted against femoral neck BMD, age, P1NP, and CTX, and analyzed by linear regression. We performed multivariable analysis to determine the independent effect of BMD and other factors. The terms age, weight, eating disorders, and femoral neck BMD were included in the model to ensure that the effect of BMS was not confounded with these variables. The association was not statistically significant. Significance was assumed for p-values <0.05. We calculated power for the primary endpoint (BMSi) assuming a power of 90%, a type-I error level of 0.05 (two-sided), SD =8.0, and a minimum detectable difference for BMSi of 9.1%. The calculation yielded a minimum sample size of 30 subjects per group.
Ethics
All the subjects provided written informed consent and the Institutional Review Board approved the study (IRB 0000 1870).
Results
Age, height, weight, and BMI were similar in the 2 groups (). Stress fractures were most common in the foot (). 7 of the 30 patients in the fracture group had a history of menstrual irregularity and eating disorders. 3 of the 30 participants in the control group had a history of eating disorders.
Table 1. Descriptive characteristics of the patients with stress fracture and controls without stress fractures
Table 2. Distribution of stress fractures by site
Bone material strength, BMD, and bone turnover
Compared to the controls, the stress fracture patients had significantly lower BMSi values—unadjusted (−6.7%; p = 0.01), age-adjusted (−5.2%; p = 0.02), and following adjustment for BMD (−6.3%; p = 0.01). The stress fracture patients had a mean BMSi value of 70.5 (SD 8.7) whereas the control subjects had a mean value of 77.1 (7.2). Mean BMSi was similar in the 6 postmenopausal women with stress fracture and in the 24 pre-menopausal women with stress fracture (69.1 (11) vs. 71.8 (9); p = 0.9).
Femoral neck and lumbar spine BMD were both statistically significantly lower in the stress fracture group than in the control group (). Further analysis revealed that 14 of the 30 stress fractures occurred in women with a lumbar or femoral neck BMD within the osteopenia range, and the rest were within the normal range. None of the stress fracture cases had BMD T-scores below the limit for osteoporosis (−2.5). There was no correlation between BMSi and BMD at the femoral neck (). Using multiple linear regression analysis with BMD as the dependent variable and BMSi, PINP, and age as independent variables, we were unable to demonstrate a statistically significant association between BMD and BMSi (β = −0.04; p = 0.4), P1NP (β = −0.01; p = 0.4), and age (β = 0.18; p = 0.2).
Figure 1. Lack of correlation between BMSi and bone mineral density (BMD, g/cm2) at the femoral neck in stress fracture patients and controls without stress fracture. Red – patients with stress fracture, and blue – controls.
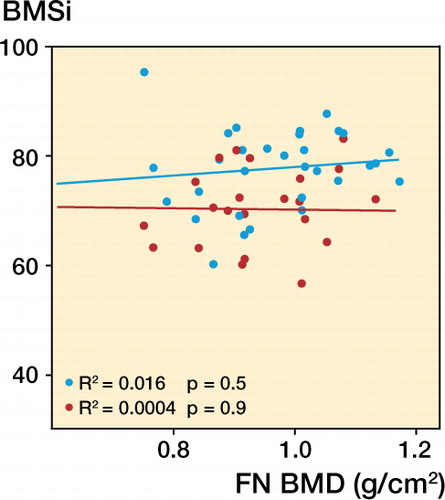
Table 3. Regional BMD measured by DXA in the 2 groups. Values are mean (SD)
Mean serum levels of CTX were similar in the 2 groups. However, subjects with stress fracture had significantly higher serum P1NP levels than the controls. Regression analysis revealed that BMSi did not vary with P1NP (), biochemical markers (), or age (r = 0.008; p = 0.7). Calcium and 25-hydroxyvitamin D levels were similar in the 2 groups ().
Figure 2. Lack of correlation between BMSi and P1NP in patients with stress fracture and controls without stress fracture. Red – patients with stress fracture, and blue – controls.
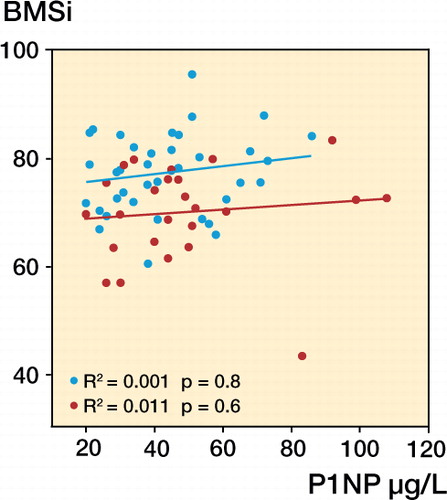
Table 4. Serum biochemistry. Values are mean (SD)
Discussion
Bone is continuously exposed to repetitive loading, which acts as a stimulus for bone remodeling (Bennell and Brukner Citation1997). Repeated loading may, however, also result in damage at the microstructural level—through accumulation of microdamage and bone fatigue (Uthgenannt et al. Citation2007). Without sufficient time to repair, continued mechanical stress results in bone microfractures and bone marrow lesions, the latter only being demonstrable by MRI or ultrasound. The changes are usually called” stress reactions” (Li et al. Citation1985). These microfractures may propagate under further stress, and possibly lead to overt fracture (Burr et al. Citation1997). Bone stress injuries are most commonly seen in young people who engage in intense physical training such as athletes and military recruits (Young and McAllister Citation2006), but stress fractures also occur in osteoporotic bone when loading within the normal physiological range is imposed on bone with inadequate mechanical properties (Breer et al. Citation2012).
In this study, women with stress fractures exhibited: (1) lower BMSi after adjustment for age and BMD, and (2) lower femoral neck and lumbar spine bone mass relative to the controls. Moreover BMSi was not dependent on BMD. While the demonstration of impaired bone material properties is new, the demonstration of reduced bone mass is consistent with other studies carried out in female military recruits and competitive athletes with stress fractures (Lauder et al. Citation2000, Wentz et al. Citation2011). Women with menstrual disorders were overrepresented in the stress fracture group. Even though the number of women with menstrual disorders was no different in the 2 groups, the absolute numbers of subjects were in keeping with the previous literature (Barrow and Saha Citation1988).
Stress fractures are thought to result from repeated mechanical loading of bone causing microdamage accumulation and progression of microcracks to overt fracture (Presbitero et al. Citation2012). The contribution of microdamage accumulation to the reduction of fracture resistance has been evaluated in vitro by measuring changes in elastic modulus, strength, and fracture toughness (Macione et al. Citation2011). Microcracks have been shown to be associated with intracortical resorption in overuse and stress fractures, both in vivo and in vitro (O’Brien et al. Citation2003). Another study emphasized the role of material discontinuities in the interstitial bone, porosity, and heterogeneous osteons (Zioupos et al. Citation2008).
Consistent with the work of other investigators, we found that the most common areas for bone stress injury were the metatarsals and the tibia (Arendt et al. Citation2003). These findings are consistent with the regional alteration in bony dimensions of the posterior tibia, as reflected in both trabecular and cortical parameters assessed by finite element analysis and high resolution quantitative computed tomography (HR-QCT) (Schnackenburg et al. Citation2011). Popp et al. (Citation2009) also reported smaller cortical area and muscle size and consequently lower estimated bone strength in the tibia of female runners with a history of stress fracture.
Microindentation provides new information on BMSi that was hitherto unavailable. Fractures in both trabecular bone and cortical bone begin with the separation of mineralized collagen fibrils and the initiation of cracks. Moreover, the technique creates cracks that are very similar to those observed in experimental bone fractures (Fantner et al. Citation2005).
Increased bone turnover increases bone fragility due to accelerated bone loss, enhanced disintegration of trabecular networks, cortical thinning, and increased cortical porosity (Seeman and Delmas Citation2010). Increased bone turnover has also been implicated in the development of stress fractures (Wakamatsu et al. Citation2012). Previous studies have reported conflicting findings regarding differences between stress fracture cases and controls (Evans et al. Citation2008, Yanovich et al. Citation2013). In our study, all 3 markers of bone formation—bone-specific alkaline phosphatase, osteocalcin, and P1NP—were elevated in patients with stress fractures, but we ascribe these elevations mainly to ongoing fracture healing, where elevated levels can be seen even after 1 year (Ingle et al. Citation1999, Veitch et al. Citation2006, Ivaska et al. Citation2007, Cox et al. Citation2010). On the other hand, the levels of bone resorption marker CTX were similar in the 2 groups.
We did not find any association between age and BMSi, which is somewhat surprising, as the 2 other key determinants of bone strength (bone mass and bone architecture) show a decrease with age (Willinghamm et al. Citation2010). The lack of association may be partially explained by the relatively narrow age range studied.
Our study had both weaknesses and strengths. To our knowledge, this is the first study to assess bone microindentation parameters in women with stress fracture. One limitation was that not all measures were undertaken at baseline DXA; moreover, bone turnover markers (BTMs) were measured after diagnosis of stress fracture. Another limitation was that only women (adolescents, young adults, and adults) were included. The relationship between BMSi and BMD, age, and BMI may be different in men. Women have anatomical differences that increase their risk of developing stress fractures, such as the wider pelvis—which may explain the greater distribution of stress fractures in the pelvis, hip, metatarsals, and tibia (Wentz et al. Citation2011). As our study had a retrospective case-control design, we cannot directly deduce that there is a causative association between reduced BMSi and stress fracture. Our data indicate a possible new risk factor for stress fracture, which is independent of bone turnover and BMD, but only a prospective study in populations at high risk of developing stress fractures would be able to finally establish the value of this new index for prediction of subsequent stress fractures.
In summary, bone material strength was found to be inferior in patients with stress fracture, but unrelated to bone mineral density and bone turnover. The lower values of the BMSi in patients with stress fracture combined with a lower BMD may contribute to the increased fracture propensity in these patients. The data add a new dimension to our understanding of bone quality and fracture propensity, and the technique might possibly help identify subjects who are at increased risk of developing stress fractures in the future—after further validation in a prospective setting.
Both authors contributed to the writing of this manuscript and the design of the study. Data collection: DDS. Interpretation of data: DDS and EFE. Both authors were involved in revising the manuscript content and approving the final version. DDS takes responsibility for the integrity of the data analysis.
We thank Gerd Wiborg, Gøril Vinje, and Synnøve Sørli for BMD activity measurements and technical assistance.
No competing interests declared.
Related Research Data
- Arendt E, Agel J, Heikes C, Griffiths H. Stress injuries to bone in college athletes: a retrospective review of experience at a single institution. Am J Sports Med 2003; 31(6): 959–68.
- Barrack M T, Gibbs J C, De Souza M J, Williams N I, Nichols J F, Rauh M J, Nattiv A. Higher incidence of bone stress injuries with increasing female athlete triad-related risk factors: a prospective multisite study of exercising girls and women. Am J Sports Med 2014; 42(4): 949–58.
- Barrow G W, Saha S. Menstrual irregularity and stress fractures in collegiate female distance runners. Am J Sports Med 1988; 16(3): 209–16.
- Bennell K L, Brukner P D. Epidemiology and site specificity of stress fractures. Clin Sports Med 1997; 16(2): 179–96.
- Breer S, Krause M, Marshall R P, Oheim R, Amling M, Barvencik F. Stress fractures in elderly patients. Int Orthop 2012; 36(12): 2581–7.
- Burr D B, Forwood M R, Fyhrie D P, Martin R B, Schaffler M B, Turner C H. Bone microdamage and skeletal fragility in osteoporotic and stress fractures. J Bone Miner Res 1997; 12(1): 6–15.
- Cox G, Einhorn T, Tzioupis C, Giannoudis P. Bone-turnover markers in fracture healing. J Bone Joint Surg [Br] 2010; 92-B: 329–34.
- Diez-Perez A, Güerri R, Nogues X, Cáceres E, Pena M J, Mellibovsky L, et al. Microindentation for in vivo measurement of bone tissue mechanical properties in humans. J Bone Miner Res 2010; 25(8): 1877–85.
- Evans R K, Antczak A J, Lester M, Yanovich R, Israeli E, Moran D S. Effects of a 4-month recruit training program on markers of bone metabolism. Med Sci Sports Exerc 2008; 40(11 Suppl): S660–S70.
- Fantner G E, Hassenkam T, Kindt J H, Weaver J C, Birkedal H, Pechenik L, et al. Sacrificial bonds and hidden length dissipate energy as mineralized fibrils separate during bone fracture. Nat Mate 2005; 4(8): 612–6.
- Farr J N, Drake M T, Amin S, Melton L J, McCready L K, Khosla S. In Vivo assessment of bone quality in postmenopausal women with type 2 diabetes. J Bone Miner Res 2014; 29(4): 787–95.
- Felsenberg D B S. The bone quality framework: Determinants of bone strenght and their interrelationships, and implications for osteoporosis management. Clin Ther 2005; 27(1): 1–11.
- Gallant M A, Brown D M, Organ J M, Allen M R, Burr D B. Reference-point indentation correlates with bone toughness assessed using whole-bone traditional mechanical testing. Bone 2013; 53(1): 301–5.
- Gourion-Arsiquaud S, West P A, Boskey A L. Fourier transform-infrared microspectroscopy and microscopic imaging. Methods Mol Biol 2008; 455: 293–03.
- Güerri-Fernández R C, Nogués X, Quesada Gómez J M, Torres del Pliego E, Puig L, García-Giralt N, Yoskovitz G Mellibovsky L Hansma PK, Díez-Pérez A. Microindentation for in vivo measurement of bone tissue material properties in atypical femoral fracture patients and controls. J Bone Miner Res 2013; 28(1): 162–8.
- Hansma P, Turner P, Drake B, Yurtsev E, Proctor A, Mathews P, Lelujian J, Randall C, Adams J, Jungmann R. The bone diagnostic instrument II: Indentation distance increase. Rev Sci Instrum 2008; 79(6): 064303.
- Hengsberger S, Kulik A, Zysset P. Nanoindentation discriminates the elastic properties of individual human bone lamellae under dry and physiological conditions. Bone 2002; 30(1): 178–84.
- Ingle B, Hay S, Bottjer H, Eastell R. Changes in bone mass and bone turnover following distal forearm fracture. Osteoporos Int 1999; 10(5): 399–07.
- Ivaska K K, PGerdhem P, Åkesson K, Garnero P, Obrant K J. Effect of fracture on bone turnover markers: a longitudinal study comparing marker levels before and after injury in 113 elderly women. J Bone Miner Res 2007; 22(8): 1155–64.
- Lauder T D, Dixit S, Pezzin L E, Williams M V, Campbell C S, Davis G D. The relation between stress fractures and bone mineral density: evidence from active-duty Army women. Arch Phys Med Rehabil 2000; 81(1): 73–9.
- Li G, Zhang S, Chen G, Chen H, Wang A. Radiographic and histologic analyses of stress fracture in rabbit tibias. Am J Sports Med 1985; 13(5): 285–94.
- Macione J, Kavukcuoglu N, Nesbitt R, Mann A, Guzelsu N, Kotha S. Hierarchies of damage induced loss of mechanical properties in calcified bone after in vivo fatigue loading of rat ulnae. J Mech Behav Biomed Mater 2011; 4(6): 841–8.
- O’Brien F J, Taylor D, Lee T C. Microcracks accumulation at different intervals during fatigue testing of compact bone. J Biomech 2003; 36(7): 973–80.
- Popp K L, Hughes J M, Smock A J, Novotny S A, Stovitz S D, Koehler S M, Petit M A. Bone geometry, strength, and muscle size in runners with a history of stress fracture. Med Sci Sports Exerc 2009; 41(12): 2145–50.
- Presbitero G, O’Brien F J, Lee T C, Taylor D. Distribution of microcrack lengths in bone in vivo and in vitro. J Theor Biol 2012; 304: 164–71.
- Schnackenburg K E, Macdonald H M, Ferber R, Wiley J P, Boyd S K. Bone quality and muscle strength in female athletes with lower limb stress fractures. Med Sci Sports Exerc 2011; 43(11): 2110–9.
- Seeman E, Delmas P D. Microarchitectural deterioration of cortical and trabecular bone: differing effects of denosumab and alendronate. J Bone Miner Res 2010; 25(8): 1886–94.
- Speroff L, Fritz M A. Clinical gynecologic endocrinology and infertility. Seventh ed.: Lippincott, Williams & Wilkins 2005; 403ff. ISBN 0-7817-4795-3.
- Uthgenannt B A, Silva M J. Use of the rat forelimb compression model to create discrete levels of bone damage in vivo. J Biomech 2007; 40(2): 317–24.
- Veitch S, Findlay S, Hamer A, Blumsohn A, Eastell R, Ingle B. Changes in bone mass and bone turnover following tibial shaft fracture. Osteoporos Int 2006; 17(3): 364–72.
- Wakamatsu K, Sakuraba K, Suzuki Y, Maruyama A, Tsuchiya Y, Shikakura J, Ochi, E. Association between the stress fracture and bone metabolism/quality markers in lacrosse players. Open Access J Sports Med 2012; 3: 67.
- Warden S J, Burr D B, Brukner P D. Stress fractures: pathophysiology, epidemiology, and risk factors. Curr Osteoporos Rep 2006; 4(3): 103–9.
- Wentz L, Liu P-Y, Haymes E, Ilich J Z. Females have a greater incidence of stress fractures than males in both military and athletic populations: a systemic review. Mil Med 2011; 176(4): 420–30.
- Willinghamm M D, Brodt M D, Lee K L, Stephens A L, Ye J, Silva M J. Age-related changes in bone structure and strength in female and male BALB/c mice. Calcif Tissue Int 2010; 86(6): 470–83.
- Yanovich R, Evans R K, Friedman E, Moran D S. Bone turnover markers do not predict stress fracture in elite combat recruits. Clin Orthop Rel Res 2013; 471(4): 1365–72.
- Young A J, McAllister D R. Evaluation and treatment of tibial stress fractures. Clin Sports Med 2006; 25(1): 117–28.
- Zioupos P, Cook R B, Hutchinson J R. Some basic relationships between density values in cancellous and cortical bone. J Biomech 2008; 41(9): 1961–8.