
Abstract
Background and purpose — Total ankle replacement (TAR) is gaining popularity for treatment of end-stage ankle arthritis. Large patient-centered outcome studies are, however, few. Here, we report data from the Swedish Ankle Registry.
Patients and methods — We examined outcomes after primary TAR in patients from the Swedish Ankle Registry using PROMs (Patient Reported Outcome Measures; generic: EQ-5D and SF-36, region specific: SEFAS (Self-Reported Foot and Ankle Score), and a question on satisfaction). We included 241 patients registered with primary TAR between 2008 and 2016 and who completed PROMs preoperatively and postoperatively up to 24 months. We evaluated changes in PROMs following surgery and estimated effects of age, diagnosis, prosthetic design, and preoperative functional score on the outcomes.
Results — All absolute scores improved from preoperative to 24 months after surgery (p ≤ 0.001). 71% of the patients were satisfied or very satisfied at the latest follow-up and 12% dissatisfied or very dissatisfied. Postoperative SEFAS correlated with age (r = 0.2, p = 0.01) and preoperative SEFAS (r = 0.3, p < 0.001), as did patient satisfaction (r = −0.2; p ≤ 0.03). Postoperative SEFAS and EQ-5D were similar between different diagnoses or prosthetic designs. Preoperative SF-36 was associated with diagnosis (p ≤ 0.03), postoperative SF-36 with age (r = 0.2, p = 0.01) and diagnosis (p < 0.03).
Interpretation — We found statistically and clinically significant improvements in patient-reported outcomes following TAR surgery. The postoperative region-specific SEFAS was positively associated with older age. Prosthetic design seemed not to influence patient-reported outcome, whereas diagnosis partly did. Studies with longer follow-up are necessary to establish the long-term outcome of TAR and to elucidate whether short- and mid-term outcomes may predict implant failure.
Even though total ankle replacement (TAR) has gained popularity it is still not used as frequently as ankle arthrodesis (AA) (Kostuj et al. Citation2014, Demetracopoulos et al. Citation2015). Studies on third-generation TAR have reported better results than with the first or second generation of prosthetic designs (Labek et al. Citation2013). The intermediate functional outcome nowadays seems comparable to the outcome following AA (van Heiningen et al. Citation2013, Singer et al. Citation2013, Kamrad et al. Citation2015, Henricson et al. Citation2016). However, in the longer perspective reoperation rates are higher after TAR than after AA (Kamrad et al. Citation2015) and implant survival after TAR is still not as favorable as after hip and knee replacements (Bhatia Citation2014). The literature also reports worse outcome after TAR in younger than in older patients (Bhatia Citation2014); patients undergoing TAR are on average about 10 years younger than those undergoing hip and knee arthroplasty due to the fact that ankle arthritis in most cases is caused by previous trauma (Zaidi et al. Citation2013, Demetracopoulos et al. Citation2015).
Despite the popularity of the method, few TAR outcome studies that include more than 100 patients are available, and most are single-center studies (Labek et al. Citation2013). The Swedish Ankle Registry (www.swedankle.se) contains information on virtually all TARs performed in Sweden since 1993, with patient-reported outcome measures (PROMs) since 2008 (Henricson et al. Citation2014). In Sweden somewhat less than 100 TARs are performed each year and at least 75% of the cases are done in 4 centers. The proportion of patients undergoing TAR due to rheumatoid arthritis (RA) was previously reported as higher in Sweden (up to 35%) than in other countries (Labek et al. Citation2013).
The primary aim of our study was, using data from the Swedish Ankle Registry, to evaluate changes in PROMs after primary TAR and report subjective satisfaction rates. The secondary aim was to evaluate whether age, diagnosis, prosthetic design, or baseline scores influenced the PROMs pre- or postoperatively or the changes in scores. Finally, the tertiary aim was to examine changes in the scores from 6 to 24 months and from 12 to 24 months after surgery.
Patients and methods
2 generic PROMs are included in the registry. The EQ-5D (Eriksson and Nordlund Citation2002, Szende and William Citation2004) includes 5 questions estimating general health and scores from worst possible −0.56 to best possible 1. A visual analogue scale (EQ-VAS) is part of the EQ-5D for the self-estimation of general health status (range 0 to best possible 100). The generic SF-36 contains 36 questions resulting in 8 subscores, which can additionally be summarized into one total physical (PCS) and total mental score (MCS) (Eriksson and Nordlund Citation2002). In addition to the PCS, the subscores "bodily pain" (bp) and "physical functioning" (ph) give important information concerning patients’ overall physical health, and analyses in this study include those 2 subscores as well as the PCS and MCS. All SF-36 subscores range from 0 to best possible 100. The registry uses also the region-specific SEFAS (Self-Reported Foot and Ankle Score), a score based on 12 questions estimating foot and ankle function (Cöster et al. Citation2012). SEFAS ranges from 0 to best possible 48. Finally, the registry includes a postoperative question regarding how satisfied the patient is with the surgical result, graded on a Likert scale (very satisfied, satisfied, neither satisfied nor dissatisfied, dissatisfied or very dissatisfied).
Flowchart.
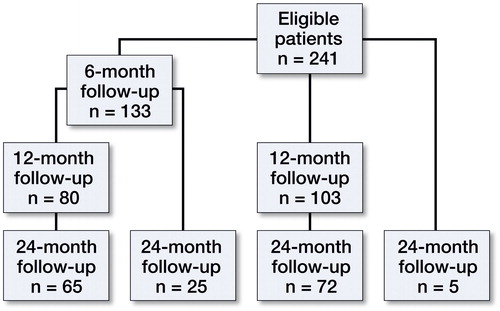
We identified patients registered with unilateral primary TAR between January 2008 and January 2016 and who had returned both the preoperative and at least one of the evaluations at 6, 12, or 24 months postoperatively. For the 9 patients operated in year 2015, only 6- or 12-month evaluations could be performed. By this method we identified 241 patients (57% women) at a mean age of 62 (SD 11) (). TAR surgery was undertaken in 9 centers; 217 of the procedures (90%) were done in 4 of these centers. We received PROM evaluations from 133 patients after 6 months, 183 after 12 months and 167 after 24 months (Figure). Not all patients returned all PROM questionnaires at each evaluation, and not every returned PROM questionnaire was filled out correctly. The diagnoses that lead to TAR surgery were in 90 patients (37%) posttraumatic arthritis (PTA), in 67 (28%) rheumatoid arthritis (RA), in 59 (25%) idiopathic osteoarthritis (OA), and in 25 (10%) other reasons. The Rebalance (Biomet, Bridgend, UK) prosthesis was used in 90 patients (37%), Mobility (DePuy International, Leeds, UK) in 82 (34%), CCI (Ceramic Coated Implant, Wright Medical Technoloy, Arlington, TN, USA) in 61 (25%), and other prosthetic designs in 8 (4%). We defined the postoperative PROM scores including the satisfaction rate as the clinical outcome. In cases with several postoperative PROM evaluations, the most recent satisfaction grade was used. We analyzed the association between age, diagnosis, or prosthetic design and the pre- and postoperative PROMs as well as the changes in PROMs. We also analyzed the influence of preoperative SEFAS on the postoperative SEFAS and on satisfaction.
Table 1. Diagnosis, sex, and mean age of 241 patients
Statistics
We used SPSS (Statistical Package for the Social Sciences® version 21 (IBM Corp, Armonk, NY, USA) for statistical analyses. Data are presented as numbers, proportions (%), and means with 95% confidence intervals (95% CI), ranges, or standard deviation (SD). Paired Student’s t-tests were used to analyze changes in the scores. Pearson and Spearman’s correlation analyses were used to evaluate associations between age and preoperative PROM scores, postoperative PROM scores, changes in scores, and satisfaction rate. We used ANOVA to compare outcomes between groups (different diagnoses and different prosthetic designs) followed by Tukey post-hoc analyses when statistically significant group differences were found. The influence of preoperative SEFAS on postoperative outcome was analyzed by partial correlation analysis adjusted for age. A p-value of <0.05 was considered statistically significant.
Ethics, funding, and potential conflicts of interest
The study was approved by the ethics committee of Lund University (Dnr 2009/698) and was performed according to the Declaration of Helsinki. ALF Skåne, FoU Skåne, SUS hospital trusts and donations, and the Swedish Association of Local Authorities and Regions gave financial support. No competing interests declared.
Results
PROM scores increased from before to 6, 12, and 24 months after surgery (p ≤ 0.001) (). By the time of the 24-month follow-up, 91/126 patients (72%) were very satisfied or satisfied with their ankle, 20 (16%) were neither satisfied nor dissatisfied, and 15 (12%) were dissatisfied or very dissatisfied.
Table 2. Patient-reported outcome measure (PROM) scores. Values are mean (SD)
We could not find a statistically significant correlation between preoperative SEFAS and age (r = 0.05; p = 0.4) or preoperative SF-36 and age (r = 0.01–0.12, p = 0.08–0.9), while this was found between preoperative EQ-5D and age (r = 0.19; p = 0.004). Preoperative SEFAS, EQ-5D, and SF-36 were each statistically significantly associated with primary diagnosis (p ≤ 0.03 for all scores). In post hoc tests statistically significant associations were found between RA patients (lower scores) and PTA and/or OA ( and ).
Table 3. Association between postoperative outcome and age, diagnosis, and prosthetic design
Table 4. Association between SF-36 and age, diagnosis, and prosthetic design
We found positive correlations between postoperative SEFAS and SF-36 bp, changes in SEFAS from pre- to 24 months postoperatively, and satisfaction with age (p ≤ 0.02). We found no statistically significant correlations between postoperative EQ-5D and changes in EQ-5D from pre- to 24 months postoperatively and age (p = 0.09 and 0.3) ( and ).
Postoperative SEFAS, EQ-5D and SF-36 changes in the scores and patient satisfaction showed no statistically significant association with prosthetic design. We found a statistically significant association between postoperative SF-36 ph and PCS and diagnosis, with lower scores for RA patients compared with PTA and/or OA (SF-36 ph p ≤ 0.003, PCS p = 0.03).
Preoperative SEFAS was statistically significant correlated to the postoperative SEFAS (r = 0.3; p < 0.001), and the changes in SEFAS from pre- to postoperative (r = −0.42; p < 0.001), as well as to patient satisfaction (r = −0.2; p = 0.03).
Between 6 and 24 months postoperatively, SEFAS as well as SF-36 ph increased statistically significantly (p ≤ 0.01) while EQ-5D did not (p = 0.6) (). Between 12 and 24 months no statistically significant increase in any of the scores was seen (p = 0.2 − 0.9).
Table 5. Changes in patient-reported outcome (PROM) scores
Discussion
We found that total ankle replacement (TAR) is associated with statistically significant improvements in both general health status (estimated by the generic PROMs EQ-5D and SF-36) and in foot and ankle function (estimated by the region-specific SEFAS). 72% of the patients were very satisfied or satisfied 24 months after surgery. Postoperative self-estimated function and satisfaction were statistically significantly associated with age and preoperative functional score, partly with diagnosis but not with prosthetic design. Patients with RA had worse preoperative PROM scores than patients with PTA and OA but similar postoperative scores except for the SF-36 ph and PCS.
The magnitude of the increase in EQ-5D for our TAR patients, from mean 0.4 preoperatively to 0.7 at 24 months postoperatively, lies in between the increase described for hip (from 0.49 to 0.80) and knee (from 0.52 to 0.73) replacement patients (Jansson and Granath Citation2011). Even though the absolute pre- and postoperative scores were lower for our TAR patients, the relative gain was comparable. The fact that TAR patients estimated their quality of life and general health as worse compared with hip and knee arthritis patients can be interpreted in different ways. Either patients with ankle arthritis have more symptoms or they may have higher demands. Both reasons lead to an important question that needs to be answered: should we offer TAR surgery earlier than presently? But the literature reports younger age as a risk factor for implant failure (Barg et al. Citation2015), and as long as implant survival is not as favorable as for hip and knee prostheses this is an important factor that influences the time of surgery.
Jauregui et al. (Citation2015) investigated health-related quality of life after knee replacement with SF-36 and found postoperative PCS scores of mean 41 and MCS scores of 51. Their results 10 years postoperatively were similar to those in our study two years postoperatively (40 and 53 respectively).
Even satisfaction seems to be similar for TAR, THA, and TKA patients. In our study, 12% of the patients were dissatisfied or very dissatisfied. Palazzo et al. (Citation2014) report 7–15% of patients after THA to be dissatisfied or very dissatisfied, and after TKA the rate is estimated to be about 6% (www.myknee.se).
The increase in mean SEFAS score from 16 preoperatively to 31 at 24 months postoperatively should be put into perspective. For patients with forefoot disorders Cöster et al. (Citation2014) reported an increase in SEFAS from pre- to postoperatively from 29 to 38 points and for patients with hindfoot disorders from 20 to 29 points. In another study including 21 patients with acquired adult flat foot Cöster et al. (Citation2015) reported a mean increase of SEFAS from 21 preoperatively to 33 points at 24-month follow-up. The preoperative score for our TAR patients was thus lower than for other general foot disorders but the absolute gain for TAR surgery was at least similar and the relative improvement was higher. Cöster et al. (Citation2017) defined a 5-point increase in SEFAS as the minimal clinically important difference. Thus, TAR also results in a clinically significant improvement.
We found statistically significant associations between primary diagnosis and postoperative outcome only for the SF-36 ph and PCS. There were, however, preoperative group differences in SEFAS, SF-36, and EQ-5D, though only statistically significant between RA (lower) and PTA and/or OA in post-hoc tests. This may indicate that Swedish patients with RA are offered TAR when they have more severe problems than patients with other diagnoses, yet the potential for satisfying postoperative outcome seems equivalent. Even though our study is relatively large there is a risk of type II error in the sub-group analyses. Thus, the similar gains we found in scores between diagnosis groups, even though RA patients preoperatively had lower scores and postoperative scores were similar between almost all groups, may be a type II error.
Preoperative EQ-5D and postoperative SEFAS and SF-36 bp were in our study positively correlated with age, showing higher scores with increasing age. Demetracopoulos et al. (Citation2015) found worse preoperative scores in younger patients but similar postoperative outcome, only slightly different from our results. The differences in our study might partly be referred to the different study design, patient cohort, and follow-up time. Rodrigues-Pinto et al. (Citation2013) investigated the influence of age on the outcome and complications after TAR and found at least similar outcome and complication rates for patients younger than 50 years compared with patients 50 years or older at short- to mid-term. We have found no recent long-term studies focusing on the influence of age on outcome and implant survival after TAR, and future studies on this subject are encouraged.
Due to low implant survival the STAR prosthesis has not been used in Sweden since 2006 (Henricson et al. Citation2011). The perfect prosthetic design may not yet have been found. Robati et al. (Citation2016) tried to specify the ideal mechanical requirements for a well-functioning TAR and concluded that in many cases we do not actually know why an implant loosens. They also reasoned that even though TAR implant design has made progress in recent years the implant survival still does not match those for hip and knee replacements. In our study with only modern prostheses (no prosthesis from 1st or 2nd generation), the prosthetic design did not seem to influence self-reported outcome or satisfaction in a 2-year perspective. This is in line with the results of Jung et al. (Citation2015) who compared the outcomes between the Hintegra (Newdeal SA, Lyon, France) and Mobility prostheses and found a similar clinical outcome. In addition to the self-estimated outcome, implant survival is the other important parameter for the patient. We did not investigate implant survival of different prosthetic designs, and future large studies should specifically compare with each other the outcome and survival of modern implants.
There is an ongoing discussion as to whether arthroplasty outcome is best evaluated in registry studies or in prospective randomized control trials (RCT) within highly specified units. In a systematic review and meta-analysis on the outcome of total ankle replacement Zaidi et al. (Citation2013) found that most studies were single-center level IV studies with low evidence level. They inferred that registry studies more likely reflect the real-world clinical situation compared with studies performed by a single or very few specialized surgeons who use a single prosthetic design.
Our study includes data from different hospitals, surgeons, and prosthetic designs. The low yearly number of TAR implantations in Sweden denotes the presence of strict indications for TAR. With this case-selection strategy, our data indicate that TAR seems to be a reasonable treatment for severe ankle arthritis at least in a 2-year-perspective.
In the follow-ups after 6, 12, and 24 months we found statistically significant changes in the PROM scores between 6 and 12 months but not between 12 and 24 months. In a previous study on revision TAR we could show that mean time from primary TAR to revision surgery was about two years (Kamrad et al. Citation2015). Longer follow-up time is needed to examine whether the 12-month PROM evaluation may be a predictor for future TAR failure.
Strengths of our study include the large number of cases compared with other studies, and the nationwide data. Further, the PROM evaluations both pre- and postoperatively made it possible to evaluate the result of the procedure from the patient perspective and allow comparison with other treatments and other studies.
Weaknesses include the general limitations of registry studies such as the concern regarding completeness of reporting. However, coverage for TAR has been virtually complete, according to the National Patient Registry. Also the lack of detailed patient-specific information concerning general health but also regarding the ankle is a limitation of registry studies. Radiographic and gait analyses might have given additional aspects on the outcome. In this study, only patients who completed both the pre- and postoperative PROMs were included, which may lead to a selection bias. Of the registered 506 primary TARs during the period of interest, preoperative PROMs were registered only in 269 cases, and only these patients were asked to fill out the postoperative questionnaires. 4 patients had to undergo early revision and were excluded, and 24 of the remaining 265 patients (9%) did not return the follow-up questionnaires. There were no obvious differences between the missing patients and the included patients concerning sex, primary diagnosis, and prosthetic design.
Another weakness is the absence of normative SEFAS scores. Nevertheless, comparison with outcomes in studies of other foot and ankle procedures is still possible and the increase in SEFAS was way over the minimal clinically important difference. Finally it would have been valuable to have an equivalent PROM evaluation of primary ankle arthrodesis to compare the outcomes of the 2 surgical treatment options objectively.
In summary, we found that total ankle replacement resulted in both clinically and statistically significant improvements in patient-reported outcome and in high satisfaction rates at 24-month follow-up. Prosthetic design did not seem to influence the postoperative outcome in our patient cohort whereas age and diagnosis did.
IK, AH, BR, HM, MK, and ÅC designed the study; IK and ÅC collected data; IK and BR interpreted data and did statistical analyses; IK and BR wrote the first version, all authors together finalized the manuscript.
Acta thanks Markus Knupp and Thea Vliet Vlieland for help with peer review of this study.
- Barg A, Wimmer M D, Wiewiorski M, Wirtz D C, Pagenstert G I, Valderrabano V. Total ankle replacement. Dtsch Arztebl Int 2015; 112 (11): 177–84.
- Bhatia M. Ankle arthritis: Review and current concepts. JAJS 2014; 1 (1): 19–26.
- Cöster M, Karlsson M K, Nilsson J A, Carlsson A. Validity, reliability, and responsiveness of a self-reported foot and ankle score (SEFAS). Acta Orthop 2012; 83 (2): 197–203.
- Cöster M C, Bremander A, Rosengren B E, Magnusson H, Carlsson A, Karlsson M K. Validity, reliability, and responsiveness of the Self-reported Foot and Ankle Score (SEFAS) in forefoot, hindfoot, and ankle disorders. Acta Orthop 2014; 85 (2): 187–94.
- Cöster M C, Rosengren B E, Bremander A, Karlsson M K. Surgery for adult acquired flatfoot due to posterior tibial tendon dysfunction reduces pain, improves function and health related quality of life. Foot Ankle Surg 2015; 21 (4): 286–9.
- Cöster M C, Nilsdotter A, Brudin L, Bremander A. Minimally important change, measurement error, and responsiveness for the Self-Reported Foot and Ankle Score. Acta Orthop 2017; 88 (3): 300–4.
- Demetracopoulos C A, Adams S B, Jr., Queen R M, DeOrio J K, Nunley J A, 2nd, Easley M E. Effect of age on outcomes in total ankle arthroplasty. Foot Ankle Int 2015; 36 (8): 871–80.
- Eriksson E, Nordlund A. Health and health related quality of life as measured by the EQ-5D and SF-36 in south east Sweden: Results from two population surveys. Folkhälsovetenskapligt Centrum, 2002. ISSN 1401-5048.
- Henricson A, Nilsson J A, Carlsson A. 10-year survival of total ankle arthroplasties: A report on 780 cases from the Swedish Ankle Register. Acta Orthop 2011; 82 (6): 655–9.
- Henricson A, Cöster M, Carlsson, Å. The Swedish National Ankle Registry. Fusz & Sprunggelenk 2014 (12): 65–9.
- Henricson A, Fredriksson M, Carlsson A. Total ankle replacement and contralateral ankle arthrodesis in 16 patients from the Swedish Ankle Registry: Self-reported function and satisfaction. Foot Ankle Surg 2016; 22 (1): 32–4.
- Jansson K A, Granath F. Health-related quality of life (EQ-5D) before and after orthopedic surgery. Acta Orthop 2011; 82 (1): 82–9.
- Jauregui J J, Cherian J J, Pierce T P, Beaver W B, Issa K, Mont M A. Long-term survivorship and clinical outcomes following total knee arthroplasty. J Arthroplasty 2015; 30 (12): 2164–6.
- Jung H G, Shin M H, Lee S H, Eom J S, Lee D O. Comparison of the outcomes between two 3-component total ankle implants. Foot Ankle Int 2015; 36 (6): 656–63.
- Kamrad I, Henricsson A, Karlsson M K, Magnusson H, Nilsson J A, Carlsson A, et al. Poor prosthesis survival and function after component exchange of total ankle prostheses. Acta Orthop 2015; 86 (4): 407–11.
- Kostuj T, Preis M, Walther M, Aghayev E, Krummenauer F, Roder C. [German Total Ankle Replacement Register of the German Foot and Ankle Society (D.A.F.): Presentation of design and reliability of the data as well as first results]. Z Orthop Unfall 2014; 152 (5): 446–54.
- Labek G, Todorov S, Iovanescu L, Stoica C I, Bohler N. Outcome after total ankle arthroplasty: Results and findings from worldwide arthroplasty registers. Int Orthop 2013; 37 (9): 1677–82.
- Robati S, Salih A, Ghosh K, Vinayakam P. The Scandinavian Total Ankle Replacement and the ideal biomechanical requirements of ankle replacements. J Orthop 2016; 13 (1): 48–51.
- Palazzo C, Jourdan C, Descamps S, Nizard R, Hamadouche M, Anract P, et al. Determinants of satisfaction 1 year after total hip arthroplasty: The role of expectations fulfilment. BMC Musculoskelet Disord 2014; 15: 53.
- Rodrigues-Pinto R, Muras J, Martin Oliva X, Amado P. Total ankle replacement in patients under the age of 50: Should the indications be revised? Foot Ankle Surg 2013; 19 (4): 229–33.
- Singer S, Klejman S, Pinsker E, Houck J, Daniels T. Ankle arthroplasty and ankle arthrodesis: Gait analysis compared with normal controls. J Bone Joint Surg Am 2013; 95 (24): e191(1–10).
- Szende A, William A. Measuring self-reported population health: An international perspective based on EQ-5D. EuroQol Group, 2004.
- van Heiningen J, Vliet Vlieland T P, van der Heide H J. The mid-term outcome of total ankle arthroplasty and ankle fusion in rheumatoid arthritis: A systematic review. BMC Musculoskelet Disord 2013; 14: 306.
- www.myknee.se. The Swedish Knee Arthroplasty Register, 2016.
- Zaidi R, Cro S, Gurusamy K, Siva N, Macgregor A, Henricson A, et al. The outcome of total ankle replacement: A systematic review and meta-analysis. Boint Joint J 2013; 95-B (11): 1500–7.