
ABSTRACT
This paper reports on the factors associated with non-fatal urban-road accident severity. Data on accidents were gathered from the local traffic police in the City of Palermo, one of the six most populated cities in Italy.
Findings from a mixed-effects logistic-regression model suggest that accident severity increases when two young drivers are involved, road traffic conditions are light/normal and when vehicles crash on a two-way road or carriageway. Speeding is more likely to cause slight or serious injury even when compared to a vehicle moving towards the opposite direction of traffic. An accident during the summer is more likely to result in a slight or serious injury than an accident during the winter, which is in line with evidence from Southern Europe and the Middle East.
Finally, the severity of non-fatal accident injuries in an urban area of Southern Europe was significantly associated with speeding, the age of the driver and seasonality.
Introduction
Road-accident injuries have significant economic implications including costs of health care, quality of life, administration, insurance and lost productivity for the victims and their families. The World Health Organization (WHO) has estimated that injuries as a result of road accidents cost countries approximately 3% of their Gross National Product with the figure rising to 5% in some low- and middle-income countries (WHO, Citation2016). Countries in the WHO European region, which includes the European Union (EU) and the Commonwealth of Independent States, reported societal costs of road accidents between 0.6% and 5.8% of their Gross Domestic Product (GDP) with a median of 1.4% of the GDP (Jackisch, Sethi, Mitis, Szymañski, & Arra, Citation2015). In Italy, there is little evidence on the costs of road traffic injuries, but a study conducted by the Italian Institute of Statistics reported that in 2014, medical costs, production and human losses amounted to 18 billion Euros, 1.3% of the country's GDP (Istituto Nazionale di Statistica, Citation2015).
In 2016, the WHO announced that approximately 1.25 million people are killed and 20–50 million people suffer non-fatal injuries each year because they have been involved in a road accident (WHO, Citation2016). The European Commission has estimated that for each road death there are approximately four permanently disabling injuries (e.g. brain or spinal cord damage), eight serious injuries and 50 minor injuries (EU, Citation2016). Across the EU there were 25,896 persons killed in road accidents averaging 51 deaths per million inhabitants in each EU member state in 2013 (Eurostat, Citation2015). Between 2010 and 2014, road deaths decreased by 18% reflecting an average of 4.9% annual reduction across the EU (EU, Citation2015). However, the percentage of accidents involving seriously injured increased by almost 3% between 2013 and 2014 (EU, Citation2015). During the same period, in Italy, there was an overall c.0.6% decrease in fatal accidents and 2.7% decrease in accidents involving serious injuries (Istituto Nazionale di Statistica, Citation2016). These trends are far from the set target of achieving an overall 50% reduction in road-accident fatalities by 2020 (EU, Citation2015). Most importantly, the increase in serious injuries because of road accidents across the EU suggests that more empirical evidence is needed to better understand the factors associated with non-fatal road-accident injuries. The need for additional evidence across different settings becomes more emerging due to lack of data (e.g. non-fatal accidents) as well as inconsistencies in the findings and the definition of and factors related to accident severity. This is explained in the remainder of this section.
Many studies on road-accident severity have primarily focused on investigating factors associated with fatal injuries whereas less emphasis has been placed on non-fatal (slight and serious) injuries. A frequently cited barrier that prevents a thorough investigation of non-fatal accidents has been underreporting, which may vary across countries (Elvik & Mysen, Citation1999; Hauer & Hakkert, Citation1988; Savolainen, Mannering, Lord, & Quddus, Citation2011; Tsui, So, Sze, Wong, & Leung, Citation2009). One of the reasons behind underreporting of non-fatal accidents, especially those involving slight injuries, has been related to the risk of involving insurance companies and potential increases in vehicle-insurance premiums over following years (Abay, Citation2015; Hauer, Citation2006). Underreporting may also vary according to severity as the police in some cases would record an accident and visit the accident site only when vehicle or property damages exceed a certain amount (Hauer & Hakkert, Citation1988). Underreporting may lead to biased results, giving erroneous identification of the factors related with accident severity, especially those concerning non-fatal injuries (Savolainen et al., Citation2011).
It is also not straightforward to generalize findings as there exist different definition of factors related to accident severity and findings are inconsistent and vary across country and urban/rural settings or come from the investigation of specific road locations (e.g. intersections) (Theofilatos, Graham, & Yannis, Citation2012; Theofilatos & Yannis, Citation2014). Driver's age, for example, is a characteristic case in which there has been a variety of definitions. A study investigated associations between accident severity and the age of motorcycle drivers, which were grouped into ‘under 25’ and ‘over 55’ years using the age group of ‘25–55’ as reference (Patil, Geedipally, & Lord, Citation2012), whereas another study classified drivers into five age groups (<18, 18–30, 31–45– 46–60 and 60+ year of age) (Theofilatos et al., Citation2012). Regarding the inconsistency of findings, two studies reported that male drivers had a lower injury propensity compared to female drivers in their study of 60 jurisdictions across the US and the city of Coimbra, Portugal, respectively (Garrido, Bastos, de Almeida, & Elvas, Citation2014; Yasmin & Eluru, Citation2013). On the other hand, Zhang, Lindsay, Clarke, Robbins, and Mao (Citation2000) reported that elderly (65+ years of age) male drivers in Ontario, Canada, were more likely to be involved in a major or fatal accident than females.
A study also reports on impacts involving a frontal crash into the rear of another vehicle (Viano & Parenteau, Citation2012). Results revealed that there is no significant difference between the risk of severe injury for drivers in the front and rear in two vehicle collisions.
The association between weather conditions and accident severity has also involved inconsistent findings. A number of studies suggested that drivers generally adjust driving speed and take precaution during period of poor weather, and therefore the likelihood of a severe accident decreased (e.g. Theofilatos et al., Citation2012; Zhang et al., Citation2000). By contrast, other studies reported reduced visibility, adverse weather conditions such as snow increased the propensity of injury severity and unsafe driving (Balagh, Farnoosh, & Makis, Citation2014; Bella & Calvi, Citation2013; Milton, Shankar, & Mannering, Citation2008).
Given variations on the definition of different factors, inconsistency of findings and limited evidence on non-fatal injuries, the aim of this paper is to examine the factors associated with non-fatal accident severity through an empirical investigation. The study benefits from the availability of a comprehensive record of accidents reported to the local traffic police in the City of Palermo, one of the six most populated cities in Italy. The City of Palermo resembles well an Italian city of 500,000 inhabitants, but one with very limited public transport services and thus, high reliance on cars and motorcycles. The very interesting aspect of the data is that fatal-accidents only account for 0.36% of all accident records (City of Palermo, Citation2013) and hence, this is an opportunity to investigate and report findings on the factors associated with slight and serious injuries.
Methods
Data
The data in this study comprised a monthly-stratified random-sample of 20% of the road accidents that occurred in the City of Palermo during the period August 2012–December 2013. All accident records are created in paper and pencil format by the local traffic police department in the City. Because of financial and human resources constraints, it was only possible to obtain a (random) proportion of this data in digital format. Each accident record included the characteristics of the accident (e.g. cause, nature), the type of vehicles involved, the age and gender of the drivers, road-design characteristics and road and weather conditions. Summary statistics of the available data are shown in and .
Table 1. Individual and vehicle characteristics of accident data for Palermo, Italy (N = 1398).
Table 2. Descriptive statistics of the accident data in Palermo, Italy (N = 1398).
Each record also included details of a maximum of two vehicles, except in the case where only one vehicle was involved in an accident. As shown in , most drivers were males – 72.7% in Vehicle 1 and 76.7% in Vehicle 2 and accidents mostly involved cars and scooters /motorcycles. The category ‘other vehicle’ included vans, trucks and public-service vehicles and corresponded to 4.7% of the first and 3.6% of the second vehicle in the sample of accidents. Regarding the drivers’ age, the majority were between 25 and 54 years of age comprising three age-group categories with approximately equal frequencies (19.3%−22.9%). Finally, the data included a very small proportion (1.5%) of single vehicle crashes (car, motorcycle or bicycle) in which no other vehicle or pedestrian was injured.
As shown in , disobeying the right of way and speeding were the two most frequent causes of accidents corresponding to 37.2% and 24.3% of the sample, respectively. Approximately, 64% of the accidents involved a front/lateral collision and only 8.1% of the accidents involved a pedestrian. Accidents involving only one vehicle corresponded to 8.7% of the accidents. Regarding road conditions and design characteristics, most accidents occurred under light or normal traffic conditions (83.8%), 6.1% of accidents occurred on a bend (curve) and 19.1% took place on a carriageway within the City of Palermo. Road signs were missing in 14.6% and traffic lights were present at 11.4% of the cases, respectively.
The time of the accident was grouped into four categories corresponding to morning peak, day off-peak and afternoon/evening peak and off-peak periods. As shown in , 38.7% of the accidents were recorded between 9am and 4pm. In terms of season, autumn and summer presented higher frequencies of accidents with 34.9% and 23.5%, respectively. Finally, the data included information on the weather conditions with 66% of accidents occurring on a sunny day and in only for 1.9% of the cases visibility was poor.
Analytical approach
Accident severity, the dependent variable in this study, was classified into four categories: (1) no injury, (2) slight injury (3) injury requiring hospital admission for more than three days and (4) fatal injury. The occurrence of fatal injuries corresponded to only 0.36% of all accidents (City of Palermo, Citation2013) and therefore provided an opportunity for the analysis to focus on non-fatal injuries, namely slight injury or injury requiring hospital admission for more than three days. The frequencies of the two injury categories are shown in . 61.5% of accidents involved a slight injury and 5.3% accidents involved a more serious injury. For the purposes of this study, the two injury categories were grouped into a single category.
Preliminary exploratory analysis included univariate logistic regression models to separately test the effect of each explanatory factor on accident severity. The p-values and sign of the association of each factor are shown in Appendix. As shown in and , all explanatory variables were categorical and those that had more than two levels (j > 2) were dummy-coded by creating j–1 dummy variables with one of the levels being the reference level. For example, the variable ‘cause of the accident’ was dummy coded into three variables ‘speeding’ (= 1 if speeding was the cause of the accident, 0 otherwise), ‘disobeying right of way’ and ‘other’ with the reference category being ‘reverse driving direction’.
The multivariate analysis of the crash severity data was undertaken using a mixed-effects (multi-level) logistic regression model. Each observation corresponded to a vehicle (car, motorcycle and scooter) and these observations were grouped into the corresponding accident. A multi-level model allows to directly estimate the effects of driver and vehicle characteristics involved in an accident as the effects of drivers’ gender, age and type of vehicle can be specified in the model, rather than through interactions, while accounting for potential correlation of the road, weather, time and season characteristics when having two vehicles involved in the same accident. Multi-level models are indented to evaluate the correlation between observations (vehicles in the latter case) within the same level of analysis (accident) and capture these variations by allowing the regression intercept to vary across accidents. This approach is known as a ‘random intercept’ multi-level modelling method (Jones & Bullen, Citation1994).
The mixed-effects logistic regression model estimations were performed in STATA/MP 13.1 using the xtmelogit command (Stata Corporation, Texas, USA). The selection of explanatory variables in the model was guided by the significance of explanatory factors in the univariate analysis (see, Appendix) and the potential correlations and overlap between explanatory variables (e.g. nature of the accident and crash type). Also, single vehicle crashes could not recover any significant effects in preliminary analysis due to their very small proportion in the sample and thus these observations were excluded from further analysis.
Results
shows the estimated coefficients of explanatory factors in the mixed-effects logistic regression model of accident severity. The vehicle-to-vehicle variation as determined by the standard deviation of the constant term is statistically significant at the 99% confidence level confirming that there are generalizable differences across vehicle and driver characteristics in terms of the severity of the crash.
Table 3. Estimated coefficients of a mixed-effects logistic regression model of non-fatal accident severity.
Driver characteristics
Compared to drivers aged 25 years or younger, 25–34 and 34–44-year-old drivers were less likely to be involved in a crash involving a slight or serious injury and both effects were statistically significant at the 95% level of confidence (Coeff: −0.371, p-value < 0.05; Coeff: −0.328, p-value < 0.05). On the other hand, there were no significant differences in the severity of crash between drivers aged 25 years of age and those aged 45–54 years and 65 and over. Regarding the gender of drivers, there was no significant difference in the severity of the accident between male and female drivers.
Accident characteristics
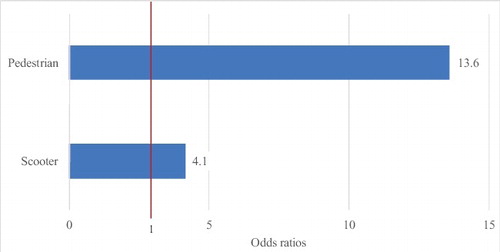
The characteristics of the accident primarily concerned two variables: the type of vehicle and the cause of the accident. The variable ‘type of vehicle’ presented a significant overlap with the variable ‘nature of the accident’. However, ‘type of vehicle’ was selected to better capture the severity risk of the vehicles involved and because of the overall improvement in the model's goodness-of-fit; the comparison was based on log-likelihood ratio tests across two different model specifications. As shown in , compared to an accident involving a car, truck or an ambulance, the severity of an accident involving scooters, cyclists or pedestrians was significantly different at the 99% confidence level. For example, an accident involving a scooter (or motorcycle) was more likely to involve a slight or serious injury (coeff: 1.422; p-value < 0.01) than an accident involving a car(s). As shown in , the odds ratio of a scooter vs. car accident resulting in a slight or serious injury was 4.1 times higher than an accident involving only cars. The highest odds ratio was estimated for an accident involving a pedestrian or cyclist where the likelihood for a slight or serious injury was 13.6 times higher than an accident involving a car(s). With regard to the cause of the accident, speeding significantly increased the severity of accident (coeff: 0.442; p-value < 0.01) relative to another accident that occurred because of driving towards the opposite direction of the traffic, which was set as the reference level. The odds ratio of speeding was equal to 1.6, among the highest of all explanatory factors excluding those related to type of vehicle.
Figure 1. Odds ratios of injury severity for pedestrians and scooter riders.
Road design and conditions
Road type was defined by three levels: one-way-traffic road, two-way and carriageway. Relative to one-way-traffic, the severity of the accident was significantly higher if the accident occurred in a two-way-traffic road (coeff: 0.379; p-value < 0.01) or a carriageway (coeff: 0.337; p-value < 0.01). The corresponding odd ratios were equal to 1.5 for two-way-traffic road and 1.4 for carriageway, respectively.
Presence of road signs only marginally increased the severity of the accident (coeff: 0.392; p-value < 0.01) relative to cases where there was absence of road signs. Finally, accidents occurring under light or normal traffic were more likely to result in slight or severe injury when compared with accidents occurring under heavy-traffic conditions. The corresponding odds ratio was equal to 1.5 – that is under light or normal traffic conditions, the likelihood of increased accident severity increased by 1.5 times.
Time of day and season of year
The time of day an accident occurred was used to classify accidents into four periods: (a) morning peak, (b) day off-peak, (c) afternoon peak and (d) afternoon off-peak/night. Relative to the morning peak-period, accident severity was significantly different during the day off-peak period in which the likelihood of a slight or more serious injury was higher (coeff: 0.444; p-value < 0.01). The odds ratio of day off-peak accident severity was equal to 1.6 (see, ).
Figure 2. Odds ratios of significant explanatory variables at the 95% confidence level.
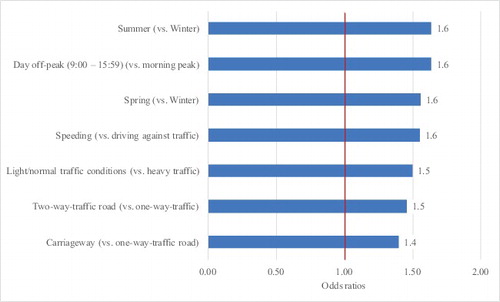
Αccident records were classified according to the season of the year to capture seasonality effects. Using winter as a reference level, accidents occurring during the summer (coeff: 0.500, p < 0.01), autumn (coeff: 0.451, p < 0.01) and spring (coeff: 0.200, p < 0.10) time were likely to result in a slight or more serious injuries. The odds ratio of an accident severity in the summer and spring was 1.6 meaning that an accident in the summer was 1.6 times more likely to result in slight or more serious injury than another occurring in the winter (see, ).
Discussion and conclusion
This study examined the associations between the severity of non-fatal accidents in the City of Palermo and driver and accident characteristics, road design and conditions and seasonality of accident severity.
The key findings are that the severity of non-fatal accident injuries in an urban area of Southern Europe was significantly associated with speeding, the age of the driver and seasonality. Compared to an accident that involved a vehicle moving against the direction of traffic, exceeding the speed limit of 50 km/hr (30 mph) in an urban area would be 1.6 times more likely to result in a serious injury. This finding and estimated odds ratio is unique as the estimates correspond to the relative risk of an accident when exceeding the urban-level speed limit. The only relevant model specification, but for rural areas also reported that exceeding the posted speed limit on rural freeways significantly increased the accident severity or fatality in the state of Washington, US (Shankar, Mannering, & Barfield, Citation1996). Model specifications in previous studies only classified accidents according to the different levels of speed limits (e.g. 50 km/hr, 100 km/hr) reporting a positive association between speed limit and accident severity (Tay & Rifaat, Citation2007). For example, Chen, Cao, and Logan (Citation2012) found that the fatal intersection crashes were 10.5 times more likely to occur within 100 km/hr speed zones than in 50 km/hr zones.
Regarding the age of the driver, findings in this study indicated that an accident between two drivers aged 24 years or younger, 45–54 and 65 years and older were more likely to be involved in a crash with a slight or serious injury than those aged 25–44 and 55–64 years. This finding suggests that accident severity in the urban environment were more prevalent among younger and older drivers. For younger drivers, risk-taking behaviours, immaturity as well as inexperience have been suggested as drivers of more severe crashes (Organisation for Economic Co-operation and Development, Citation2006; Tay & Rifaat, Citation2007). The estimated effects were in line with previous findings in similar country settings (e.g. Theofilatos et al., Citation2012). Similarly, Patil et al. (Citation2012) reported that young (<25 years of age) motorcycle riders were more likely to be involved in accidents with higher injury severity than middle-aged drivers.
Seasonality effects were tested by classifying accidents into the four seasons of the year. Specifically, the findings indicated that accidents in the summer and autumn were c.1.6 times more likely to result in a slight or serious injury than accidents recorded in the winter. This finding may appear counter intuitive but previous studies at similar geographic and country contexts proposed supportive arguments. For example, two studies suggested that speed adjustments by drivers (Bergel-Hayat, Debbarh, Antoniou, & Yannis, Citation2013; Theofilatos et al., Citation2012) – i.e. being more cautious during adverse weather may be related to reduced severity during the winter, whereas higher use of motorcycles may be related to higher severity during the summer, spring and autumn in the Mediterranean region (Theofilatos & Yannis, Citation2014). Along this line, Nofal and Saeed (Citation1997) reported that the presence of seasonal patterns in accident numbers were significantly higher during the hot daylight periods of the summer season in the City of Riyadh, Saudi Arabia. These effects significantly differ from several US states and other European countries (Theofilatos & Yannis, Citation2014). It is also worth highlighting that given the geographic location of the City of Palermo, the variable season was highly correlated with weather (sunny, rain, clouds) in terms of the frequency of accidents (χ2(6) = 194.14, p = 0.000). In other words, accidents recorded in the summer were more likely to occur on a sunny day and accidents recorded in the winter had higher than expected frequencies on a cloudy or rainy day, respectively. The latter did not necessarily mean bad weather as there were very few accidents recorded under poor visibility conditions (see, ).
One of the strengths of this study is that it reports evidence on accident severity of non-fatal accidents, namely no injury, slight injury and injury requiring hospitalization for more than three days. Fatal accidents only corresponded to 0.36% of all recorded accidents. The estimated mixed-effects logistic regression model and odd ratios are therefore free from underreporting bias involved in many accident records (Abay, Citation2015). Also, the study provided evidence from Palermo, Italy, a typical example of a city in southern Europe where evidence on the factors associated with accident severity has been scarce. One of the limitations of the paper is the lack of data on use of safety equipment (e.g. seatbelts, helmets), alcohol misuse or phone use during driving (Cheng, Citation2015). Previous studies have highlighted the effectiveness of crash protection equipment in reducing accident severity (Patil et al., Citation2012; Zhang et al., Citation2000). Also, Abay, Citation2015 reported that the use of seatbelt only increased the likelihood of minor injuries. Not surprisingly, Patil et al. (Citation2012) and Zhang et al. (Citation2000) found that alcohol consumption increased the probability of sustaining a serious injury.
Our study was set in an urban area of Italy; the results, however, are relevant to other cities in Southern Europe. There is opportunity to address accident severity by developing and implementing policy centred on young people and speeding. Policy measures may involve the implementation of a traffic management system, especially during day non-peak hours, education campaigns and driver training for young people as well as use of technology (e.g. speed cameras) to address issues of accident severity in an urban setting.
Acknowledgments
The authors are grateful to the Policy Department in the City of Palermo for supplying the data on accident records and the two anonymous reviewers for their constructive comments and suggestions.
Disclosure statement
The authors declare that they have no conflicts of interest.
References
- Abay, K.A. (2015). Investigating the nature and impact of reporting bias in road crash data. Transportation Research Part A: Policy and Practice, 71, 31–45. Retrieved from https://doi.org/10.1016/j.tra.2014.11.002
- Balagh, A.K.G., Farnoosh, N., & Makis, V. (2014). Highway accident modeling and forecasting in winter. Transportation Research Part A: Policy and Practice, 59, 384–396. Retrieved from https://doi.org/10.1016/j.tra.2013.10.008
- Bella, F., & Calvi, A. (2013). Effects of simulated day and night driving on the speed differential in tangent–curve transition: A pilot study using driving simulator. Traffic Injury Prevention, 14(4), 413–423.
- Bergel-Hayat, R., Debbarh, M., Antoniou, C., & Yannis, G. (2013). Explaining the road accident risk: Weather effects. Accident Analysis and Prevention, 60, 456–465. Retrieved from https://doi.org/10.1016/j.aap.2013.03.006
- Chen, H., Cao, L., & Logan, D.B. (2012). Analysis of risk factors affecting the severity of intersection crashes by logistic regression. Traffic Injury Prevention, 13(3), 300–307.
- Cheng, C. (2015). Do cell phone bans change driver behavior? Economic Inquiry, 53(3), 1420–1436. Retrieved from https://doi.org/10.1111/ecin.12166
- City of Palermo. City Accident Reports. (2013). Retrieved from https://www.comune.palermo.it/polizia_municipale.php?sel=2&asel=23
- Elvik, R., & Mysen, A. (1999). Incomplete accident reporting: Meta-analysis of studies made in 13 countries. Transportation Research Record: Journal of the Transportation Research Board, 1665, 133–140.
- European Union (EU). (2015). Interim evaluations of the policy orientations on road safety 2011–2020. Retrieved from https://ec.europa.eu/transport/road_safety/sites/roadsafety/files/pdf/interim_eval_2011_2020/interim_eval.pdf
- European Union (EU). (2016). Mobility and transport: Road safety. Brussels: Author.
- Eurostat. (2015). Transport accident statistics. Retrieved from http://ec.europa.eu/eurostat/statistics-explained/index.php/Transport_accident_statistics-Road_accident_statistics
- Garrido, R., Bastos, A., de Almeida, A., & Elvas, J.P. (2014). Prediction of road accident severity using the ordered probit model. Transportation Research Procedia, 3, 214–223.
- Hauer, E. (2006). The frequency-severity indeterminacy. Accident Analysis & Prevention, 38(1), 78–83.
- Hauer, E., & Hakkert, A.S. (1988). Extent and some implications of incomplete accident reporting. Transportation Research Record, 1185, 1–10.
- Istituto Nazionale di Statistica. (2015). Road accidents: Year 2014. Retrieved from http://www.istat.it/it/files/2015/11/Incidenti-stradali2014.pdf?title=Incidenti+stradali+in+Italia+-+03%2Fnov%2F2015+-+Testo+integrale.pdf
- Istituto Nazionale di Statistica. (2016). Road accidents: Year 2015. Retrieved from http://www.istat.it/en/archive/189325
- Jackisch, J., Sethi, D., Mitis, F., Szymañski, T., & Arra, I. (2015). European facts and the global status report on road safety 2015. Copenhagen, Denmark: WHO, Regional Office for Europe.
- Jones, J., & Bullen, N. (1994). Contextual models of urban house prices: A comparison of fixed and random-coefficient models developed by expansion. Economic Geographers, 70(3), 252–272.
- Milton, J.C., Shankar, V.N., & Mannering, F.L. (2008). Highway accident severities and the mixed logit model: An exploratory empirical analysis. Accident Analysis & Prevention, 40(1), 260–266.
- Nofal, F.H., & Saeed, A.A. (1997). Seasonal variation and weather effects on road traffic accidents in Riyadh city. Public Health, 111(1), 51–55. Retrieved from http://www.ncbi.nlm.nih.gov/pubmed/9033225
- Organisation for Economic Co-operation and Development. (2006). Young drivers: The roads to safety. Retrieved from http://www.oecd.org/itf/37556934.pdf
- Patil, S., Geedipally, S.R., & Lord, D. (2012). Analysis of crash severities using nested logit model – accounting for the underreporting of crashes. Accident Analysis & Prevention, 45, 646–653.
- Savolainen, P.T., Mannering, F.L., Lord, D., & Quddus, M.A. (2011). The statistical analysis of highway crash-injury severities: A review and assessment of methodological alternatives. Accident Analysis & Prevention, 43(5), 1666–1676.
- Shankar, V., Mannering, F., & Barfield, W. (1996). Statistical analysis of accident severity on rural freeways. Accident Analysis & Prevention, 28(3), 391–401.
- Tay, R., & Rifaat, S. M. (2007). Factors contributing to the severity of intersection crashes. Journal of Advanced Transportation, 41(3), 245–265.
- Theofilatos, A., Graham, D., & Yannis, G. (2012). Factors affecting accident severity inside and outside urban areas in Greece. Traffic Injury Prevention, 13(5), 458–467.
- Theofilatos, A., & Yannis, G. (2014). A review of the effect of traffic and weather characteristics on road safety. Accident Analysis & Prevention, 72, 244–256.
- Tsui, K.L., So, F.L., Sze, N.-N., Wong, S.C., & Leung, T.-F. (2009). Misclassification of injury severity among road casualties in police reports. Accident Analysis & Prevention, 41(1), 84–89.
- Viano, D.C., & Parenteau, C.S. (2012). Front-to-rear crashes involving two vehicles with severe driver injury. Traffic Injury Prevention, 13(1), 55–60. Retrieved from https://doi.org/10.1080/15389588.2011.625735
- World Health Organization (WHO). (2016). Road traffic injuries: Year 2016. Retrieved from http://www.who.int/mediacentre/factsheets/fs358/en/
- Yasmin, S., & Eluru, N. (2013). Evaluating alternate discrete outcome frameworks for modeling crash injury severity. Accident Analysis & Prevention, 59, 506–521.
- Zhang, J., Lindsay, J., Clarke, K., Robbins, G., & Mao, Y. (2000). Factors affecting the severity of motor vehicle traffic crashes involving elderly drivers in Ontario. Accident Analysis and Prevention, 32(1), 117–125. Retrieved from https://doi.org/10.1016/S0001-4575(99)00039-1
Appendix.
Univariate analysis of injury propensity in Palermo, Italy (N = 2518).