Abstract
Nano-sized magnesium ferrite was synthesised using co-precipitation and sol-gel techniques. Structural characterisation was performed using X-ray diffractometer (XRD), Fourier transform infrared (FTIR) spectrometer and scanning electron microscope. XRD analysis reveals the prepared samples are single phasic without any impurity. Particle size calculation shows that the crystallite size of sol-gel prepared samples is 9 nm and co-precipitation sample is 11 nm. FTIR analysis confirmed spinel structure of the prepared samples. Magnetic measurements show that both the samples are ferromagnetic with a high degree of isotropy in co-precipitation derived sample. The frequency dependence of the dielectric constant in the range 100 Hz–20 MHz was also investigated in the temperature range 303–533 K. The results of both the samples followed Maxwell–Wagner model based on interfacial polarisation in consonance with Koops theory.
1. Introduction
Diverse practical applications of spinel ferrites of the type MFe2O4 has attracted the attention of researchers for decades. Nano-sized magnetic ferrite particles exhibit unique properties, which enable their use in a wide range of applications such as high density recording, high frequency devices and magnetic refrigerators Citation1,Citation2. There are several methods for synthesising nano-sized spinel ferrites, such as co-precipitation, sol-gel, microemulsion, hydrothermal and reverse micelle method Citation3–5. Magnesium ferrite is a typical spinel in which the cation distribution in the crystal lattice site is sensitive to heat treatment due to high diffusibility of Mg2+ ions Citation6,Citation7. Magnesium ferrites are used as humidity sensors Citation8, catalysts Citation9 and also in magnetic and gas sensing applications Citation10,Citation11. When its crystallite size is below a certain value, MgFe2O4 possesses unique superparamagnetic properties at room temperature and has promising potential for applications in transformers, ferrofluids and magnet cores of coils Citation12,Citation13.
2. Experimental techniques
2.1. Synthesis of nano-sized magnesium ferrite
Sol-gel combustion method was used for preparation of magnesium ferrite nanoparticles. AR grade magnesium nitrate and ferric nitrate were used as chemical precursors in ethylene glycol as solvent. Nitrates in the required stoichiometric ratio were dissolved in a minimum amount of ethylene glycol at room temperature, and the sol was heated at 60°C to obtain a wet gel. This gel was dried at 120°C, which self ignites to form a fluffy product. This is then ground to form fine powders of magnesium ferrite. This sample is labelled as S1.
For co-precipitation, route preparation of magnesium ferrite aqueous solutions of 1 molar magnesium nitrate and 2 molar ferric nitrate were mixed to form a solution. This solution was poured quickly into a boiling 10 M NaOH solution, diluted in 1800 ml of water under vigorous stirring. The pH of the solution was fixed at 10 to get the precipitate. The solution was kept at 90°C for 40 min under vigorous stirring. The precipitate was washed several times with distilled water, then filtered and dried in oven. This sample is labelled as C1.
Both the prepared samples were fired at 500°C for 3 h. The samples were pelletised into cylindrical disc-shape using a hydraulic press by applying a uniform pressure of 5 tons and were sintered at 500°C in the furnace for 24 h for doing the dielectric measurements.
2.2. Characterisation
Structural characterisation was performed using X-ray diffraction (XRD) analysis. X-ray powder diffractometer (RINT 2000, Rigaku, Texas, USA) with Cu-Kα radiation (λ = 1.54059 Å) at 40 kV and 30 mA performed a scanning from 20° to 80° at a step size of 0.02°/s for each sample. The crystal structure, lattice parameter, crystallite size, X-ray density, bulk density and porosity were determined from the XRD pattern.
The Fourier transform infrared (FTIR) absorption spectra of the samples were recorded using the FTIR spectrometer (Thermo Nicolet, Avatar 370) in the wave number range 4000 to 400 cm–1 with potassium bromide (KBr) as solvent. Magnetic characterisation of the samples were carried out by vibration sample magnetometer at room temperature with a maximum applied field of 20 kOe using Lakeshore VSM 7410. Wayne Kerr made 6500B high precision impedance analyser was used to determine the dielectric properties.
3. Results and discussion
3.1. XRD studies
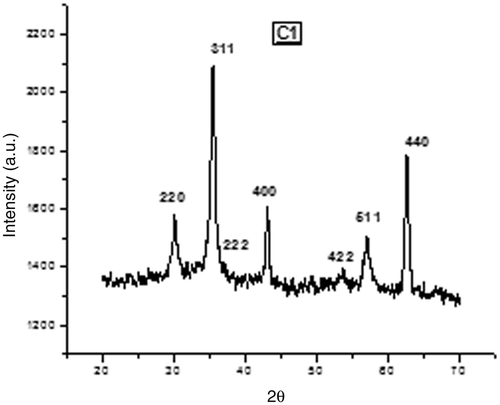
The XRD pattern of the prepared samples S1 and C1 are shown in and . The XRD pattern confirms the formation of single phase fcc spinel structure with no extra lines corresponding to any other crystallographic phase (compared with JCPDC card no: 17-0464).
Figure 1. XRD pattern of MgFe2O4 (S1) prepared by sol-gel method.
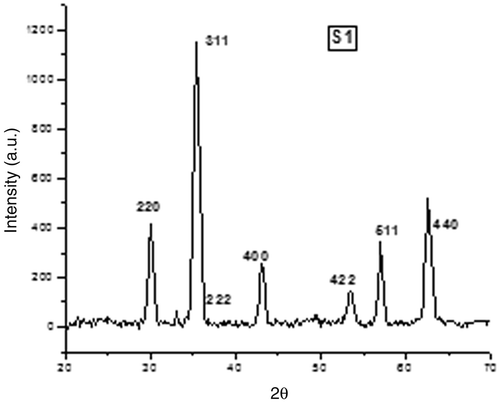
Figure 2. XRD pattern of MgFe2O4 (C1) prepared by co-precipitation method.
The lattice constant a is calculated using Bragg's equation
As each primitive unit cell of the spinel structure contains eight molecules, the value of X-ray density (ρx ) was determined according to the relation
Table 1. Data on lattice parameter (a), crystalline size (D), X-ray density (ρ x) of MgFe2O4 prepared using sol-gel and co-precipitation techniques
3.2. FTIR-spectra
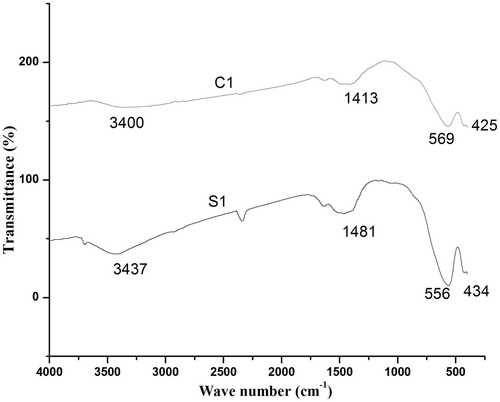
Infrared spectra of MgFe2O4 ferrite system is shown in . FTIR spectrum analysis helps us to confirm the formation of the spinel structure in ferrites. Two major absorption bands are found in the range 600–550 cm−1 and 450–385 cm−1. The higher frequency band (ν 1) is due to the stretching vibration of unit cell of the spinel in the tetrahedral (A) site and the lower frequency band (ν 2) is caused by metal–oxygen vibration in octahedral (B) site Citation15. Therefore, FTIR results confirm the spinel structure formation of the prepared samples. The bands corresponding to 3400 cm and 1600 cm−1 represent stretching and bending vibrations of H–O–H, which indicates the presence of free or absorbed water in the samples. This is confirmed in the dielectric studies of these samples also.
Figure 3. FTIR spectra of MgFe2O4 samples S1 and C1.
3.3. Magnetic properties
Magnetic characterisations of the samples were carried out by vibration sample magnetometer at room temperature with a maximum applied field of 20 kOe. Typical magnetic hysteresis loop of samples S1 and C1 is shown in . From the figure, it is clear that saturation magnetisation is not attained by both the samples even at the maximum applied field of 20 kOe. The saturation magnetisation (M s), coercivity (H c) and remanence (M r) of the samples are shown in .
Figure 4. Hysteresis loop of MgFe2O4 samples S1 and C1.
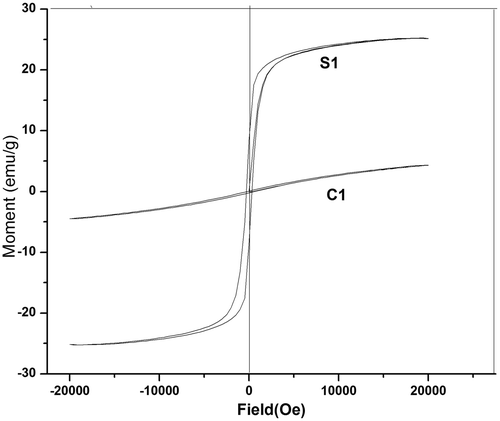
Table 2. Comparison of magnetic parameters of samples S1 and C1
The saturation magnetisation values of both the samples are less than that for bulk MgFe2O4 Citation16. The value of saturation magnetisation depends on the grain size and preparation temperature Citation17. The low value of M s for C1 is due to the fact that its preparation temperature was only 373 K, whereas for S1, the temperature of synthesis was 393 K. The coercivity and magnetic remanence values of S1 and C1 are also small when compared with bulk samples. All these point to the existence of a metastable cation distribution, which results in different exchange interactions and thereby modifies the magnetic properties Citation4.
The saturation magnetisation is related to coercivity through Brown's relation
Our experimental data are consistent with this relation Citation18. The remanent ratio R = M r/M s shows the ease with which the direction of magnetisation reorients to the nearest easy axis direction after the field is removed. The low value of R indicates the isotropic nature of the material Citation19. Therefore co-precipitation route sample shows more isotropy than that of the sol-gel-derived sample.
3.4. Dielectric measurements
Dielectric measurements were carried out on the prepared samples using a home-made dielectric cell and a high precision LCR meter (Wayne Kerr 6500B) in the frequency range 100 Hz–30 MHz. The principle of parallel plate capacitor was employed for the evaluation of permittivity. The dielectric permittivity was calculated using the relation C
, where C is the capacitance of the parallel plate capacitor with thickness d and area of cross section A, ε
0 the permittivity of free space and ε
r the relative permittivity of the dielectric material. Capacitance C and dissipiation factor tan δ are measured from the LCR meter.
The loss factor or dissipation factor in any dielectric is given by the relation
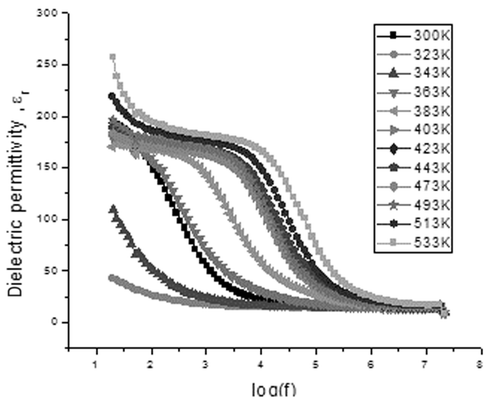
The variation of the real part of dielectric permittivity, ε r, with frequency is termed as the dielectric dispersion and dielectric dispersion for sample C1 is shown in and for S1 is shown in . The value of permittivity was found to decrease with increasing frequency for all samples, which can be considered as a normal dielectric behaviour Citation21. This decrease was rapid at lower frequencies and slower at higher frequencies. The decrease in ε r with frequency can be explained on the basis of Koops theory Citation22, which considers the dielectric structure as an inhomogeneous medium of two layers of the Maxwell–Wagner type Citation23. The dielectric structure can be supposed to be composed of a highly conducting grain separated by relatively poor conducting substance called the grain boundaries. This causes the localised accumulation of charges under the influence of electric field, which results in interfacial polarisation. At higher frequencies, the electron exchange between ferrous and ferric ions produces local displacements in the direction of the applied external field, which results in polarisation. Therefore, this exchange cannot follow the alternating field, which results in a decrease in the contribution of interfacial polarisation in dielectric constant.
Figure 5. Variation of dielectric constant (εr) of C1 with frequency at different temperatures.
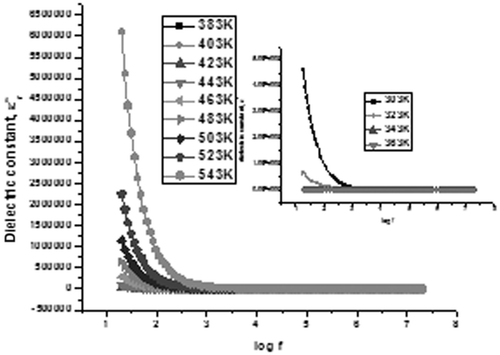
Figure 6. Variation of dielectric constant (εr) of S1 of with frequency at different temperatures.
For magnesium ferrites, the conduction process can be explained on the basis of electron hopping between Fe2+ and Fe3+ and hole hopping between Mg2+ and Mg3+ on the octahedral sites. In the Rezlescu model, the hopping of electrons/holes results in the local displacements of the electrons/holes, which collectively contribute to the total polarisation Citation24. The electron exchange between Fe2+ and Fe3+ ions and the holes that transfer between Mg3+and Mg2+ ions are responsible for electric conduction and dielectric polarisation in magnesium ferrites. At higher frequencies, the frequency of electron/hole exchange will not be able to follow the applied electric field, thus resulting in a decrease in polarisation. Consequently, the dielectric permittivity attains a constant value.
The inset in shows the variation of dielectric constant with frequency at temperature from 303 K to 363 K. Dielectric permittivity values for temperature from 383 K to 543 K show an increasing trend. A sudden decrease in ε′ is found in all frequencies from room temperature till 363 K, and afterwards it increases. The initial decrease may be contributed due to the presence of absorbed water content in the sample. As the temperature increases, the orientations of interface dipoles are facilitated and this enhances the dielectric permittivity. For sample S1 also, a similar variation is seen (). However, a decrease in ε′ is found in all frequencies only till the temperature reaches 323 K, and afterwards it increases.
At lower frequencies, the rapid increase in dielectric constant with temperature is mainly due to polarisation as a result of interfacial dipoles, which are strongly dependent on temperature Citation25. As temperature increases, the accumulation of charges on the grain boundaries increases, which causes an increase in the interfacial polarisation at lower frequencies. Therefore, dielectric polarisation increases, resulting in an increase of ε′ with temperature at lower frequencies.
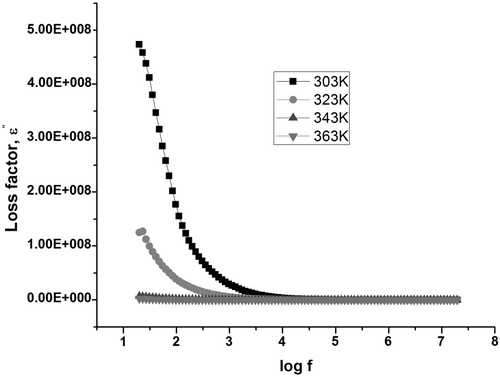
Dielectric absorption in a material is characterised by tan δ and dielectric loss (ε″) values. The variation of the dissipation factor with frequency in samples C1 () and S1 ( and ) exhibits relaxation at specific frequencies in all temperatures. Dielectric relaxation occurs when the hopping frequency of charge carriers is equal to the frequency of the applied field Citation26.
Figure 7. Variation of tanδ of C1 of with frequency at different temperatures.
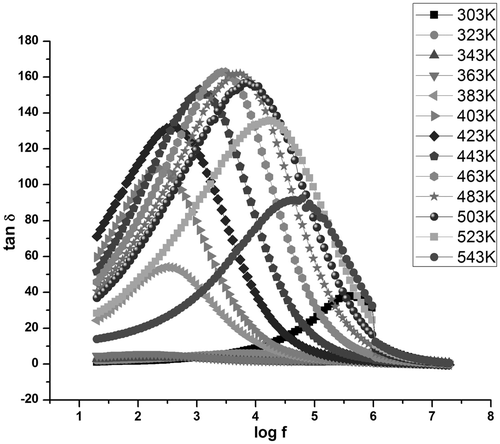
Figure 8. Variation of tanδ of S1 of with frequency at different temperatures.
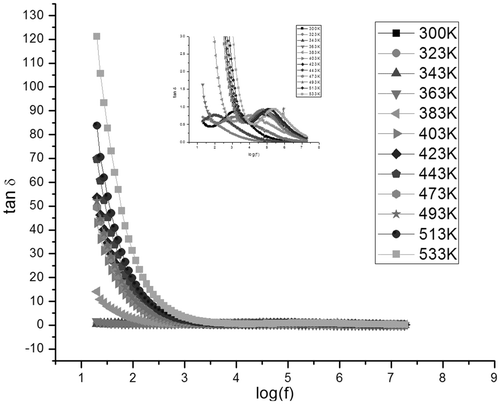
Figure 9. Variation of ac conductivity of C1 of with frequency at different temperature from 303 K to 363 K.
3.5. a.c. Conductivity studies
The variation of ac conductivity with frequency and temperature for samples C1 and S1 is given in and , respectively. It is observed that the ac conductivity increases with frequency for S1. However, in C1, it is observed that initially the ac conductivity increases with frequency, reaches a maximum and then decreases. As the frequency of the applied field increases, hopping of charge carriers also increases thereby increasing the conductivity. However, at higher frequencies, the hopping of charge carriers could not follow the applied field frequency and it lags behind the applied frequency resulting in a decrease in the ac conductivity values.
Figure 10. Variation of ac conductivity of C1 of with frequency at temperature from 383 K to 543 K.
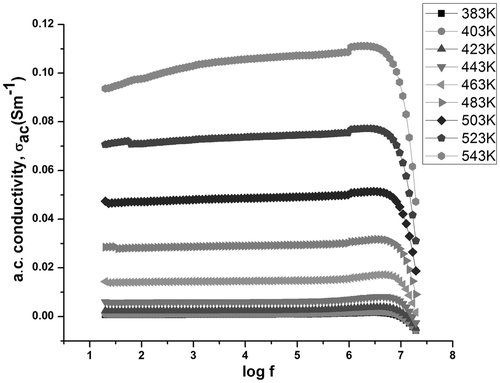
Figure 11. Variation of a.c. conductivity of S1 of with frequency at different temperatures.
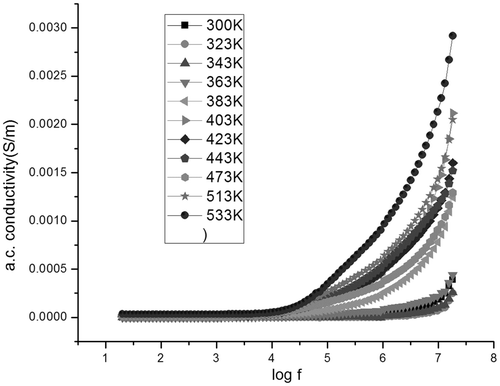
In S1, as the frequency of the applied field increases, hopping of charge carriers also increases thereby increasing the conductivity. However, both the samples show a similar trend as that of dielectric permittivity with temperature, i.e., the ac conductivity decreases till the temperature reaches 363 K for C1 and 323 K for S1, and then increases with temperature (). The initial decrease can be explained to be due to the presence of water in the samples. The increase of ac conductivity with frequency and temperature could also be explained on the basis of Koops model, which assumes that ferrite samples act as a multilayer capacitor Citation14,Citation27. According to this model, at low frequencies, the conductivity is due to the grain boundaries, whereas the dispersion at higher frequencies is due to the conducting grains.
4. Conclusions
Magnesium ferrite nanoparticles were synthesised by sol-gel technique and co-precipitation method successfully. XRD analysis revealed that the prepared samples are single phasic cubic spinel without any trace of impurity. The crystallite size of the particles is calculated from XRD is 9 nm for the sol-gel sample and 12 nm for the co-precipitation sample. The absorption bands ν 1 and ν 2 in FTIR are found to remain in the expected range of ferrite for both the samples, which confirms the spinel structure. The presence of absorbed water in the sample is evident from FTIR analysis. The magnetic measurement shows both samples to be ferrimagnetic with a hysteresis. The saturation magnetisation value for the co-precipitation sample is very low when compared with the sol-gel sample. The low value of remanent ratio shows isotropy of the co-precipitation route prepared sample. The variation of dielectric constant and loss factor with frequency was explained on the basis of Maxwell–Wagner theory of interfacial polarisation in consonance with Koops theory. The dielectric permittivity and ac conductivity values are highly temperature dependent, which in general increases with temperature. However, there is an initial decrease in permittivity values till the temperature reaches 323 K for sol-gel samples and 363 K for co-precipitation samples, which can be explained due to the presence of absorbed water content in the sample.
Acknowledgments
The authors thank SAIF, CUSAT Kochi and SAIF, IIT Madras for providing FTIR and VSM measurement facilities.
References
- Verma , S , Joy , P A , Khollam , Y B , Potdar , H S and Deshpande , S B . 2004 . Synthesis of nanosized MgFe2O4 powders by microwave hydrothermal method . Mater. Lett. , 58 : 1092 – 1095 . doi: 10.1016/j.matlet.2003.08.025
- Yang , X and Dong , J . 2005 . Ferromagnetism of an all-carbon composite composed of a carbon nanowire inside a single-walled carbon nanotube . Appl. Phys. Lett. , 86 : 163105 doi: 10.1063/1.1899769
- Veena Gopalan , E , Al-Omari , I A , Malini , K A , Joy , P A , Sakthi Kumar , D , Yoshida , Y and Anantharaman , M R . 2009 . Impact of zinc substitution on the structural and magnetic properties of chemically derived nanosized manganese zinc mixed ferrites . J. Magn. Magn. Mater. , 321 ( 8 ) : 1092 – 1099 . doi: 10.1016/j.jmmm.2008.10.031
- Veena Gopalan , E , Malini , K A , Saravanan , S , Sakthi Kumar , D , Yoshida , Y and Anantharaman , M R . 2008 . Evidence for polaron conduction in nanostructured manganese ferrite . J. Phys. D: Appl. Phys. , 41 : 185005 doi: 10.1088/0022-3727/41/18/185005
- Srivastava , M , Chaubey , S and Ojha , A K . 2009 . Investigation on size dependent structural and magnetic behavior of nickel ferrite nanoparticles prepared by sol–gel and hydrothermal methods . Mater. Chem. Phys. , 118 ( 1 ) : 174 – 180 . doi: 10.1016/j.matchemphys.2009.07.023
- Kawade , V B , Bichile , G K and Jadhav , K M . X-ray and infrared studies of chromium substituted magnesium ferrite, Mater. Lett. 42 (2000), pp. 33–37
- Gorter , E W . 1950 . Magnetization in ferrites: Saturation magnetization of ferrites with spinel structure . Nature , 165 : 798 doi: 10.1038/165798a0
- Shimizu , Y , Arai , H and Seiyama , T . 1985 . Theoretical studies on the impedance-humidity characteristics of ceramic humidity sensors . Sens. Actuators , 7 : 11 – 22 . doi: 10.1016/0250-6874(85)87002-5
- Busca , G , Finocchio , E , Lorenzelli , V , Trombetta , M and Rossini , S A . 1996 . IR study of alkene allylic activation on magnesium ferrite and alumina catalysts . J. Chem. Soc., Faraday Trans. , 92 : 4687 – 4693 . doi: 10.1039/ft9969204687
- Goldman , A . 1990 . Modern Ferrite Technology , New York : Van Nostrand .
- Liu , Y-L , Liu , Z-M , Yang , Y , Yang , H-F , Shen , G-L and Yu , R-Q . 2005 . Simple synthesis of MgFe2O4 nanoparticles as gas sensing materials . Sens. Actuators B , 107 : 600 – 604 . doi: 10.1016/j.snb.2004.11.026
- Jiang , Z X and Alkemade , P FA . 1998 . The complex formation of ripples during depth profiling of Si with low energy, grazing oxygen beams . Appl. Phys. Lett. , 73 : 315 – 317 . doi: 10.1063/1.121819
- Oliver , S A , Willey , R J , Hamdeh , H H , Oliveri , G and Busca , G . 1995 . Structural and magnetic properties of mangnesium ferrite fine powders . Scripta Metall. Mater. , 33 : 1695 – 1701 . doi: 10.1016/0956-716X(95)00412-O
- Viswanathan , B and Murthy , V RK . 1990 . Ferrite, Material Science and Technology , 6 New Delhi : Narosa Publishing House .
- Waldron , R D . 1955 . Infrared spectroscopy of ferrites . Phy. Rev. , 99 : 1727 – 1735 . doi: 10.1103/PhysRev.99.1727
- Franco, Jr. , A and Silva , M S . 2011 . High temperature magnetic properties of magnesium ferrite nanoparticles . J. Appl. Phys. , 109 : 07B505
- Khot , S S , Shinde , N S , Ladgaonkar , B P , Kale , B B and Watawe , S C . 2011 . Magnetic and structural properties of Magnesium Zinc Ferrites synthesized at different temperature . Adv. Appl. Sci. Res. , 2 ( 4 ) : 460 – 471 .
- Jacob , B P , Thankachan , S , Xavier , S and Mohammed , E M . 2011 . Effect of Gd3+ doping on the structural and magnetic properties of nanocrystalline Ni–Cd mixed ferrite . Phys. Scr. , 84 : 045702 doi: 10.1088/0031-8949/84/04/045702
- Shirsath , S E , Toksha , B G and Jadhav , K M . 2009 . Structural and magnetic properties of In3+ substituted NiFe2O4 . Mater. Chem. Phys. , 117 : 163 – 168 . doi: 10.1016/j.matchemphys.2009.05.027
- Dormann , J L and Fiorani , D . 1995 . Nanophase magnetic materials: Size and interaction effect on static and dynamic property of fine particles . J. Magn. Mater. , 140–144 : 415 – 418 . doi: 10.1016/0304-8853(94)00591-5
- Gabal , M A and Al Angari , Y M . 2009 . Effect of diamagnetic substitution on structural, magnetic and electrical properties of NiFe2O4 . Mat. Chem. Phys. , 115 : 578 – 584 . doi: 10.1016/j.matchemphys.2008.12.032
- Koops , C G . 1951 . On the dispersion of resistivity and dielectric constant of some semiconductors at audio frequencies . Phys. Rev. , 83 : 121 – 124 . doi: 10.1103/PhysRev.83.121
- Wagner , K W . 1973 . Dissipiation of energy under a.c. . Am. Phys. , 40 : 317
- Rezlescu , N and Rezlescu , E . 1974 . Dielectric properties of copper containing ferrites . Phys. Status Solidi (a) , 23 ( 2 ) : 575 – 582 . doi: 10.1002/pssa.2210230229
- Fang , H , Chen , B , Jiang , K , Sha , J , Jiao , Z , Zhang , Q and Zhang , L . 1995 . Anomalous dielectric behavior in nanostructured alpha-Fe2O3 . Phys. Status Solidi (b) , 192 : K11 – K14 . doi: 10.1002/pssb.2221920127
- Abo El Ata , A M and Attia , S M . 2003 . Dielectric dispersion of Y-type hexaferrites at low frequencies . J. Mag. Mag. Mater. , 257 : 165 – 174 . doi: 10.1016/S0304-8853(02)00446-8
- Bhosale , J L , Kulkarni , S N , Sasmite , R B and Chaugule , P K . 1999 . Effect of Gd3+ doping on initial permeability of Mg–Cd mixed ferrite . Indian J. Pure Appl. Phys. , 33 : 412 – 414 .