
Abstract
The nanochain-like agglomerates and spherical nanovesicles were formed from supramolecular self-assembly of 4,4′-diaminonenzanilide (DABA) with α- and β-cyclodextrins. The DABA with α-CD and β-CD inclusion complex nanomaterials were prepared and characterised by transmission electron microscopy, scanning electron microscopy, FTIR, differential scanning calorimetry, 1H NMR and powder X-ray diffraction. 1H NMR analysis indicated that the benzamido ring of DABA was encapsulated into the cyclodextrin (CD) cavity. Absorption and fluorescence spectral studies suggested that DABA forms different types of nanomaterials in α-CD and β-CD solutions. Higher occupied molecular orbital, lower unoccupied molecular orbital, and thermodynamic parameter values confirmed DABA dye entrapped in the CD cavities.
1. Introduction
Cyclodextrins (CDs) are cyclic molecules consisting of six (α-), seven (β-) or eight (γ-) glucose units correlated by α-1-4 glycosidic linkages. They have polar external surfaces and non-polar internal cavities,[Citation1,2] and can form inclusion complexes by binding small guest molecules.[Citation3] CDs can form different aggregates under different conditions. Many new supramolecular assemblies have been planned, such as supramolecular gels,[Citation4] supramolecular polymers,[Citation5,6] rotaxanes,[Citation7] nanospheres,[Citation8] and vesicles based on CD inclusion complexes. The vesicles prepared by CD inclusion complexes have gained much attention due to their importance in enthusiastic natural biomembranes,[Citation9,10] developing new biotechniques, smart materials, etc.[Citation11] Reports are available on substituted CD bilayer vesicles [Citation12] and β-CD substituted by carboxymethyl and amino groups on the narrow and wider sides, respectively,[Citation13] to form supramolecular tapes which were 50–300 nm wide and up to 20 mm in length. The self-assembly of vesicles is based on the supramolecular complexation of guest-β-CD and guest in two-head inclusion model as well as one-head inclusion model.[Citation14] The vesicles were formed based on the amphiphilied CDs, or the mixtures of CDs with amphiphilic guest molecules.[Citation15] The amphiphilied CDs might be obtained by covalently modifying native CDs with hydrophobic functions. Jing et al. [Citation16] reported the formation of vesicle system by β-CD with the mixture of 1-naphthyl ammonium chloride and amphiphilic sodium bis(2-ethyl-1-hexyl) sulphosuccinate. The nanosized colloidal particles have been developed and proposed for drug delivery, because they can dissolve the poorly water-soluble drugs and offer prolonged release. Among colloidal carriers (liposomes, microparticles and nanoparticles) have been meticulously explained as a new technological progress towards drug synthesis. CDs and their derivatives have been used as solubilisers to improve the loading capability of liposomes, microparticles and nanoparticles.[Citation17] The polymeric nanoparticles holding CD/nanoparticles of poly (butylcyanoacrylate) have been prepared in the presence of CDs.[Citation18] The cyclodextrin-based nanosponges have the ability to include either lipophilic or hydrophilic drugs and to release them slowly into physiological media.[Citation19] The nanosponges improved the aqueous solubility of lipophilic drugs or protected the degradable molecules. They also investigated the spherically shaped nanoparticles to formulate drug delivery systems for various administration routes beside the oral one. Nanospheres and nanocapsules have also been made from CD modified on the secondary face with C6 aliphatic esters using the nanoprecipitation technique.[Citation20] The other type of nanostructure and microstructure complex is based on the supramolecular amphiphiles.
The aim of this work was to establish a prospect of obtaining nano-inclusion complex of DABA () with α-CD and β-CD by co-precipitation method and characterised by scanning electron microscope (SEM), transmission electron microscope (TEM), FTIR, differential scanning colorimeter (DSC), powder X-ray diffraction (PXRD) and 1H NMR. The formation of DABA:CD inclusion complex has been performed by different methods. Furthermore, the spectral properties of DABA and inclusion complexes were determined by ultraviolet–visible (UV–Vis), fluorescence and fluorescence lifetime measurements. Moreover, to explore the host–guest interaction and to study the conformational behaviour of the isolated DABA and its complex, the inclusion complex was investigated by semi-empirical calculation (PM3 method) in vacuum.
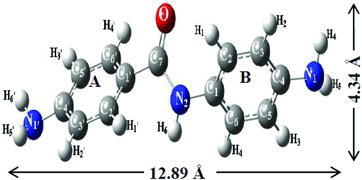
Figure 1. PM3-optimised structure of DABA.
2. Experiments
2.1. Instruments
SEM photographs were collected on a JEOL JSM 5610LV instrument. The morphology of DABA, CDs and the inclusion complexes were investigated by TEM using a TECNAI G2 microscope with accelerating voltage 200 kV, using carbon-coated copper TEM grid (200 mesh). FTIR spectra were measured between wave numbers of 4000 and 400 cm−1 on Nicolet Avatar 360 FTIR spectrometer by using KBr to make pellets. 1H NMR spectra were recorded on a Bruker AVANCE 400 MHz spectrometer using DMSO-d6 (99.9%) as a solvent. Differential scanning calorimeter (DSC) data were recorded using Mettler Toledo DSC1 fitted with STRe software. The temperature scanning range was from 25 to 220 °C with a heating rate of 10 °C/min. PXRD spectra were recorded with a BRUKER D8 advance diffractometer and the pattern was measured in the 2θ angle range between 5° and 80° with a scan rate of 5°/min. Absorption spectral measurements were carried out with a Shimadzu UV–visible spectrophotometer (model UV 1650 PC) and steady-state fluorescence measurements were made by using a Shimadzu spectrofluorimeter (model RF-5301). The fluorescence lifetime measurements were performed using a picosecond laser and single photon counting set-up from Jobin-Vyon IBH.
2.2. Reagents and materials
DABA, α-CD and β-CD were purchased from Sigma-Aldrich Chemical Company and used without further purification. Triply distilled water was used for the preparation of aqueous solutions. Spectrograde solvents were used for the study and all the spectral measurements were performed at the DABA concentration of 4 × 10⁻⁵ M. The concentrations of α-CD and β-CD solutions were varied from 1 × 10⁻³ to 10 × 10−3 M.
2.3. Preparation of nanomaterials
The inclusion complex nanomaterials were prepared by using a co-precipitation method. CD (1 mmol) was dissolved in 40 ml distilled water, and DABA (1 mmol) in 10 ml methanol was slowly added to the CD solution. This mixture was sonicated at 50 °C for three hours. Then the solution was refrigerated overnight at 5 °C. The DABA:CD complex precipitate was recovered by filtration and washed with small amount of ethanol and water to remove uncomplexed drug and CDs, respectively. This precipitate was dried in vacuum at room temperature for two days and stored in an airtight bottle. These powder samples were used for further analysis.
2.4. Molecular modelling studies
The theoretical calculations were performed with Gaussian 03W. Theoretical calculations were carried out in the gas phase and the solvent effects were not considered in the calculations. The preliminary geometry of the guest and CDs were constructed with Spartan 08 and then optimised by the PM3 method. α-CD and β-CD were completely optimised by PM3 without any symmetry limit.[Citation21]
3. Results and discussion
3.1. Absorption and emission analysis
Absorption and fluorescence spectral maxima of DABA are recorded at different concentrations (pH ∼ 6.5) of α-CD and β-CD, and are shown in . Upon increasing the concentration of CDs, the absorbance increased at the same wavelength (Figure S1). The above results are due to encapsulation of this molecule from more protic environments (bulk aqueous phases) to less protic CD cavity environments. A clear isosbestic point is noticed, indicating that a 1:1 inclusion complex was formed between DABA and CDs.[Citation22,23] In both α-CD and β-CD solutions, the increase in the absorbance indicates that the aromatic ring of the DABA is encapsulated in the CD cavity.[Citation22–26]
Table 1. Absorption and fluorescence maxima of DABA with different solvents, α-CD and β-CD concentrations.
The emission spectra of the DABA molecule in different α-CD and β-CD concentrations are shown in . DABA shows single emission in water at 376 nm, while dual emission is noticed in the CDs. A new longer wavelength (LW) emission maximum appeared at 440 nm (at 0.006 M CD) which was enhanced at the same wavelength up to 0.01 M of β-CD. In α-CD, the shorter wavelength (SW) emission intensity increased, whereas LW emission intensity decreased (). The binding constant values were calculated by using Benesi–Hildebrand equation,[Citation27,28] revealed that DABA formed a 1:1 inclusion complex with CD (Figure S2). The ΔG values are negative which suggests that the inclusion process proceeds spontaneously at 303 K ().
Figure 2. Fluorescence spectra of DABA in different α-CD (a) and β-CD (b) concentrations (M): (1) 0, (2) 0.001, (3) 0.002, (4) 0.004, (5) 0.006, (6) 0.008 and (7) 0.01 (λexcitation − 300 nm). Inset figure: fluorescence intensity vs. α-CD and β-CD concentrations.
3.2. Orientation of DABA in the CD nanocavity
Twisted intramolecular chare transfer (TICT) and the orientation behaviour of benzanilide derivatives in CD cavities have been explained in our previous articles.[Citation28–30] In the DABA molecule, the C═O and NH groups are partially protruding into the bulk phase. Such orientation has explained the TICT behaviour of DABA in α-CD and β-CD media. If C═O and NH groups of DABA are completely entrapped in the α-CD and β-CD cavities, the emission maxima should be similar to cyclohexane, because, the inside of the CD cavities provides the non-polar environment like cyclohexane. However, in DABA, the presence of NH2 group in polar environment diminishes the LW maxima in α-CD; i.e., in α-CD, the LW emission intensities were decreased, but the SW emission increased. However, in β-CD, the enhancement of TICT (longer wavelength) intensities (around 440 nm) suggests that C═O and –NH– groups are present in partial polar environment and the amino group was present in the outside of the CD cavity (Figure S3). This is because, if amino group is entrapped in the CD cavities, the emission maxima should be blueshifted.[Citation28–30] Further, in the CD medium, the monocation maximum is similar to aqueous medium suggesting that both amino groups of the DABA were present outside of the CD cavities (). The above discussions imply that the DABA forms different types of 1:1 inclusion complexes with α-CD and β-CD which lead to the formation of nanochain-like agglomerates and nanovesicles.
Table 2. Various prototropic maxima (absorption and fluorescence) of DABA in aqueous and β-CD medium.
3.3. Effect of solvents
In order to substantiate the interactions of the inclusion complexes, DABA was investigated in different polarity of solvents by means of absorption and fluorescence spectra. The absorption and fluorescence spectra of DABA were recorded in solvents of different polarity and hydrogen bonding tendency (). The redshifted spectral maxima were observed from cyclohexane to methanol, but blueshift was noticed in water. However, only a small absorption spectral shift was observed in the polar solvents. The spectral shifts observed in the absorption spectrum of DABA in polar and hydrogen bonding solvents are consistent with the characteristic behaviour of the amino group; i.e., hydrogen acceptor interactions of the solvents produce a redshift while hydrogen donor interactions produce a blueshift. Dioxane, acetonitrile and ethyl acetate are hydrogen acceptor solvents, whereas alcohol and water can behave as both hydrogen acceptor and donor solvents. Hydrogen donor interactions are predominant in methanol and water. It is also reported that the hydrogen donating capacity of water is more than that of methanol. This is also confirmed by the maximum blueshift observed in water. The absorption spectral characteristics of other benzanilide compounds were similar to those of the DABA molecule.[Citation28,29] The results propose that the LW absorption band can be assigned to the π−π* transition. Thus it may be suggested that the LW transition in DABA originates from the aniline ring and benzamido moiety may be tormenting this transition. Moreover, the results of DABA were similar to those observed for benzanilide derivatives.[Citation28,29]
DABA exhibits dual fluorescence in all the solvents. SW band decreases with the increase in the polarity and hydrogen bonding capacity of the solvents and is nearly absent in water. The redshifted fluorescence band maxima are going from non-polar to polar solvents and the redshift observed in the TICT band is more than that of the SW band. The fluorescence intensity ratio of SW band and TICT band decreases with an increase in the polarity of the solvents. The optimised structure shows that both the benzamido and aniline rings are present in twisted position (). The bond angles and dihedral angles () are also twisted as other TICT molecules.[Citation28,29] The enhancement of the normal emission band in non-polar and aprotic solvents may be due to lowering of solvent polarity and the energy of the ICT state goes up causing an increase in the energy barrier for transition between SW to ICT state. The presence of dual emission suggests that TICT is present in the molecule.
Table 3. Geometrical parameters of DABA before and after inclusion with α-CD and β-CD for the most stable inclusion complexes.
3.4. Fluorescence lifetime
The fluorescence lifetime values of DABA in acetonitrile, water, 0.01 M α-CD and β-CD environment have been monitored (Table S1 and Figure S4). We notice that two lifetime components (locally excited species and charge transfer species) arise from populations differing in the extent of H-bonding with these environments. Compared to water (λem − 376 nm: τave = 1.78 ns), acetonitrile shows higher lifetime (λem − 330 nm: τave = 3.06 ns, λem − 420 nm: τave = 2.07 ns). This is due to the formation of H-bonds with this compound. Moreover, compared to water, higher lifetime values were observed in the CDs (α-CD: λem − 376 nm: τave = 2.50 ns and β-CD: λem − 376 nm: τave = 0.42 ns and λem − 420 nm: τave = 1.97 ns). The above results support the formation of DABA:α-CD and DABA:β-CD inclusion complexes. The observed enhancement of lifetime indicates that the DABA molecule experiences hydrophobic environments within the CD cavities, whereas non-radiative decay processes were reduced. This may be due to the variation in the microscopic environment experienced by this molecule in the presence of the CD solution, which is expected to be quite different from the pure solvent. On the basis of this experiment, we propose that the molecule was encapsulated within the CD cavities. A similar variation of amplitudes, with large changes in lifetimes is observed with CDs.
3.5. Molecular modelling
The minimal energy of the molecular geometries was analysed by means of the stabilisation energy (ΔE) between DABA with α-CD and DABA with β-CD, according to the following equation:
The negative values of the energy suggest that thermodynamically the DABA forms more favourable inclusion complexes.[Citation29,Citation31–34] The stabilisation energy of inclusion complexes leads to exclusively negative values, which reveals that the energy of the inclusion complex is consistently lower than the sum of the isolated host and guest molecule energies. This shows a high possibility of inclusion complex development with DABA practically included in the α-CD and β-CD cavities.
In DABA molecule, the ‘A’ ring amino group is positioned near the narrow side of the β-CD cavity and the ‘B’ ring amino group is present far from the wider side of the cavity; however, both the amino groups are exposed in the outside of the α-CD cavity. It is not possible that the DABA molecule completely enters into the CD cavities, because the length of the molecule (12.96 Ǻ) is higher than the α-CD and β-CD cavities (7.8 Ǻ). shows bond distances, bond angles and the most interesting dihedral angles of the DABA molecule before and after complexation. Furthermore, in both CDs, the adjacent distance of 1,4-linkage oxygen molecule is 4.37 Ǻ which is changed to 4.48 Ǻ in α-CD and 4.48 Ǻ in β-CD after complexation with the guest molecule.
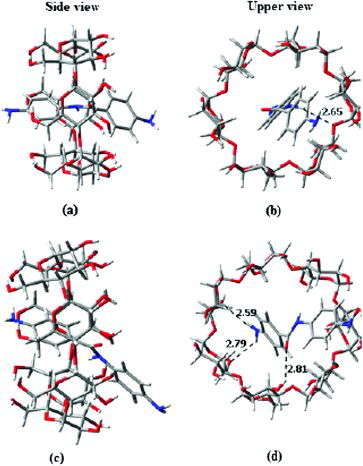
The intermolecular hydrogen bonding interaction (IHB) in both inclusion complexes are shown in and . In DABA:α-CD inclusion complex, one IHB has been identified between the host and the guest in the distance of 2.65 Å, i.e., between the amide group of hydrogen and 1,4-α- linkage oxygen atom of CD. However, three hydrogen bonds were identified in the DABA:β-CD inclusion complex: (1) two amino hydrogen (H5′ and H6′) atoms from DABA molecule and two primary hydroxy oxygen atoms from β-CD; the lengths of hydrogen bonds are 2.59 and 2.79 Å, respectively; and (2) carbonyl group of DABA and hydrogen atom from secondary hydroxyl group of β-CD; bond length is 2.81 Å. The hydrogen bonds increase the attractive force and stability of the inclusion complexes.[Citation29,Citation31–34] The non-bonded interaction between the DABA phenyl ring and the CDs might be liable for the variation in the stability of the inclusion complex.
Figure 3. (Colour online) Side and upper views of optimised DABA:CD inclusion complex: (a, b) DABA:α-CD, and (c, d) DABA:β-CD inclusion complexes. Blue, white, ash and bright red colours indicate nitrogen, hydrogen, carbon and oxygen atoms, respectively.
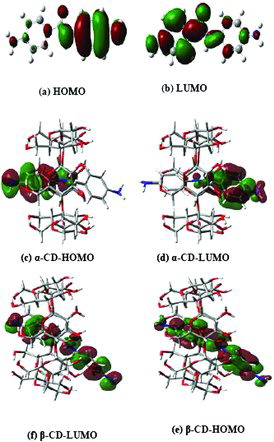
The higher occupied molecular orbital (HOMO) and lower unoccupied molecular orbital (LUMO) energies are important parameters in quantum chemical calculations. HOMO is the orbital that primarily acts as an electron donor and the LUMO is the orbital that primarily acts as the electron acceptor. In order to evaluate the energetic behaviour of the guest compound, energies of HOMO, LUMO and their orbital energy gaps were calculated by using the PM3 method and are summarised in . The three-dimensional (3D) plots of the frontier orbitals in the ground state HOMO and LUMO are shown in . In the molecular orbital diagram, the positive phase is shown in red and the negative one is in green colour. It can be seen from the 3D plots that the HOMO levels in DABA were spread over the entire ‘B’ ring along with the amino group, while the LUMO levels were spread over the DABA molecule but slightly low in ‘B’ ring compared to the ‘A’ ring. In the DABA:α-CD inclusion complex, HOMO level is almost uniformly distributed over the ‘B’ ring with the amide group, while in the case of LUMO it is found to be over the ‘A’ ring of DABA. On the other hand, in DABA:β-CD, the HOMO and LUMO levels were distributed over the DABA molecule, but LUMO levels are slightly low in both NH2 groups.
Table 4. HOMO–LUMO energies and thermodynamic parameter values for the DABA:CD inclusion complexes (using the PM3 method).
Figure 4. (Colour online) LUMO and HOMO pictures of isolated DABA and its inclusion complexes. Blue, white, ash and bright red colours indicate nitrogen, hydrogen, carbon and oxygen atoms, respectively. The green and dark red colours indicate negative and positive parts of the molecules, respectively.
HOMO–LUMO energy gap of both α-CD and β-CD inclusion complexes show the presence of charge transfer interaction in the DABA molecule (). The higher energy gap in both complexes explains the formation of more stable inclusion complexes. The frontier orbital energy gaps of DABA:α-CD and DABA:β-CD complexes are found to be 8.40 and 8.20 eV, respectively; it is higher than that of the native DABA molecule. The chemical potential (μ), softness (S), hardness (η), electrophilicity (ω) and zero point vibrational energy values of the isolated DABA are significantly changed in the inclusion complexes.
Compared to isolated DABA molecule, the polarity of the DABA in the CD cavities is decreased. The dipole moment values are listed in . The dipole moment of the DABA:α-CD complex (6.39 D) is lower than the dipole moment of isolated α-CD (11.34 D). The dipole moment of the DABA:β-CD complex (8.37 D) is lower than the dipole moment of native β-CD (12.59 D). Therefore, one can conclude that the dipole moment values show a strong correlation with the complexation behaviour.
3.6. Thermodynamic parameters
The energetic features of thermodynamic characteristics and electronic properties were calculated at 1 atm pressure and at 298.15 K, and are summarised in . In contrast to the complexation energy (ΔE), the optimised structure of DABA is encapsulated in the α-CD and β-CD cavity by −1248.37 and −1457.85 kcal/mol, respectively (). The enthalpy changes (ΔH), entropy contribution (ΔS) and Gibbs free energy (ΔG) were also calculated from the association of DABA with CDs. It can be observed that the DABA is bound to both CDs with favourable Gibbs free energy (ΔG < 0) which confirms that the inclusion process is spontaneous and favourable to experimental result. The negative ΔH and ΔS values indicate that both the inclusion complexes are an enthalpy driven process.
The experimental ΔE and ΔG values are different from the theoretical values. The difference in ΔE and ΔG can be explained by the solvent effect. The difference in the theoretical and experimental results can be explained by the solvent effect. The experiments were conducted in aqueous medium and the computational work was done in vacuum phase. We were unable to do the computational work at the aqueous medium due to system limitations. Unfortunately because of limitations in the calculation ability of the computer and the large molecular size of CD, calculations for these systems could not be performed for aqueous solutions and excited state. However, it is observed that the solvent effect on the host–guest interactions easily changes the inclusion reaction from a non-spontaneous process in the gas phase to a spontaneous one in the aqueous phase. The host–guest interaction causes an enthalpy–entropy compensating process in the gas phase, whereas the same interaction causes an enthalpy–entropy co-driven process in aqueous solution, due to release of number of water molecules from the cavity of β-CD in inclusion complexation.
Recently, some workers who encountered this discrepancy turned to experimental values to adjust their calculations. For example, in the case of the complexes of both cis and trans isomers of Brooker's merocyanine inserted within β-CD cavity, the Hamdi et al. [Citation35] calculations of ΔG values predicted that the complex would not form spontaneously and the magnitude and the sign of ΔS and ΔG values were very different from the experiment values. They argued that the entropy of complexation depends on both the insertion of the dye molecule and the simultaneous displacement of water molecules that are trapped within the CD cavity; if the water molecules are included in the calculations, the theoretical thermodynamic values become closer to the experimental results. Moreover, Xing et al. [Citation36] proposed a model to calculate ΔS of the inclusion complex in aqueous solution with the assumption that the effect of water molecules on the entropy changes of the 2-hydroxy-5-methoxyacetophenone–β-CD system is mainly determined by the water molecules in the β-CD cavity and the effect of the H2O molecules out of the cavity is less important and thus can be neglected.
The results are not readily understandable according to the driving forces listed below: van der Waals force, hydrophobic effect, dipole–dipole and hydrogen bonding interactions. Morokuma theory of energy decomposition analysis [Citation37] can offer a reasonable explanation. According to the theory, when a supramolecule is formed electrons will lose their identity as belonging to one or other component molecule. Four types of interactions should be considered in the formation of a supramolecule: (1) electrostatic interaction, which is favoured by large permanent charges and dipoles; (2) polarisation interaction, which is favoured by large volume and polarisability of the molecules; (3) exchange energy, or Pauli repulsion; and (4) charge transfer interaction, which is contributed by the mixing of the filled orbital of one component molecule with the vacant orbital of the other. The charge transfer interaction is always attractive, and the most important terms in this interaction are contributed by the charge transfer between the HOMO of one component and the LUMO of the other. These first three interactions constitute the canonical driving forces in CD chemistry, i.e., dipole–dipole interaction, dipole-induced dipole interaction and steric effect. However, they cannot explain the unexpected experimental observations. The higher the HOMO of the guest molecule, the stronger is the charge transfer interaction in the complexation. Herein, the quantum mechanical studies indicate that no charge transfer interactions are present in the four drugs with CD. Further, Mulliken charge values are zero confirmed no charge transfer interactions present in the DABA:CD inclusion complexes. Even though CD is ready to act as a Lewis acid (electron acceptor), the DABA compounds do not act as Lewis bases (electron donor). Thus, no charge transfer interactions are present between the HOMO of the drug compounds and the LUMO of CD.
3.7. SEM and TEM
The SEM images of DABA, α-CD, β-CD and inclusion complex nanomaterials are recorded and presented in . These pictures clearly elucidated the difference of DABA and inclusion complex. It is seen from the SEM figures that (1) α-CD is in prismatic form, (2) β-CD is in platted form,[Citation34] (3) DABA is in flakes form and (4) both inclusion complex plates differ in their size. Modification of these morphological structures can be assumed as a proof of the formation of new inclusion complex nanomaterials.
Figure 5. SEM images of (a) DABA, (b) α-CD, (c) β-CD, (d) DABA:α-CD and (e) DABA:β-CD inclusion complexes.
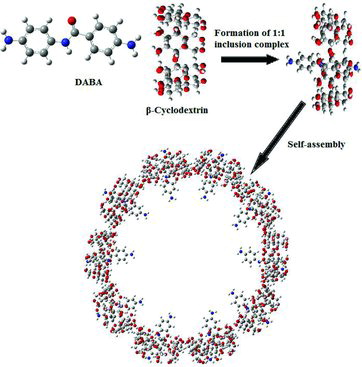
TEM was employed to investigate the morphology aggregates of the inclusion complex of CDs with DABA. The TEM images of DABA:α-CD nanomaterials are shown in (a) and (b). It could be found that nanochain-like agglomerated structures of the DABA:α-CD with a thickness of 25–100 nm, agglomerated from the replication of the cylindrical shape of polyrotaxane structure. In the DABA:β-CD inclusion complex, nanostructures with diameters of about 60–120 nm were observed. The vesicle particles showed strong interaction between the centre and border, which is a distinctive typical vesicular structure ((c) and (d)). The vesicles having visible contrast between the middle and outer parts of particles, with a characteristic TEM image of hollow sphere like a vesicle, have been reported for divergent kinds of hollow particles.[Citation38–42] For expediency, the general composition of the DABA:CD inclusion complex is represented by (DABA)m/(CD)n in which the guest–host ratio is m:n (1:1). The self-assembly of α-CD and β-CD with DABA is the key factor for the typical nanochain-like agglomerates and a hollow spherical structure, respectively () (i.e., nanovesicles). The nanochain agglomerate structures formed in the DABA:α-CD inclusion complexes are fixed in head–head or head–tail approach. But in DABA:β-CD supramolecular assembly nanovesicles, prearranged OH–H intermolecular hydrogen bond approach was present (). Nanochain-like agglomerates and nanovesicles may be related to the weaker supramolecular interaction, van der Waals force, hydrogen bond between neighbouring complex (DABA:α-CD, DABA:β-CD) and even the weaker assembly between the inclusion complexes of DABA with CDs.
Figure 6. TEM images of the nanostructure formed by (a, b) α-CD/DABA and (c, d) β-CD/DABA.
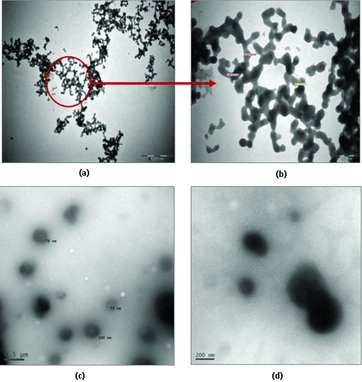
Figure 7. (Colour online) Graphical representation for a chain-like agglomerates formed by α-CD:DABA inclusion complex.
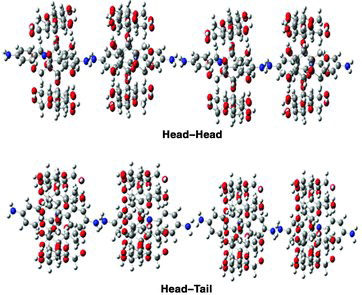
Figure 8. Proposed mechanisms of nanovesicle formation between DABA and β-CD.
3.8. FTIR spectral studies
FTIR spectra of DABA and the powder inclusion complex nanomaterials are shown in Figure S5. In pure DABA, the NH stretching appeared at 3399 cm−1 and it is moved in the α-CD and β-CD inclusion complexes to 3381 and 3378 cm−1, respectively. The C═O stretch of DABA at 1637 cm−1 is moved in the α-CD and β-CD inclusion complexes to 1624 and 1643 cm−1, respectively. The C–N stretching frequency of DABA at 1257 cm−1 is moved in the α-CD and β-CD inclusion complexes to 1280 and 1315 cm−1, respectively. The aromatic ring stretch at 1421 and 1514 cm−1 is not significantly changed in the complex. The C–NH2 stretching frequency appears at 1177 and 1130 cm−1 is moved in the α-CD inclusion complex to 1153 and 1079 cm−1, whereas in β-CD inclusion complex it is moved to 1154 and 1079 cm−1. The aromatic C═C stretch at 3210 cm−1 is lost in the complex. Moreover, the ratio between the frequency intensities is largely varied in the pure DABA and the inclusion complex. The above results confirmed that DABA formed inclusion complexes with both α-CD and β-CD.
3.9. Differential scanning calorimeter (DSC)
DSC curves of the pure DABA showed a single endothermic peak at 204.3 °C corresponding to the melting of DABA. The DSC curves appeared at 78.8, 108.5 and 135.4 °C for α-CD and 128.0 °C for β-CD.[Citation43,44] The DSC profiles of nanocarrier formulation of α-CD:DABA and β-CD:DABA (Figure S6) showed broad but low intensity peak at 68.9 and 84.7 °C, respectively, accompanied by endothermic peaks due to dehydration of water molecule which conformed the formation of the inclusion complex nanomaterials. The above results confirmed that the encapsulation process produces a marked decrease in crystalline nature of inclusion complex nanomaterials.
3.10. Powder X-ray diffraction studies
The powder X-ray patterns of the DABA, α-CD, β-CD and the inclusion complexes are shown in Figure S7. Characteristic high-intensity diffraction peaks were detected for DABA and the inclusion complex – 19.15°, 20.54°, 23.21° and 28.92° for DABA; 5.63°, 9.30°, 20.27°, 22.97°, 23.87° and 25.40° for DABA:α-CD and 5.82°, 11.96° and 18.44° for the DABA:β-CD inclusion complex. The inclusion complex has a different pattern in which it is no longer possible to distinguish the characteristic peaks of isolated host and guest, thus confirming the existence of inclusion complex dissimilar to hallow amorphous nature.
3.11. NMR spectra
In order to explore the possible inclusion mode of the DABA:CD complexes, we compared the 1H NMR spectra of DABA in the presence of host CDs (Figure S8). Consideration of the complex by 1H NMR clearly demonstrated the presence of the outline protons of the DABA molecule, consistent with the significant solubilisation. As illustrated in Figure S8, the majority of DABA protons displayed chemical shifts at 4.80–9.40 ppm, which are distinct from the CD protons (3.4–4.5 ppm). To further explore the inclusion mode, the chemical shifts of CD protons in the absence and presence of DABA are explained as follows:
DABA (α-CD:β-CD inclusion complexes) = H-a: 9.39 (9.33/9.42), H-b: 7.67 (7.59/7.61), H-c: 6.57 (6.56/6.56), H-d: 7.33 (7.29/7.36), H-e: 6.52 (6.50/6.47), H-f: 5.74 (5.71/5.65) and H-g: 4.84 (4.83/4.80).
As can be seen from the above values after inclusion complexation with DABA, a relatively weak effect was observed on the DABA protons. H-3 and H-5 protons are located in the interior of the CD cavities and it interacts with the DABA protons. In contrast, as compared with free DABA, the δ value of benzamido proton (H-a) shifts downfield up to 0.06 ppm in α-CD and 0.05 ppm upfield in β-CD complexes. The δ values of ‘A’ ring protons (H-b and H-c) shifted upfield up to 0.01 ppm and the ‘B’ ring protons (H-d and H-e) shifted downfield up to 0.03 and 0.05 ppm, respectively. The chemical shift values of amino protons H-f and H-g are shifted upfield in the inclusion complex: α-CD/β-CD ∼ 0.03/0.09 ppm for H-f protons and ∼0.01/0.04 ppm for H-g protons, respectively, as compared with the corresponding free DABA molecule. These shifts indicated that the aromatic DABA molecule entered into the CD cavities and confirm the formation of inclusion complexes.
4. Conclusion
The TEM exploration of the DABA:α-CD inclusion complex nanomaterials visualised nanochain-like agglomerates with thickness of 25–100 nm and DABA:β-CD inclusion complex nanomaterials showed spherical nanovesicular structure with a diameter of 60–120 nm. The most dominant driving force for the construction of this supramolecular structure is intermolecular hydrogen bonding and van der Waals forces. The model proposed head–head and head–tail structures of DABA:α-CD and the secondary self-assembly made the vesicular structure of DABA:β-CD. DABA:α-CD and DABA:β-CD nanomaterials have different physicochemical characteristics from isolated DABA. In both CDs, DABA forms different types of 1:1 inclusion complex nanomaterials. Theoretical studies suggest that hydrophobic interaction plays an important role in determining the stability of the inclusion complexes.
Supplemental data
Supplemental data for this article can be accessed here.
Supplementary Materials
Download MS Word (414 KB)Acknowledgements
This work is supported by the CSIR (No. 01(2549)/12/EMR-II) and UGC (F.No. 41-351/2012 (SR)). One of the authors R.K. Sankaranarayanan is thankful to CSIR, New Delhi for the award of Senior Research fellowship. The authors acknowledge UGC Networking Resource Centre School of Chemistry and Centre for Nanotechnology, University of Hyderabad for providing equipment facilities for characterisation. We gratefully acknowledge Prof. M.V. Rajasekharan, Dean, School of Chemistry, University of Hyderabad for his kind help. We thank Dr P. Ramamurthy, Director, National Centre for Ultrafast Processes, University of Madras for allowing the fluorescence lifetime measurements for this work.
References
- Szejtli J. Introduction and general overview of cyclodextrin chemistry. Chem Rev. 1998;98:1743–1754.
- Misiuk W, Zalewska M. Investigation of inclusion complex of trazdone hydrochloride with hydroxypropyl-β-cyclodextrin. Carbohydr Polymers. 2009;77:482–488.
- Connors KA. The stability of cyclodextrin complexes in solution. Chem Rev. 1997;97:1325–1358.
- Zhao YL, Stoddart JF. Azobenzene-based light-responsive hydrogel system. Langmuir. 2009;25:8442–8446.
- Tu CW, Kuo SW, Chang FC. Supramolecular self-assembly through inclusion complex formation between poly(ethylene oxide-b-n-isopropylacrylamide) block copolymer and alpha cyclodextrins. Polymer. 2009;50:2958–2966.
- Choi S, Munteanu M, Ritter HJ. Monoacrylated cyclodextrin via ‘click’ reaction and copolymerization with n-isopropylacrylamide: guest controlled solution properties. J Polymer Res. 2009;16:389–394.
- Wenz G, Han B-H, Muller A. Cyclodextrin rotaxanes and polyrotaxanes. Chem Rev. 2006;106:782–817.
- Osaki M, Takashima Y, Yamaguchi H, Harada A. Nanospheres with polymerization ability coated by polyrotaxane. J Org Chem. 2009;74:1858–1863.
- Discher DE, Eisenberg A. Polymer vesicles. Science. 2002;297:967–973.
- Voskuhl J, Ravoo BJ. Molecular recognition of bilayer vesicles. Chem Soc Rev. 2009;38:495–505.
- Bugler J, Sommerdijk NAJM, Visser AJWG, van Hoek A, Nolte RJM, Engbersen JFJ, Reinhoudt DN. Interconnective host–guest complexation of β-cyclodextrin–calix[4]arene couples. J Am Chem Soc. 1998;121:28–33.
- Ravoo BJ, Darcy R. Cyclodextrin bilayer vesicles. Angew Chem. 2000;112:4494–4496.
- Ravoo BJ, Darcy R, Mazzaglia A, Nolan D, Gaffney K. Supramolecular tapes formed by a catanionic cyclodextrin in water. Chem Commun. 2001;9:827–828.
- Sun L, Zhang H, Hao WAA, Hao J. Vesicles were prepared by β-cyclodextrins inclusion complexes based on switching supramolecular interaction models induced by mixed solvents. J Inclusion Phenomena Macrocyclic Chem. 2010;68:277–285.
- Felici M, Marza-Perez M, Hatzakis NS, Nolte RJM, Feiters MC. Beta-cyclodextrin-appended giant amphiphile: aggregation to vesicle polymersomes and immobilisation of enzymes. Chem Eur J. 2008;14:9914–9920.
- Jing B, Chen X, Wang XD, Yang CJ, Xie YZ, Qiu HY. Self-assembly vesicles made from a cyclodextrin supramolecular complex. Chem Eur J. 2007;13:9137–9142.
- Duchene D, Ponchel G, Wouassindjewe D. Cyclodextrins targeting. Application of nanoparticles. Adv Drug Deliv Rev. 1999;36:29–40.
- Silvera A, Ponchel G, Puisieux F, Duchene D. Combined poly(isobutylcyanoacrylate) and cyclodextrins nanoparticles for enhancing the encapsulation of lipophilic drugs. Pharm Res. 1998;15:1051–1055.
- Cavalli R, Trotta F, Tumiatti W. Cyclodextrin-based nanosponges for drug delivery. J Inclusion Phenomena Macrocyclic Chem. 2006;56:209–213.
- Memisoglu-Bilensoy E, Vural I, Bochot A, Renoir JM, Duchene D, Huncal A. Tamoxifen citrate loaded amphiphilic β-cyclodextrin nanoparticles: in vitro characterization and cytotoxicity. J Controlled Release. 2005;104:489–496.
- Karelson M, Lobanov VS, Katrizky R. Quantum-chemical descriptors in QSAR/QSPR studies. Chem Rev. 1996;96:1027–1044.
- Sandra S, Dogra SK. Spectral characteristics of 2-(2′-aminophenyl) benzimidazole in β-cyclodextrin. J Photochem Photobiol A. 1996;101:221–227.
- Krishnamoorthy G, Dogra SK. Dual fluorescence of 2-(4′-N,N-dimethylaminophenyl) benzimidazole: effect of β-cyclodextrin and pH. J Photochem Photobiol A. 1999;123:109–119.
- Kim TH, Cho DW, Yoon M, Kim D. Effects on twisted intramolecular charge transfer of p-(N,N-diethylamino) benzoic acid in aqueous cyclodextrin solutions. J Phys Chem. 1996;1601:5670–15676.
- Das S. Inclusion complexation of 2-(40-N; N-dimethylaminophenyl)-1H-naphth[2,3-d]imidazole by β-cyclodextrin: effect on the twisted intramolecular charge transfer emission. Chem Phys Lett. 2002;361:21–28.
- Cho DW, Kim TH, Yoon M, Kim D. Cyclodextrin effects on intramolecular charge transfer of 2-biphenylcarboxylic acid: a pre-twisted molecule. J Chem Soc Faraday Trans. 1996;92:29–33.
- Benesi HA, Hildebrand JH. Spectrophotometric investigation of the interaction of iodine with aromatic hydrocarbons. J Am Chem Soc. 1949;71:2703–2707.
- Antony Muthu Prabhu A, Sankaranarayanan RK, Siva S, Rajendiran N. Unusual spectral shifts on fast violet-B and benzanilide: effect of solvents, pH and β-cyclodextrin. Spectrochim Acta Part A. 2009;74:484–497.
- Antony Muthu Prabhu A, Sankaranarayanan RK, Venkatesh G, Rajendiran N. Dual fluorescence of fast blue RR and fast violet B: effect of solvents, α- and β-cyclodextrins. J Phys Chem B. 2012;116:9061–9074.
- Antony Muthu Prabhu A, Venkatesh G, Rajendiran N. Spectral characteristics of sulfa drugs: effect of solvents, pH and β-cyclodextrin. J Solution Chem. 2010;39:1061–1086.
- Sivasankar T, Antony Muthu Prabhu A, Karthick M, Rajendiran N. Encapsulation of vanillylamine by native and modified cyclodextrins: spectral and computational studies. J Mol Struct. 2012;1028:57–67.
- Venkatesh G, Sivasankar T, Karthick M, Rajendiran N. Inclusion complexes of sulphanilamide drugs and β-cyclodextrin: a theoretical approach. J Inclusion Phenomena Macrocyclic Chem. 2013;77:309–318.
- Jude Jenita M, Antony Muthu Prabhu A, Rajendiran N. Theoretical study of inclusion complexation of tricylic antidepressant drugs with β-cyclodextrin. Indian J Chem Section A. 2012;51:1686–1694.
- Rajendiran N, Balasubramanian T. Dual fluorescence of syringaldazine. Spectrochim Acta Part A. 2007;68:894–904.
- Hamdi H, Abderrahim R, Meganem F. Spectroscopic studies of inclusion complex of β-cyclodextrin and benzidine diammonium dipicrate. Spectrochim Acta Part A. 2010;75A:32–36.
- Xing SK, Zhang C, Ai HQ, Zhao Q, Zhang Q, Sun DZ. Theoretical study of the interactions of β-cyclodextrin with 2′-hydroxyl-5′-methoxyacetophone and two of its isomers. J Mol Liquids. 2009;146:15–22.
- Morokuma K. Why do molecules interact? The origin of electron donor–acceptor complexes, hydrogen bonding and proton affinity. Acc Chem Res. 1977;10:294–300.
- Kuang M, Duan HW, Wang J, Chen DY, Jiang M. A novel approach to polymeric hollow nanospheres with stabilized structure. Chem Commun. 2003;4:496–497.
- Kuang M, Duan HW, Wang J, Jiang M. Structural factors of rigid-coil polymer pairs influencing their self-assembly in common solvent. J Phys Chem B. 2004;108:16023–16029.
- Duan HW, Kuang M, Wang J, Chen DY, Jiang M. Self-assembly of rigid and coil polymers into hollow spheres in their common solvent. J Phys Chem B. 2004;108:550–555.
- Chen DY, Jiang M. Strategies for constructing polymeric micelles and hollow spheres in solution via specific intermolecular interactions. Acc Chem Res. 2005;38:494–502.
- Sun T, Zhang H, Kong L, Qiao H, Li Y, Xin F, Hao A. Controlled transformation of from nanorods to vesicles induced by cyclomaltoheptoses (β-cyclodextrin). Carbohydr Res. 2011;346:285–293.
- Putcharin C, Suganya S, Piamsook P. Preparation and characterization of inclusion complexes containing fixolide, a synthetic musk fragrance and cyclodextrins. J Inclusion Phenomena Macrocyclic Chem. 2007;57:69–73.
- Giampiero B, Milena S, Alessandra N, Massimo S, Paola M, Fabrizio M. Interaction of naproxen with alpha-cyclodextrin and its noncyclic analog maltohexaose. Pharm Res. 1999;16:689–694.