
Abstract
A series of nanoceria samples doped with zirconium (nil to 2 mol%) and a typical sample doped with 1 mol% each of Zr and Eu were synthesised following co-precipitation-hydrothermal treatment route. The main peaks in X-ray diffraction (XRD) patterns of all the samples corresponded to (111), (200), (220) and (311) planes of cubic ceria. The Fourier transform infrared spectra showed bands which were indicative of formation of nanoceria with intercalated/adsorbed water. In Raman spectra, a sharp and intense Raman shift at around 460–462 cm−1 was observed for all the samples and the peak intensity decreased with increase in mol% doping of Zr. In case of Zr–Eu-doped sample the peak intensity was similar to the undoped ceria. The decrease in intensity could be due to accumulation/precipitation of more numbers of Zr ions on the surface rather than incorporation into ceria lattice. The indirect band gaps estimated from ultraviolet–visible absorption spectra were smaller when compared to the direct ones. The smaller indirect band gaps indicate that Zr-doped nanoparticles with a higher fraction of atoms residing at the surface were available to assist the indirect electron transition from the valence band to the conduction band. Emission spectra obtained by exciting at 300 and 500 nm for all samples are discussed in details. Transmission electron microscope image of a typical sample showed mono-dispersed uniform sized single crystalline doped ceria.
1. Introduction
The partial substitution of Ce4+ with Zr4+ in the lattice of CeO2 results in a solid solution formation leading to improvements in its thermal resistance, oxygen storage capacity, redox properties, and to a better catalytic activity at lower temperature.[Citation1] Thus, zirconium improves the reducibility of cerium by enhancing the mobility of oxygen through the CeO2 lattice.[Citation2] The increase in thermal stability of CeO2 improves the metal–CeO2 interaction. In recent years Zr-doped ceria are among the most widely studied and applied promoters in heterogeneous catalytic reactions, mainly due to their important role in the three-way catalysts for the treatment of automobile exhaust gas.[Citation3,4] The catalytic application of ceria–zirconia mixed oxides includes improved complete oxidation of methane and carbon monoxide,[Citation5] combustion of chlorinated organic pollutants [Citation6] and combustion of 1,2-dichloroethane. Both acidic properties and oxygen mobility are responsible for controlling the catalytic activity of the ceria–zirconia mixed oxides.[Citation1] Zr-doped ceria solid solutions can also be used to enlarge the operating air-to-fuel window of a three-way catalyst,[Citation7] to stabilise noble metal dispersion,[Citation8] and to promote the water gas shift and reforming reactions.[Citation9] The doped nanoceria is also a promising catalyst support for the production and purification of hydrogen.[Citation10–12] In case of sensor application, resistivity of thick film of ceria is high which creates problem. By doping with Zr, the resistivity becomes low.[Citation13] The resistive sensors using CeO2–ZrO2 thick film and their sensor properties were investigated by Izu et al.[Citation14] It was reported that the thick film with 0.5–40 mol% ZrO2 had a shorter response time, a lower resistivity and a better oxygen partial pressure dependence of resistivity compared to the ceria thick film without ZrO2.[Citation15] Rajabbeigi et al. and Elyassi et al. proposed ceria–zirconia and ceria–yttrium solid-state references.[Citation16,17] Rajabbeigi et al. also studied the oxygen sensing capability of CeO2–ZrO2–TiO2.[Citation18] As mentioned above various applications of Zr-doped ceria which include promoters for catalytic reactions, resistive sensors, enhancement of thermal stability, etc. have been examined. However, the optical properties have not drawn much attention. The objective of this investigation is to study the effect of Zr doping in nanostructured ceria on optical and electronic properties. In the present study Zr-doped ceria samples were synthesised with low mol% Zr as more than 2% doping results in heterogeneous distribution of zirconium. One sample containing both Zr as well as Eu as the dopants was also prepared to study the combined effect of doping trivalent and tetravalent ions in ceria matrix on structural and optical properties.
2. Experimental procedures
2.1. Sample preparation
Ceric sulphate tetra hydrate, Ce(SO4)2·4H2O (CDH), zirconium oxy-chloride, ZrOCl2·8H2O (Merck), acetone (s.d. fine-chem, India), europium acetate (Merck) and ammonia (s.d. fine-chem, India) were used without any further purification. The stock solutions were prepared by dissolving salts in double distilled water. The precipitation reaction was carried out at room temperature taking 0.05 M both of (200 − 2x) mL Ce salt solution and 2x mL Zr salt solution (x is the mol% of Zr doping in ceria) in a 1 L beaker. 1 M ammonia was slowly added under constant stirring till a pH of 9.0 was achieved. The precipitated contents were stirred for another 30 min. The yellow precipitate thus formed was filtered and washed thoroughly many times with double distilled water till complete removal of excess alkali and sulphate ions and was further washed with acetone. Removal of alkali was confirmed by washing the precipitate till the wash liquor pH was 7.0. The removal of sulphate was qualitatively tested by adding saturated barium chloride solution to a portion of wash liquor. Absence of any white precipitate of barium sulphate ensured absence of sulphate. The washed wet precipitate was transferred to a 2 L autoclave with 500 mL of distilled water. The slurry containing ceria precursor was hydrothermally treated at 200 °C for 3 h. In an earlier study the conditions for obtaining undoped nanoceria were established.[Citation19] Accordingly the hydrothermal treatment temperature and time were chosen. The autoclave was allowed to cool naturally and the precipitate so obtained was filtered, washed and dried at 110 °C for 24 h. x was varied from 0 to 2. A typical sample was prepared containing 1 mol% each of Zr and Eu by addition of predetermined quantities of Zr and Eu stock solutions.
2.2. Instrumental techniques
The X-ray diffraction (XRD) patterns of various samples were taken using a Phillips Powder Diffractometer (model PW 1710, The Netherlands) fitted with a CuKα target of wavelength 1.54 Å and a Ni filter. The FTIR (Fourier transform infrared) spectra of the samples were taken using Varian FTIR spectrophotometer (model FTS-800) in the range of 400–4000 cm−1. For FTIR spectra, weighed amount of each sample was mixed thoroughly with spectroscopic grade KBr (E-Merck India Ltd) by using a pestle and mortar. These mixed powders were then made into transparent pellets with a 10 mm SS die inside a pelletiser. The pellets were placed on the pellet holder and the spectra were recorded in transmittance mode. The Raman spectra were taken using a Renishaw (Renishaw plc, Gloucestershire, UK) in via micro Raman spectrometer equipped with 514 nm green laser having 1 cm−1 spectral resolution of Raman shift, X–Y step resolution of 0.1 μm and confocal resolution of 2.5 μm. The microstructure of a typical Zr-doped ceria sample was studied with transmission electron microscope (TEM make Philips model CM200 operating at 20–200 kV). Optical properties were studied using ultraviolet–visible (UV–vis) spectrophotometer (Shimadzu, model 2101) and photoluminescence (PL) spectra were recorded with fluorometer (Fluoro-max 4P) by dispersing ceria samples in methanol as solvent with concentration 1.0 × 10⁻³ M.
2.3. Sample coding
For convenience the synthesised samples have been coded as given below:
3. Results and discussion
3.1. XRD studies
All the synthesised samples were characterised using XRD for structural and crystallite size analysis. The diffraction patterns are shown in .
Figure 1. XRD patterns of pure and Zr/Zr–Eu-doped ceria samples.
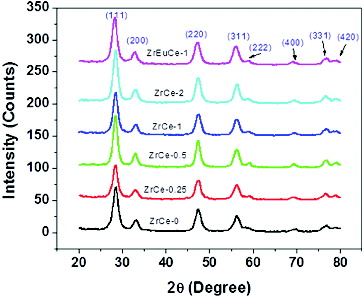
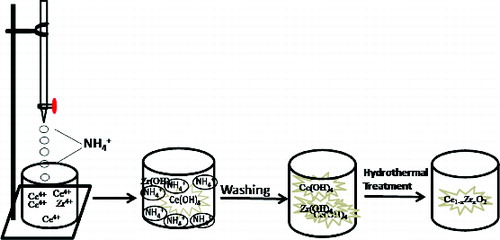
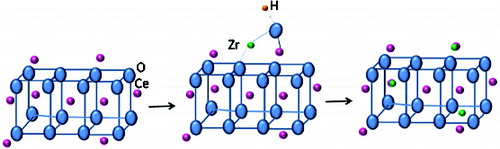
The diffraction peaks in all the XRD patterns corresponded to (111), (200), (220), (311), (220), (400), (331) and (420) planes of cubic fluorite structure of CeO2 (JCPDS no. 34-0394) with space group Fm3m, having cerium in the 4+ oxidation state. No zirconia (ZrO2)/zirconium hydroxide peaks were observed in any of the Zr-doped samples. In literature formation of such compounds has been reported.[Citation20] The XRD patterns show that with the increase in Zr mol%, the peak positions slightly shifted to higher 2θ values. In case of Zr–Eu-doped sample also similar small shift towards higher 2θ value was observed. Devaiah et al. have reported that by doping ceria with cations having smaller ionic radii (Ce(IV) 0.097 nm, Zr(IV) 0.084 nm), the peaks shift towards higher 2θ values.[Citation21] In the present samples the shift was only marginal which may be due to only part of Zr getting incorporated in the ceria matrix and part accumulating on the surface. It may be mentioned here that doping of Eu(III) with ionic radii of 0.1066 nm should have shown shift of 2θ values to lower side [Citation22] but due to the synergistic effect of Eu and Zr, the shift towards higher 2θ has been observed. shows that the crystallite size marginally increased from 8.2 to 8.8 nm and the lattice parameters decreased from 5.4315 to 5.4213 Å with the increase of Zr concentration from 0.25 to 2 mol%. Such an effect for doping of cations with smaller ionic radii in ceria was observed by Devaiah et al.[Citation21] The formation of Zr-doped ceria can be represented as shown in .
Table 1. Parameters calculated from XRD data.
Figure 2. Formation of Zr-doped ceria by precipitation-hydrothermal treatment route.
3.2. FTIR spectra
The FTIR spectra of both Zr- and Zr–Eu-doped ceria samples are shown in . Four bands were observed for all the doped samples. The IR bands observed at around 414–430 cm−1 (418, 422, 424, 418, 414 and 430 cm−1 for samples ZrCe-0, ZrCe-0.25, ZrCe-0.5, ZrCe-1, ZrCe-2 and ZrEuCe-1, respectively) corresponded to the Ce–O stretching vibrations of ceria.[Citation23] The other IR bands at 1110 cm−1 for ZrCe-0 and at 1112 cm−1 for the rest of the doped samples could be attributed to the formation of nanocrystalline ceria.[Citation24] The IR bands at 1624–1629 cm−1 (1629 cm−1 for ZrCe-0, 1624 cm−1 for ZrCe-0.25 and ZrEuCe-1 and 1625 cm−1 for the rest of the samples (ZrCe-0.5, ZrCe-1 and ZrCe-2) could be assigned to –HOH bending and –OOH stretching vibrations due to adsorbed water on ceria surface.[Citation25,26] The broad absorption bands observed in the range of 3388–3406 cm−1 (3406, 3388, 3392, 3400, 3406 and 3406 cm−1 for the samples ZrCe-0, ZrCe-0.25, ZrCe-0.5, ZrCe-1, ZrCe-2 and ZrEuCe-1, respectively) corresponded to –OH stretching vibration of adsorbed/crystallised water.[Citation25,Citation27]
Figure 3. FTIR spectra of pure and Zr/Zr–Eu-doped ceria samples.
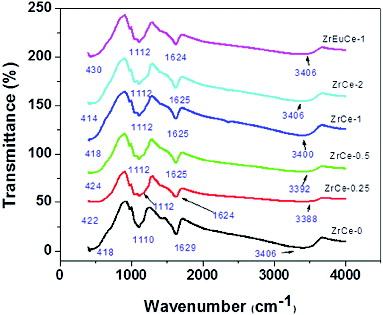
There was not much variation in the shape and intensities of the band for the Zr/Zr–Eu-doped samples when compared to pure ceria. In all the samples the band positions for a particular absorption band/group are very close to each other except for the one corresponding to the crystallised/adsorbed water band at 3406 cm−1. The position of this band (3388 cm−1) for 0.25 mol% Zr was more shifted towards lower energy and it approached towards pure ceria (3406 cm−1) with increasing Zr mol% to 2 (3406 cm−1). This trend might be due to the fact that more numbers of adsorbed/crystalline water were loosely bound on the ceria surface at lower Zr ion concentrations.
3.3. Raman spectra
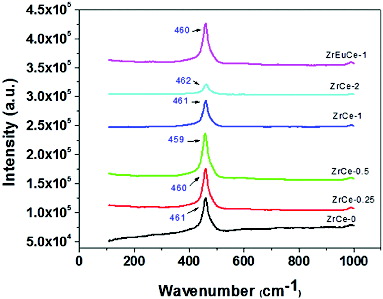
shows the Raman shift of pure and various doped ceria samples. A sharp and intense Raman shift at 459–462 cm−1 was observed for all the samples. This shift is assigned for triply degenerate F2g symmetry of ceria and can be viewed as a symmetric breathing mode of the O atoms around each cation which are sensitive to any disorder in the oxygen sublattice resulting from nonstoichiometry or oxygen defects.[Citation28] Since only the O atoms move, the vibrational mode is nearly independent of the cation mass.[Citation28,29] There is not much difference in the peak position of the active Raman mode but a difference in peak intensities with the variation in concentration of Zr in doped ceria samples is striking. The peak intensity increases up to 0.5 mol% Zr and with further increase in Zr concentration, a steep drop in peak intensity is observed. It has been reported that the peak area increases up to a certain % metal ion doping and then decreases.[Citation2] The reason being accumulation/precipitation of more numbers of metal ions on the surface rather than incorporation into ceria lattice. In case of the sample ZrCe-2, a very small broad peak is seen at 462 cm−1. From the XRD results, it was observed that the shift to higher 2θ values on doping was not proportional to the % mol Zr in the doped sample, thereby indicating part of Zr accumulating on the surface rather than getting incorporated into the matrix. The Raman spectra corroborate this observation. A very sharp Raman peak observed at 460 cm−1 for the sample ZrEuCe-1 shows that there is synergism on doping of ceria with equimolar concentrations of tetravalent (Zr) and trivalent ions (Eu). Eu doping along with Zr annulled the effect of Zr and the peak intensity became closer to undoped ceria which is an interesting observation.
Figure 4. Raman spectra of pure and Zr/Zr–Eu-doped ceria samples.
3.4. UV–visible absorption studies
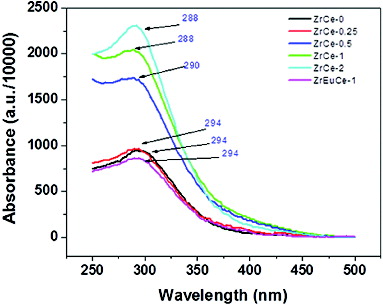
shows the UV–vis absorption spectra of pure and doped ceria nanoparticles. A broad absorption peak was observed at a wavelength of 294 nm for pure ceria. The absorption below visible region is because of the charge-transfer transition from O2− (2p) to Ce4+ (4f) orbital in CeO2. The UV–vis absorption peaks for Zr-doped ceria were observed at 294, 290, 288 and 288 nm for 0.25, 0.5, 1 and 2 mol% Zr doping, respectively. There is a slight blue shift in the peak position with Zr doping ≥ 0.5 mol. With the increase in mol% Zr in ceria, the intensity of the peak increases. Ungureanu et al. [Citation30] observed increase in peak intensity by doping Mn into SnO2 nanoparticles and attributed it to incorporation of Mn into the tin dioxide lattice. The increase of absorption in the UV region indicates that the substitution of Ce4+ with metal ions has increased the oxygen vacancy in doped samples.[Citation31,32] It has been reported that doping of cerium ion with 1% Mg in silica matrix resulted in an increase in absorption intensity.[Citation33] In case of doping CeO2 with both Zr and Eu the absorption intensity becomes weaker and it nearly becomes identical to that of pure ceria. Similar phenomena were reported for doping of CeO2 with Pr or Tb.[Citation32] The spectrum of ZrEuCe-1 sample was observed to be nearly identical to that of pure ceria thereby again pointing towards annulling the effect of simultaneous doping of equimolar concentrations of a trivalent and a tetravalent ion as observed for Raman spectrum of this sample.
Figure 5. UV–vis absorption spectra of pure and Zr/Zr–Eu-doped ceria samples.
3.4.1. Direct band gap
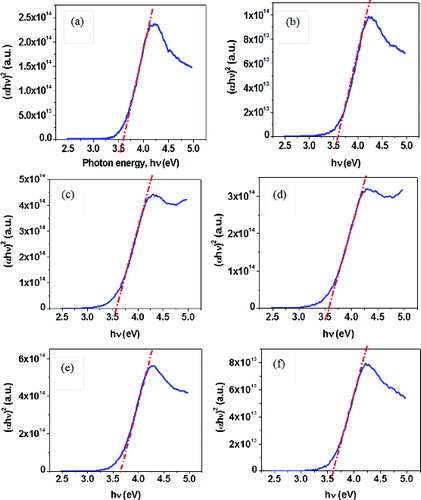
The optical band gaps (Eg) of CeO2 nanocrystals can be estimated by using the following equation:(1) where α is the absorption coefficient, hν is photon energy, C is the constant, n = 1/2 for a directly allowed transition and n = 2 for an indirectly allowed transition.[Citation34]
The optical absorption coefficient α was calculated according to the equation(2) where A is the absorbance of a sample, ρ is the real density of CeO2 (7.28 g cm−3), l is the path length (1 cm) and c is the concentration of the ceria suspensions (1.0 × 10⁻³ M).[Citation35]
For direct transitions, the plots of (αhν)2 versus photon energy hν for CeO2 nanocrystals are shown in . The direct Eg for pure ceria (3.6 eV) was blue-shifted as compared to that of bulk CeO2 (3.15 eV). This is due to the quantum confinement effect for nanosized ceria.[Citation36] The direct band gap energies for Zr-doped (ZrCe-0.25: 3.6 eV, ZrCe-0.5: 3.6 eV, ZrCe-1: 3.6 eV and ZrCe-2: 3.7 eV) and Zr–Eu-doped (ZrEuCe-1: 3.6 eV) ceria samples were close to pure ceria nanoparticles synthesised under similar conditions.
Figure 6. Direct band gaps of Zr/Zr–Eu-doped ceria samples (a) ZrCe-0, (b) ZrCe-0.25, (c) ZrCe-0.5, (d) ZrCe-1, (e) ZrCe-2 and (f) ZrEuCe-1.
3.4.2. Indirect band gap
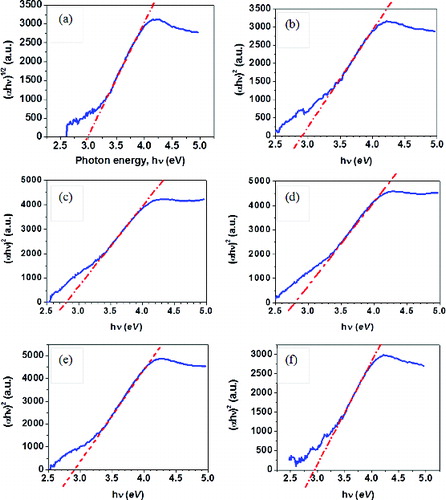
The indirect band gap transitions were estimated from the plots of (αhν)1/2 versus hν and are shown in . The values of direct and indirect band gaps are compared in . It is observed that in all the samples the numerical values of direct band gap are more than those of indirect ones. Such trend has been reported by Zhang et al.[Citation37] If the indirect band gap results primarily from the surface atoms, the smaller indirect band gap would indicate that Zr-doped nanoparticles (with a higher fraction of atoms residing at the surface, providing enough phonons and lattice vibrations) are available to assist the indirect electron transition from the valence band to the conduction band.
Table 2. Direct and indirect band gaps for Zr/Zr–Eu-doped ceria samples.
Figure 7. Indirect band gaps of pure and Zr/Zr–Eu-doped ceria samples (a) ZrCe-0, (b) ZrCe-0.25, (c) ZrCe-0.5, (d) ZrCe-1 samples, (e) ZrCe-2 and (f) ZrEuCe-1.
3.5. Photoluminescence (PL) studies
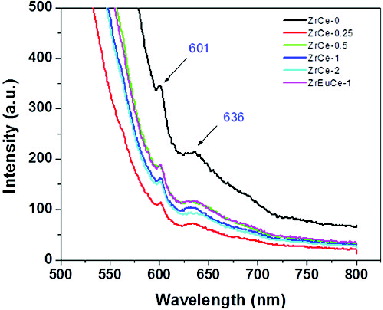
The emission peaks for nanostructured ceria have been observed in the range of 355–415 nm.[Citation38–41] Morshed et al. [Citation41] observed a wide PL emission band from 325 to 550 nm in CeO2 nanoparticles. The emission peaks have been attributed to (1) oxygen deficient ceria Ce6O11, (2) charge transitions from the 4f band to the valence band of the CeO2, (3) surface defects, (4) defects in energy levels between Ce4+ (4f) and O2− (2p) level resulting in hopping of electrons. shows the room temperature PL spectra of doped CeO2 nanopowders by exciting the samples at 270 nm. The emission peaks were observed at 411 and 472 nm for pure and all the Zr/Zr–Eu-doped samples. No significant change in peak positions was observed though the intensity of the peaks had decreased and the peak at 411 nm had become broad after Zr doping. Souza et al. observed broad emission bands in the 400–500 nm range with very low intensity and had suggested efficient energy transfer from the O → Ce4+ (ligand-to-metal charge-transfer, LMCT) transitions to the emitter level of Sm3+ ion in Sm-doped ceria.[Citation42] A significant enhancement in the emission band is observed in the spectrum of pure nanostructured CeO2 when compared to the Zr-doped CeO2 which could be due to the fact that the d electrons of cerium couple differently to the lattice phonon in the cubic fluorite structure.[Citation43] Similar behaviour has been reported for ceria synthesised by sol gel route. Surface accumulation/incorporation of doped Zr/Zr–Eu may result in defects which are responsible for quenching of PL spectra. shows the emission spectra with excitation at 500 nm in pure and Zr/Zr–Eu-doped samples. All the samples showed only two small peaks at 601 and 636 nm. It is difficult to assign these two small peaks to any transitions of Ce4+ ions. No difference in the spectra was observed due to doping of Zr/Zr–Eu. It may be mentioned here that when only Eu3+ ions were doped in ceria the PL spectra obtained by excitation at 500 nm showed five peaks at 583, 596, 617, 678 and 753 nm corresponding to 5D0 to 7Fj (j = 0–4) transitions of Eu3+ ions. Doping of ceria with Eu along with Zr resulted in restriction of various transitions of Eu3+ ions [Citation22] as the spectra exhibited only two peaks similar to the pure nanoceria.
Figure 8. Emission spectra of pure and Zr/Zr–Eu-doped ceria samples excited at 270 nm.
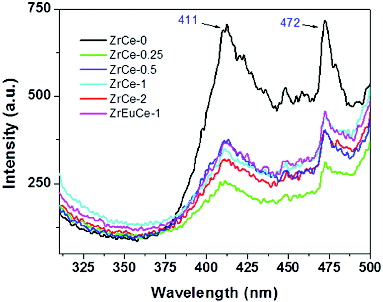
Figure 9. Emission spectra of pure and Zr/Zr–Eu-doped ceria samples excited at 500 nm.
3.6. TEM studies
The particle morphology obtained from typical TEM image of 2 mol% Zr-doped ceria is shown in (a). The particles are observed to be mono-dispersed, uniform and single crystalline. Each crystal is distinctly separated from the other and no agglomerates are visible. The size of the individual crystals is of around 7–9 nm. This size is in consistence with the result of XRD crystallite size which was estimated to be 8.8 nm. The selected area electron diffraction (SAED) pattern is shown in (b). The results are consistent with a cubic structure of ceria crystal with strong ring patterns corresponding to (111), (200), (220), (311), (222) and (400) planes. These observations are in good agreement with the XRD results.[Citation44] Schematic presentation of mode of incorporation of Zr in ceria lattice is shown in .
Figure 10. (a) TEM micrograph of ZrCe-2 sample and (b) the corresponding SAED pattern.
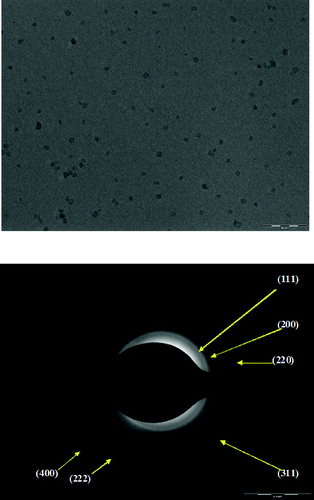
Figure 11. Schematic presentation of mode of incorporation of Zr in ceria lattice.
4. Conclusions
A total number of six samples of nanoceria containing 0, 0.25, 0.5, 1 and 2 mol% Zr and 1 mol% each of Zr and Eu were synthesised following a co-precipitation-hydrothermal technique. From XRD studies small shifts in 2θ values to the higher side were observed due to the difference in ionic radii of Ce4+ and Zr4+. The cubic fluorite crystal structure of ceria is retained after Zr/Zr–Eu doping. There was not much variation in the shape and intensities of the bands in FTIR spectra for the Zr/Zr–Eu-doped samples when compared to pure ceria. The Raman spectra of samples showed a sharp and intense Raman shift at around 459–462 cm−1 except for the ones with Zr doping ≥1 mol%. Samples with ≥1 Zr mol% doping exhibited very low peak intensity which is attributed to surface accumulation of Zr. Broad absorption peaks were observed in the UV–vis spectra of doped samples which were close to the value of pure ceria. Increase in absorption intensity was observed for the Zr-doped samples. The values of direct band gaps varied in the range of 3.55–3.7 eV. These results point towards the fact that no change in conduction behaviour takes place due to Zr/Zr–Eu doping. The numerical values of the indirect band gaps were lower (2.8–2.95 eV) when compared to the direct ones. The emission peaks for the spectra obtained by exciting at 270 nm were observed at 411 and 472 nm for pure and all five doped samples. Surface accumulation/incorporation of doped Zr/Zr–Eu resulted in defects which were responsible for quenching of PL spectra. The spectra obtained by exciting at 500 nm showed two small peaks in the orange-red region, i.e. at 601 and 636 nm for pure and Zr/Zr–Eu-doped ceria samples. The appearance of such peaks has not been reported earlier. It is difficult to assign these peaks to any transitions. TEM studies of one typical sample with 2 mol% Zr-doped ceria showed mono-disperse, uniform and single crystalline cubic ceria with individual particle size of 7–9 nm.
Acknowledgements
The authors are grateful to Prof. B.K. Mishra, Director, Institute of Minerals and Materials Technology (IMMT), Bhubaneswar, for his kind permission to publish this paper. The authors also thank Dr I.N. Bhattacharya, Head of Department of Hydro-Electrometallurgy Department, IMMT. One of the authors S.K. Sahoo is thankful to the Council of Scientific and Industrial Research for providing him with Junior Research Fellowship during these investigations.
References
- Ortiz JIG, de-Rivas B, Fonseca RL, Velasco JRG. Combustion of aliphatic C2 chlorohydrocarbons over ceria-zirconia mixed oxides catalysts. Appl Catal A. 2004;269:147–155.
- Serrano-Ruiz JC, Luettich J, Sepulveda-Escribano A, Rodríguez-Reinoso F. Effect of the support composition on the vapor-phase hydrogenation of crotonaldehyde over Pt/CexZr1−xO2 catalysts. J Catal. 2006;241:45–55.
- Hori CE, Permana H, Simon Ng KY, Brenner A, More K, Rahmoeller K, Belton D. Thermal stability of oxygen storage properties in a mixed CeO2-ZrO2 system. Appl Catal B. 1998;16:105–117.
- Hori CE, Brenner A, Simon Ng KY, Rahmoeller K, Belton D. Studies of the oxygen release reaction in the platinum-ceria-zirconia system. Catal Today. 1999;50:299–308.
- Pengpanich S, Meeyoo V, Rirksomboon T, Bunyakiat K. Catalytic oxidation of methane over CeO2-ZrO2 mixed oxide solid solution catalysts prepared via urea hydrolysis. Appl Catal A. 2002;234:221–233.
- Kantzer E, Döbber D, Kieling D, Wendt G. MnOx/CeO2-ZrO2 and MnOx/WO3-TiO2 catalysts for the total oxidation of methane and chlorinated hydrocarbon. Stud Surf Sci Catal. 2002;143:489–497.
- Kaspar J, Fornasiero P, Hickey N. Automotive catalytic converters: current status and some perspectives. Catal Today. 2003;77:419–449.
- Vlaic G, Fornasiero P, Martra G, Fonda E, Kaspar J, Marchese L, Tomat E, Coluccia S, Graziani M. Morphology of rhodium particles in ex-chloride Rh/Ce0.5Zr0.5O2 catalyst. J Catal. 2000;190:182–190.
- Noronha FB, Fendley EC, Soares RR, Alvarez WE, Resasco DE. Correlation between catalytic activity and support reducibility in the CO2 reforming of methane over Pt/CexZr1−xO2 catalysts. Chem Eng J. 2001;82:21–31.
- Silva PP, Silva FA, Souza HP, Lobo AG, Mattos LV, Noronha FB, Hori CE. Partial oxidation of methane using Pt/CeZrO2/Al2O3 catalysts – effect of preparation methods. Catal Today. 2005;101:31–37.
- Mastalir A, Frank B, Szizybalski A, Soerijanto H, Deshpande A, Niederberger M, Schomacker R, Schlogl R, Ressler T. Steam reforming of methanol over Cu/ZrO2/CeO2 catalysts: a kinetic study. J Catal. 2005;230:464–475.
- Gennari FC, Montini T, Hickey N, Fornasiero P, Graziani M. IR investigation of the interaction of deuterium with Ce0.6Zr0.4O2 and Cl-doped Ce0.6Zr0.4O2. Appl Surface Sci. 2006;252:8456–8465.
- Chiodelli G, Flor G, Scagliotti M. Electrical properties of the ZrO2-CeO2 system. Solid State Ionics. 1996;91:109–121.
- Izu N, Shin W, Matsubara I, Murayama N. Resistive oxygen gas sensors using ceria-zirconia thick films. J Ceramic Soc Jpn. 2004;112:S535–S539.
- Izu N, Oh-hori N, Itou M, Shin W, Matsubara I, Murayama N. Resistive oxygen gas sensors based on Ce1-xZrxO2 nano powder prepared using new precipitation method. Sens Actuators B. 2005;108:238–243.
- Rajabbeigi N, Elyassi B, Khodadadi AA, Mohajerzadeh SS, Sahimi M. A novel miniaturized oxygen sensor with solid-state ceria-zirconia reference. Sens Actuators B. 2004;100:139–142.
- Elyassi B, Rajabbeigi N, Khodadadi AA, Mohajerzadeh SS, Sahimi M. An yttria-doped ceria-based oxygen sensor with solid-state reference. Sens Actuators B. 2004;103:178–183.
- Rajabbeigi N, Elyassi B, Khodadadi AA, Mohajerzadeh S, Mortazavi Y, Sahimi M. Oxygen sensor with solid-state CeO2-ZrO2-TiO2 reference. Sens Actuators B. 2005;108:341–345.
- Sahoo SK, Mohapatra M, Singh AK, Anand S. Hydrothermal synthesis of single crystalline nano CeO2 and its structural, optical, and electronic characterization. Mater Manufacturing Processes. 2010;25:982–989.
- Nelson AE, Schulz KH. Surface chemistry and microstructural analysis of CexZr1-xO2-y model catalyst surfaces. Appl Surface Sci. 2003;210:206–221.
- Devaiah D, Reddy LH, Kuntaiah K, Reddy BM. Design of novel ceria based nano oxides for CO oxidation and other catalytic applications. Indian J Chem. 2012;51A:186–195.
- Sahoo SK, Mohapatra M, Anand S. Characterization and optical properties of Eu-doped nano ceria synthesized by co-precipitation-hydrothermal route. J Korean Phys Soc. 2013;62(2):297–304.
- Ying JY, Tschope A. Synthesis and characteristics of non-stoichiometric nanocrystalline cerium oxide-based catalysts. Chem Eng J. 1996;64:225–237.
- Lee J-S, Choi S-C. Crystallization behavior of nano-ceria powders by hydrothermal synthesis using a mixture of H2O2 and NH4OH. Mater Lett. 2004;58:390–393.
- Ornatska M, Sharpe E, Andreescu D, Andreescu S. Paper bioassay based on ceria nanoparticles as colorimetric probes. Anal Chem. 2011;83:4273–4280.
- Chen LF, Gonzalez G, Wang JA, Norena LE, Toledo A, Castillo S, Moran-Pineda M. Surfactant-controlled synthesis of Pd/Ce0.6Zr0.4O2 catalyst for NO reduction by CO with excess oxygen. Appl Surface Sci. 2005;243:319–328.
- McBride JR, Hass KC, Poindexter BD, Weber WH. Raman and X-ray studies of Ce1-xRExO2-y, where RE = La, Pr, Nd, Eu, Gd, and Tb. J Appl Phys. 1994;76:2435–2441.
- Fornasiero P, Balducci G, Monte RD, Kaspar J, Sergo V, Gubitosa G, Ferrero A, Graziani M. Modification of the redox behaviour of CeO2 induced by structural doping with ZrO2. J Catal. 1996;164:173–183.
- Willinton HY, Miguel CA, Francisca RS, Jose OA. Synthesis and characterization of Ce1-xEuxO2-x/2 mixed oxides and their catalytic activities for CO oxidation. J Phys Chem C. 2009;113:5629–5635.
- Ungureanu AM, Andronescu C, Voicu G, Scoban A, Opera O, Stanica N, Jitaru I. Structural characterization and luminescence properties of paramagnetic Mn doped SnO2 nano particles obtained via simple butanol assisted sol-gel synthesis. Digest J. Nanomater Biostruct. 2013;8:1169–1178.
- Guo M, Lu J, Wu Y, Wang Y, Luo M. UV and visible Raman studies of oxygen vacancies in rare-earth-doped ceria. Langmuir. 2011;27:3872–3877.
- Reddy BM, Bharali P, Thrimurthulu G, Saikia P, Katta L, Park SE. Catalytic efficiency of ceria–zirconia and ceria–hafnia nanocomposite oxides for soot oxidation. Catalysis Lett. 2008;123:327–333.
- Koao LF, Swart HC, Coetsee E, Biggs MM, Dejene FB. The effect of Mg2+ ions on the photoluminescence of Ce3+-doped silica. Phys B. 2009;404:4499–4503.
- Santos MLD, Lima RC, Riccardi CS, Tranquilin RL, Bueno PR, Varela JA, Longo E. Preparation and characterization of ceria nanospheres by microwave-hydrothermal method. Mater Lett. 2008;62:4509–4511.
- Chai C, Yang S, Liu Z, Liao M, Chen N. Violet/blue photoluminescence from CeO2 thin film. Chin Sci Bull. 2003;48:1198–1200.
- Masui T, Fujiwara K, Machida K, Adachi G, Sakata T, Mori H. Characterization of cerium(IV) oxide ultrafine particles prepared using reversed micelles. Chem Mater. 1997;9:2197–2204.
- Zhang H, Bayne M, Fernando S, Legg B, Zhu M, Lee PR, Banfield JFJ. Size dependant bandgap of nano goethite. Phys Chem C. 2011;115:17704–17710.
- Gleiter H. Nanostructured materials: state of the art and perspectives. Zeitschr Metallk. 1995;86:78–83.
- Yu SH, Colfen H, Fischer A. High quality CeO2 nanocrystals stabilized by a double hydrophilic block copolymer. Colloids Surf A. 2004;243:49–52.
- Chen HI, Chang HY. Synthesis and characterization of nanocrystalline cerium oxide powders by two-stage non-isothermal precipitation. Solid State Commun. 2005;133:593–598.
- Morshed AH, Moussa ME, Bedair SM, Leonard R, Liu SX, El-Masry N. Violet blue emission from epitaxial cerium oxide films on silicon substrates. Appl Phys Lett. 1997;70(13):1647–1649.
- Ansari AA. Optical and structural properties of sol–gel derived nanostructured CeO2 film. J Semiconductors. 2010; 31(5):053001-1–5.
- Souza ECC, Britob HF, Muccilloa ENS. Optical and electrical characterization of samaria-doped ceria. J Alloys Compd. 2010;491:460–464.
- Wang Z, Quan Z, Lin J. Remarkable changes in the optical properties of CeO2 nanocrystals induced by lanthanide ions doping. Inorg Chem. 2007;46:5237–5242.