
Abstract
Cr-doped SnO2 nanoparticles have been synthesised by the hydrothermal route, using SnCl4·5H2O as the host precursor and C15H21CrO6 as the source of dopant. The structural and morphological studies have been carried out by X-ray diffraction, transmission electron microscopy and scanning electron spectroscopy, which reveal a tetragonal rutile structure of SnO2 nanoparticles and improvement in the crystallinity upon Cr doping. Compositional analyses by energy-dispersive X-ray confirm the incorporation of Cr ions into the SnO2 lattice. The existence of defect levels in the visible region has been studied by photoluminescence. The room-temperature electrical conductivity decreases with Cr doping due to the replacement of Sn4+ ions by Cr3+ ions. The response to acetone has been found to improve with the increase of Cr-doping concentration relative to the undoped SnO2, except in the case of 0.5 at% Cr-doped sample where it decreases at low concentrations (up to 30 ppm) and operating temperatures (up to 200 °C). The response time decreases with the increasing Cr-doping concentration and is found to be minimum for the 1.5 at% Cr-doped SnO2. A possible reaction mechanism of acetone sensing has been explained.
1. Introduction
Chemical gas sensors based on nanostructured metal-oxide semiconductors have wide applications in environmental, biological and analytical chemical sciences.[Citation1,2] Tin oxide (SnO2) belongs to the important family of metal-oxide semiconductors. In its stoichiometric form SnO2 acts as an insulator, but in its oxygen-deficient form tin oxide behaves as an n-type semiconductor with a band gap of 3.6 eV at 300 K. Although the conductivity is thought to be due to intrinsic defect formation, the exact mechanism is not well understood.[Citation3] Oxygen deficiency may be caused by either oxygen vacancies or tin interstitials, with reduction of some Sn(IV) ions to Sn(II) as a possible charge compensation mechanism.[Citation4]
As the research on SnO2 went on in-depth, more interesting properties and potential applications have been discovered for this material. One such attractive aspect of SnO2 is that it has a diverse group of growth morphologies, such as quantum dots,[Citation5] nanorod clusters,[Citation6] nanobelts [Citation7] and nanowires.[Citation8] Due to its interesting electrical and optical properties derived from the nanostructures, SnO2 finds immense applications as transparent conducting electrodes in solar cells,[Citation9] heat-reflecting mirrors,[Citation10,11] gas sensors,[Citation12,13] etc. The sensitivity of SnO2 for various sensor applications is enhanced with the development of nanostructures due to increased surface-to-volume ratio.
Acetone, which is used as a chemical reagent in industry and mostly used to dissolve plastic, purify paraffin and dehydrate tissues, is harmful when emitted into the environment. Inhalation of acetone causes headache, fatigue and even narcosis and is harmful to the nervous system;[Citation14] hence, it is necessary to monitor acetone concentration in the environment of workplace for safety of human health. In addition, acetone monitoring has medical significance as acetone concentration in blood correlates with the concentration of acetone in breath of diabetic patients.[Citation15] This correlation suggests that invasive acetone monitoring in patient's blood may be replaced by detecting the expiration gas by acetone sensors.
In this article, we have studied Cr-doping-induced modifications in the structural, optical and acetone-sensing behaviour of hydrothermally synthesised SnO2 nanoparticles. It has been observed that the response to acetone of the SnO2 nanoparticles increases upon Cr doping. Ibrahim et al. [Citation16] investigated the structural and optical properties of undoped and chromium-doped tin oxide prepared by sol–gel method. Magnetic properties of Cr-doped SnO2 and the effects of oxygen vacancy (VO) on the magnetic properties were examined by Wei et al. [Citation17]. Zhang et al. [Citation18] studied ferromagnetic properties in undoped and Cr-doped SnO2 nanowires. As far as we know, the acetone response characteristics of Cr-doped SnO2 nanoparticles have not been reported in the literature.
2. Experimental details
All the chemicals were used without further purification. Undoped and Cr-doped SnO2 nanoparticles were synthesised using the hydrothermal method. Stannic tetrachloride hydrated (SnCl4·5H2O) was used as the source of host SnO2 system and chromium(III) acetyl acetonate (C15H21CrO6) as the source of Cr dopant. In this typical experiment, 10 mmol of d-glucose hydrate and 5 mmol of SnCl4·5H2O were dissolved in a mixture of distilled water and ethanol to form a transparent colourless solution, and then C15H21CrO6 was added to the solution. The dopant concentration (at% Cr to Sn) was varied from 0 to 1.5 at%. The solution was transferred into a teflon-lined autoclave. The autoclave was placed in a hot air oven and kept at 180 °C for 20 h before it was cooled in air. The black residue was collected and washed with water and ethanol several times and dried at 50 °C for a few hours. The residue was then calcined at 400 °C for 2 h in air. On calcination, the black residue turned white, which indicated the successful removal of carbon by oxidizing in air. The dried mass was then crushed into fine powder for further characterisation. The samples were characterised by X-ray diffraction (XRD), which was carried out using a Bruker D8 Advance X-Ray Diffractometer with Cu Kα radiation (λ = 1.54056 Å) as the X-ray source at 40 kV and 30 mA in the scanning angle from 20° to 80°. The shape and size of SnO2 were investigated by transmission electron microscopy (TEM), which was carried out by an FEI Tecnai G2 20 with an accelerating voltage of 200 kV. The morphological and compositional analyses of the as-prepared undoped and Cr-doped SnO2 samples were done by JEOL scanning electron microscope (SEM) equipped with an energy-dispersive X-ray (EDX) system. The photoluminescence (PL) measurements were carried out by a PerkinElmer L55 spectrofluorometer.
The fine powders, both undoped and Cr-doped SnO2, separately were pressed into pellets of 11 mm diameter and 1.5 mm thickness at a pressure of ∼15 MPa using a hydraulic press. These pellets were sintered at around 150 °C for 2 h in air. High-temperature silver paste was used for making ohmic contacts on the two flat surfaces of the sintered pellets. The acetone response characteristics of the undoped and Cr-doped SnO2 samples were investigated at different operating temperatures for various concentrations of acetone in air.
3. Results and discussion
3.1. Structural analyses
The XRD spectra of the undoped and Cr-doped SnO2 nanoparticles are shown in . It has been observed that all the strong reflections show a tetragonal rutile structure of SnO2 nanoparticles, which are in agreement with JCPDS card no. 72-1147. No other impurity phases of Cr are found. It has been noticed that the intensities of the peaks (110), (101), (200), (211) and (301) are diminished, and the corresponding full width at half maximum is decreased with the increase of Cr content in the samples, indicating chromium improves the crystallinity of the samples. The change in crystallinity and crystallite size between the undoped and doped nanoparticles has been explained based on the variation in the density of nucleation centres created just at the time of nanoparticles (NPs)’ growth.[Citation19] More is the density of nucleation centres, smaller is the crystallite size and vice versa. In fact, it is well established that the density of nucleation centres influences the shape and size of crystallites. As the process parameters during the NPs’ growth (both undoped and Cr-doped) remain unchanged except the introduction of different Cr content, the change in crystallinity and crystallite size between the undoped and doped NPs is attributed to the change in the nucleation growth pattern on Cr doping. Similar results have been reported by other researchers. Ibrahim et al. [Citation16] observed variation in diffraction peak intensity in the Cr-doped SnO2 thin films prepared by sol–gel method. Liu et al. [Citation20] reported that the diffraction peak in the Cr-doped films grown by reactive dc magnetron co-sputtering technique is gradually reduced with the increase of Cr-doping concentration.
Figure 1. XRD spectra of the undoped and Cr-doped SnO2 nanoparticles.
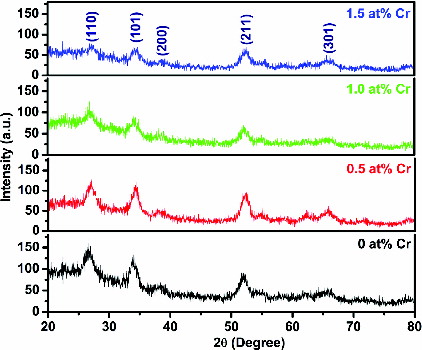
As the concentration of Cr dopant increases in the SnO2, the diffraction peak positions shift towards higher values of 2θ relative to the undoped SnO2 nanoparticles. This shift in the peak position arises due to the fact that the ionic radii of Sn4+ and Cr3+ are 0.069 nm and 0.063 nm, respectively. Consequently, the lattice spacing (d) between different planes is expected to decrease when the Cr3+ ions are substituted into the Sn4+ sites in the SnO2 lattice. This is found in agreement with the XRD results where d-spacing between the lattice planes decreases, listed in .
Table 1. XRD analyses of the undoped and Cr-doped SnO2 nanoparticles.
The lattice parameters (a = b, c), the average crystallite size and the lattice strain, have been determined by the relationship between interplanar spacing and lattice parameters, the Scherrer formula and the tangent formula, respectively [Citation21] and are listed in . The average crystallite size of the doped films has been found to increase as compared to that of the undoped film. Upon Cr doping, the lattice parameters of the SnO2 decrease relative to the undoped sample. Variation in lattice parameters is attributed to the incorporation of Cr ions into SnO2 lattice as Sn4+ and Cr3+ ions are of different ionic radii.
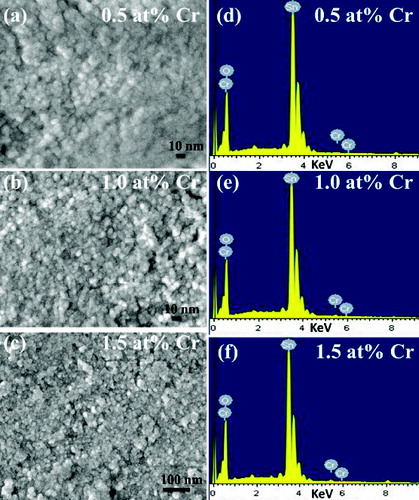
(a)–(d) depicts the TEM images of the undoped and Cr-doped SnO2 nanoparticles. The micrographs show agglomeration of nanoparticles (cluster of primary crystallites). A minute observation of the images reveals that on 0.5 at% Cr doping, the grains become coalesced to some extent. On increasing doping to 1 at%, coalescences of the grains are pronounced. However, on further doping to 1.5 at%, the grains are not coalesced and the grain size appears to be almost similar to that of the undoped sample. (a)–(c) presents the high resolution scanning electron microscopy (HRSEM) images of the Cr-doped SnO2 nanoparticles, which show the uniform polycrystalline surface morphology with densely populated grains. Nearly, all the grains are spherical in shape. As shown in the images, the grain size decreases in the case of 1 at% Cr-doped sample, and the grains look more fused together in the case of 1.5 at% Cr-doped sample. Compositional analyses of the Cr-doped samples are depicted in the EDX spectra ((d)–(f)). The spectra show chromium peaks implying incorporation of Cr ions into SnO2 lattice. Additional peaks next to Sn in the EDX spectra arise due to gold coating on the samples before imaging. Furthermore, Hume-Rothery rules of substitutional solid solution suggest that substitutional incorporation of dopant is possible if the ionic radii of the host atom and the dopant must not differ by more than 15%.[Citation22] In this investigation, the ionic radii of Sn4+ and Cr3+ are 0.069 and 0.063 nm, respectively, which are well within 15% difference. This shows that Cr ions substitutionally replace Sn ions in the SnO2 lattice.
Figure 2. TEM images of the undoped and Cr-doped SnO2 nanoparticles.
Figure 3. HRSEM and EDX images of the Cr-doped SnO2 nanoparticles.
3.2. Photoluminescence studies
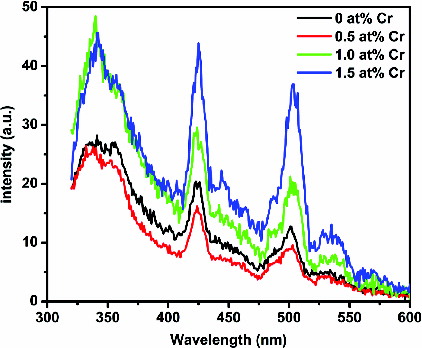
shows the room-temperature PL spectra of the as-synthesised undoped and Cr-doped SnO2 nanoparticles under excitation at the wavelength of 290 nm. There are three strong emissions corresponding to 341, 425 and 505 nm along with a few weak bands observed at 356, 445 and 535 nm, respectively. The energy corresponding to the PL band at 341 nm is 3.60 eV, which is equal to the optical band gap of bulk SnO2 (3.60 eV at 300 K), suggesting the band edge emission. Since the positions of the emission maxima are nearer to the respective band gap of the SnO2, these emissions may be attributed to the direct recombination of a conduction electron in the Sn 4p band and a hole in the O 2p valence band. PL emissions at 425 and 505 nm ascribed as visible emissions are due to oxygen vacancies, which are mostly present in the three different charge states: ,
and
.[Citation23] In polycrystalline oxide semiconductors, oxygen vacancies are the dominant defects and form donor levels, which usually play an important role in the PL process. The weak bands at 356, 445 and 535 nm can be attributed to electron transition mediated by defect levels in the band gap.
Figure 4. PL spectra of the undoped and Cr-doped SnO2 nanoparticles.
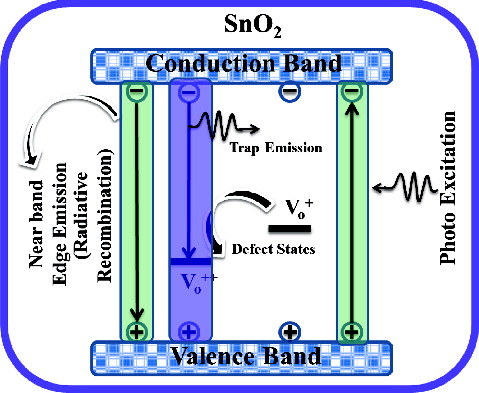
The schematic representation of PL mechanism is presented in . There are mainly two types of relaxation processes that occur after photoexcitation of the electrons from the valence band to the conduction band. In the first process, electrons in the conduction band and holes in the valence band may recombine radiatively to give near-band-edge (NBE) emission. In this study, the PL peak at 341 eV corresponds to this process. Whilst in the second one, the active hole in the valence band captures an electron from deep trap (), resulting in the formation of
centre which gives rise to visible emission when a conduction band electron recombines with the
centre.[Citation24] As evident from , after introducing Cr3+ ions (1.0 and 1.5 at%) into the host SnO2, the oxygen-vacancies-related luminescence has been enhanced resulting from the formation of many more oxygen vacancies.
Figure 5. Schematic representation of photoluminescence mechanism.
3.3. Electrical studies
shows the variation of electrical conductivity as a function of temperature for the undoped and Cr-doped SnO2 nanoparticles. It has been observed that the room-temperature electrical conductivity decreases as the Cr-doping concentration increases. The decrease in conductivity with doping concentration is attributed to the replacement of Sn4+ ions by Cr3+ ions, which causes deficiency of electrons or creation of holes. As evident from the figure, all the samples exhibit the three-region-behaviour. In region I, the increase in conductivity is attributed to the thermal excitation of electrons into the conduction band. The decrease in conductivity in region II is related to the oxygen adsorption on the sample surface. Finally, the conductivity in region III increases again, probably due to the dominant thermal excitation of electrons and the desorption of adsorbed oxygen species from the sample surface at higher temperature. Similar results have been reported by other researchers.[Citation25,26]
Figure 6. Variation of electrical conductivity as a function of temperature for the undoped and Cr-doped SnO2 nanoparticles.
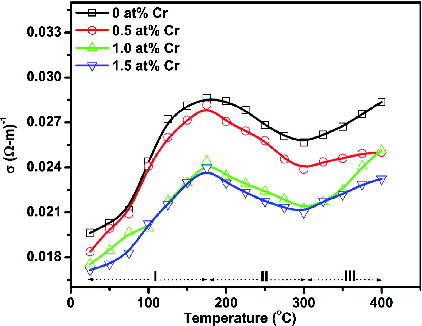
In fact, two competing processes, namely thermal excitation of electrons and oxygen adsorptions, occur simultaneously. Thermal excitation of electrons improves the conductivity, whereas the oxygen adsorptions on the sample surface reduce the conductivity. It has been reported that on heating the adsorption of atmospheric oxygen forms ionic species such as O2−, O2− and O− which acquire electrons from the conduction band, resulting in a decrease in the conductivity. The reaction kinetics is as follows [Citation21]:
(1a)
(1b)
(1c) The activation energy, ΔE, for thermal excitation of electrons has been determined from Arrhenius plot (lnσ versus 1/T) using the following relation [Citation27]:
(2) where the symbols have their usual significance. The activation energies thus determined are listed in .
Table 2. Activation energies of the undoped and Cr-doped SnO2 nanoparticles.
3.4. Acetone-sensing studies
The responses to 10–50 ppm acetone of the undoped and Cr-doped SnO2 as a function of operating temperatures are shown in . The sensor response (S) has been defined as the ratio of change in the sample resistance upon exposure to acetone to the sample resistance in air (at the same operating temperatures) and is given by the following equation:
(3)
Figure 7. Acetone response characteristics of the undoped and Cr-doped SnO2 nanoparticles at different operating temperatures and test gas concentrations.
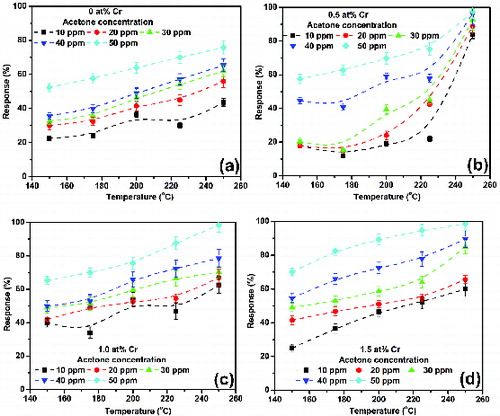
For all the samples, the responses increase with the increasing operating temperatures, which are obviously due to more adsorption of oxygen species on the sample surface at higher operating temperatures. This is in agreement with the results obtained from electrical studies, described in Section 3.3. The increase in response with the enhanced gas concentration for all operating temperatures is attributed to dense surface coverage of acetone molecules to SnO2 at higher concentrations. The response to acetone has been found to improve with the increase of Cr-doping concentration relative to the undoped SnO2, except in the case of 0.5 at% Cr-doped sample where it decreases at low concentrations (up to 30 ppm) and operating temperatures (up to 200 °C). The increase in response with the increased dopant concentration suggests that chromium content favours the adsorption of atmospheric oxygen on the sample surface, resulting in the creation of a large number of sensing sites. Relative to the undoped sample, decrease in response at low concentrations and low temperatures observed in the 0.5 at% Cr-doped sample may be due to insufficient thermal energy available to react the acetone molecules with the adsorbed oxygen species. In fact, during adsorption of atmospheric oxygen on the sample surface, a potential barrier to charge transport is developed.[Citation28] As a result, at low operating temperatures, the response is restricted by the speed of chemical reaction because the released electrons during chemical reaction may not have enough thermal energy to surmount the potential barrier for charge transport.
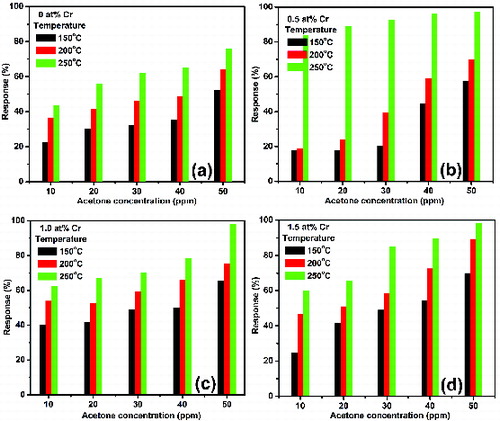
As evident from , all the Cr-doped SnO2 exhibit maximum response at 250 °C because of the availability of sufficient thermal energy at higher temperatures which, in turn, results in rapid chemical reaction to occur and therefore increase in response. A careful observation reveals that at the operating temperature of 250 °C the response is maximum in the case of 0.5 at% Cr-doped sample, whereas at 150 °C the response is maximum in 1 at% Cr-doped sample for low concentration, and at 200 °C it is maximum in 1.5 at% Cr-doped sample for high concentration. Such variation in response is attributed to many factors such as crystallinity, lattice strain and structural defects arisen at the time of crystallite growth of the samples.
Figure 8. Acetone response characteristics of the undoped and Cr-doped SnO2 nanoparticles as a function of concentration at three different operating temperatures 150, 200 and 250 °C.
When the undoped and Cr-doped SnO2 are exposed to the reducing gas, such as acetone, the acetone may react with the adsorbed oxygen species, resulting in the release of electrons which, in turn, reduce the sample resistance. The reaction mechanism between acetone and oxygen species adsorbed on the sample surface may take place by two different ways [Citation29]:
(4a)
(4b)
(4c)
(5a)
(5b)
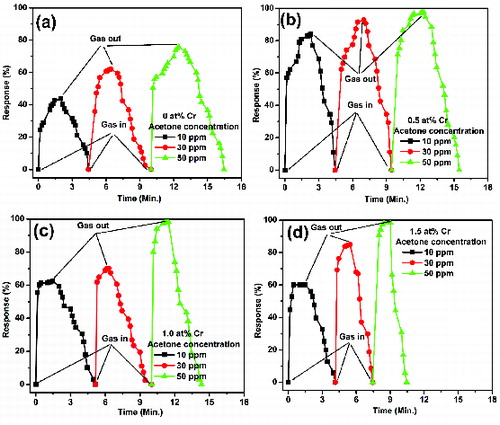
(5c) Transient response characteristics of the undoped and Cr-doped SnO2 at the operating temperature of 250 °C for three different concentrations (10, 30 and 50 ppm) are shown in . It has been observed that the response time decreases with the increasing Cr doping concentration and found to be minimum for the 1.5 at% Cr-doped SnO2 because of its smallest crystallite size among all the doped samples and thus to provide more exposed areas of the sample for sensing.
Figure 9. Transient response characteristics of the undoped and Cr-doped SnO2 nanoparticles at the operating temperature of 250 °C for three different acetone concentrations 10, 30 and 50 ppm.
4. Conclusions
Hydrothermally synthesised Cr-doped SnO2 nanoparticles have been found to possess a tetragonal rutile structure with crystallite size in the 6–8 nm range. EDX analyses confirm the incorporation of Cr ions into the SnO2 lattice. The room-temperature PL spectra exhibit three strong emissions corresponding to 341, 425 and 505 nm along with a few weak bands observed at 356, 445 and 535 nm, respectively. Temperature variation of the electrical conductivity of the samples has been explained based on two simultaneously occurring competing processes, namely thermal excitation of electrons and adsorption of atmospheric oxygen. It has been observed that the undoped and Cr-doped SnO2 exhibit maximum response to acetone at the operating temperature of 250 °C, which is attributed to the chemisorption of atmospheric oxygen on the oxide (sample) surface and the subsequent reaction between the acetone molecules and the adsorbed oxygen species.
Acknowledgements
The authors are grateful to the Head, Institute Instrumentation Centre, Indian Institute of Technology, Roorkee, India, for providing XRD facility. They are grateful to All India Institute of Medical Sciences (SAIF, New Delhi) for TEM facility. They would wish to further express their gratitude to Professor M. Aslam, Department of Physics, Indian Institute of Technology Bombay, India, for providing facilities for HRSEM, EDX and PL measurements. They also acknowledge the financial support provided by the University Grants Commission, New Delhi, India, in the form of a major research project (No. 40-450/2011 (SR)).
References
- Wang J. Nanomaterial-based electrochemical biosensors. Analyst. 2005;130:421–426.
- Luo X, Morrin A, Killard AJ, Smyth MR. Application of nanoparticles in electrochemical sensors and biosensors. Electroanalysis. 2006;18:319–326.
- Godinho KG, Walsh A, Watson GW. Energetic and electronic structure analysis of intrinsic defects in SnO2. J Phys Chem. 2009;C113:439–448.
- Maestre D, Ramirez-Castellanos J, Hidalgo P, Cremades A, Gonzalez-Calbet JM, Piqueras J. Study of the defects in sintered SnO2 by high-resolution transmission electron microscopy and cathodoluminescence. Eur J Inorg Chem. 2007;2007:1544–1548.
- Zhu H, Yang D, Yu G, Zhang H, Yao K. A simple hydrothermal route for synthesizing SnO2 quantum dots. Nanotechnology. 2006;17:2386–2389.
- Cheng G, Wu K, Zhao P, Cheng Y, He X, Huang K. Solvothermal controlled growth of Zn-doped SnO2 branched nanorod clusters. J Cryst Growth. 2007;309:53–59.
- Lu N, Wan Q, Zhu J. Surface structure of zigzag SnO2 nanobelts. J Phys Chem Lett. 2010;1:1468–1471.
- Shen Y, Yamazaki T, Liu Z, Meng D, Kikuta T, Nakatani N, Saito M, Mori M. Microstructure and H2 gas sensing properties of undoped and Pd-doped SnO2 nanowires. Sens Actuators B. 2009;135:524–529.
- Chappel S, Chen S-G, Zaban A. TiO2-coated nanoporous SnO2 electrodes for dye-sensitized solar cells. Langmuir. 2002;18:3336–3342.
- Kojima M, Takahashi F, Kinoshita K, Nishibe T, Ichidate M. Transparent furnace made of heat mirror. Thin Solid Films. 2001;392:349–354.
- Choudhury C, Sehgal HK. Chemical vapour deposited SnO2:Sb heat mirror coatings for cylindrical solar collectors. Energy Conversion Manag. 1989;29:265–272.
- Kim SS, Na HG, Choi S-W, Kwak DS, Kim HW. Novel growth of CuO-functionalized, branched SnO2 nanowires and their application to H2S sensors. J Phys D: Appl Phys. 2012;45:205301.
- Kida T, Fujiyama S, Suematsu K, Yuasa M, Shimanoe K. Pore and particle size control of gas sensing films using SnO2 nanoparticles synthesized by seed-mediated growth: design of highly sensitive gas sensors. J Phys Chem. C 2013;117:17574–17582.
- Wang C, Sahay P. Breath analysis using laser spectroscopic techniques: breath biomarkers, spectral fingerprints, and detection limits. Sensors. 2009;9:8230–8262.
- Turner C, Walton C, Hoashi S, Evans M. Breath acetone concentration decreases with blood glucose concentration in type I diabetes mellitus patients during hypoglycaemic clamps. J Breath Res. 2009;3:046004.
- Ibrahim NB, Abdi MH, Abdullah MH, Baqiah H. Structural and optical characterization of undoped and chromium dopedtin oxide prepared by sol–gel method. Appl Surf Sci. 2013;271:260–264.
- Wei W, Dai Y, Guo M, Zhang Z, Huang B. Effects of oxygen vacancy on the magnetic properties of Cr-doped SnO2: density functional investigation. J Solid State Chem. 2010;183:3073–3077.
- Zhang L, Ge S, Zuo Y, Wang J, Qi J. Ferromagnetic properties in undoped and Cr-doped SnO2 nanowires. Scripta Materialia. 2010;63:953–956.
- Riad AS, Mahmoud SA, Ibrahim AA. Structural and DC electrical investigations of ZnO thin films prepared by spray pyrolysis technique. Physica B. 2001;296:319–325.
- Liu S-J, Chen L-Y, Liu C-Y, Fang H-W, Hsieh J-H, Juang J-Y. Physical properties of polycrystalline Cr-doped SnO2 films grown on glasses using reactive dc magnetron co-sputtering technique. Appl Surf Sci. 2011;257:2254–2258.
- Mishra RK, Sahay PP. Synthesis, characterization and alcohol sensing property of Zn-doped SnO2 nanoparticles. Ceramics Int. 2012;38:2295–2304.
- Raghavan V. Materials science and engineering. New Delhi: Prentice Hall of India; 1996.
- Mishra RK, Pandey K Shiv, Sahay PP. Influence of In doping on the structural, photo-luminescence and alcohol response characteristics of the SnO2 nano particles. Mater Res Bull. 2013;48:4196–4205.
- Chen S, Zhao X, Xie H, Liu J, Duan L, Ba X, Zhao J. Photoluminescence of undoped and Ce-doped SnO2 thin films deposited by sol–gel-dip-coating method. Appl Surf Sci. 2012;258:3255–3259.
- Manoj PK, Joseph B, Vaidyan VK, Amma DSD. Preparation and characterization of indium-doped tin oxide thin films. Ceramics Int. 2007;33:273–278.
- White ME, Bierwagen O, Tsai MY, Speck JS. Synthesis and characterization of highly resistive epitaxial indium-doped SnO2. Appl Phys Expr. 2010;3:51101–51103.
- Natsuhara H, Tatsuyama T, Ushiro M, Furuhashi M, Fujii T, Ohashi F, Yoshida N, Nonomura S. Preparation of SnO2 thin films at low temperatures with H2 gas by the hot-wire CVD method. Thin Solid Films. 2011;519:4538–4541.
- Mishra RK, Kushwaha A, Sahay PP. Influence of Cu doping on the structural, photoluminescence and formaldehyde sensing properties of SnO2 nanoparticles. RSC Adv. 2014;4:3904–3912.
- Sahay PP. Zinc oxide thin film gas sensor for detection of acetone. J Mater Sci. 2005;40:4383–4385.